Academic Profile
Statistics
Similar Authors
Papers on arXiv
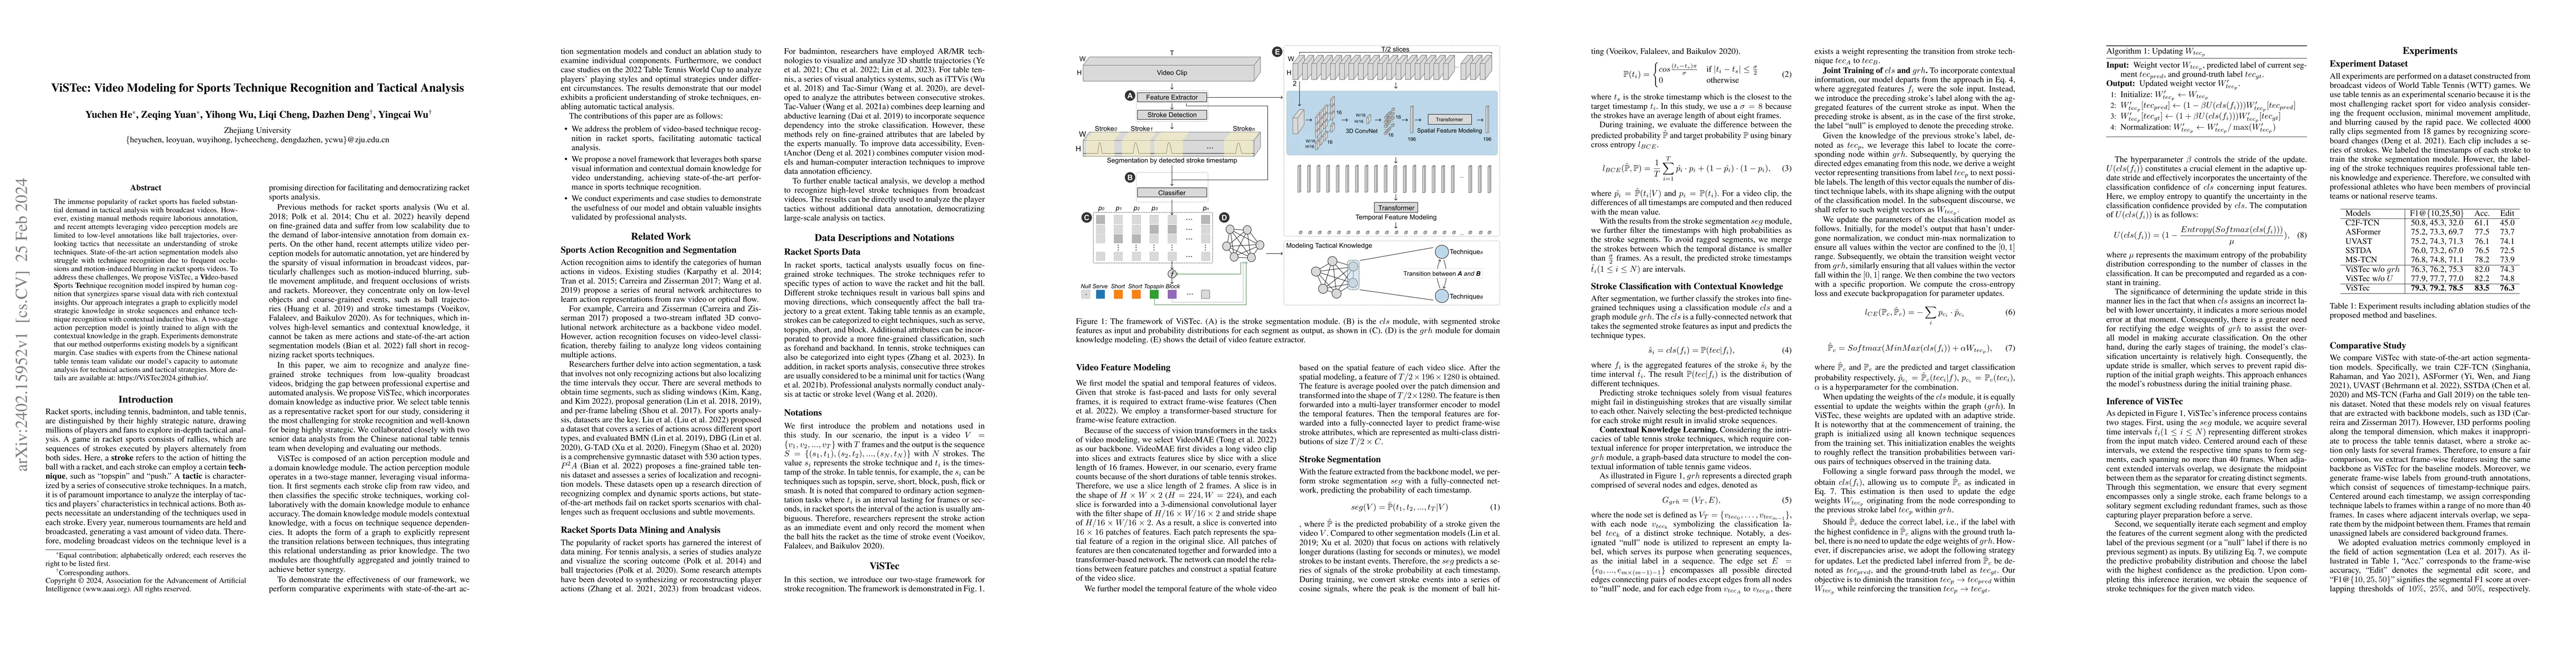
The immense popularity of racket sports has fueled substantial demand in tactical analysis with broadcast videos. However, existing manual methods require laborious annotation, and recent attempts l...
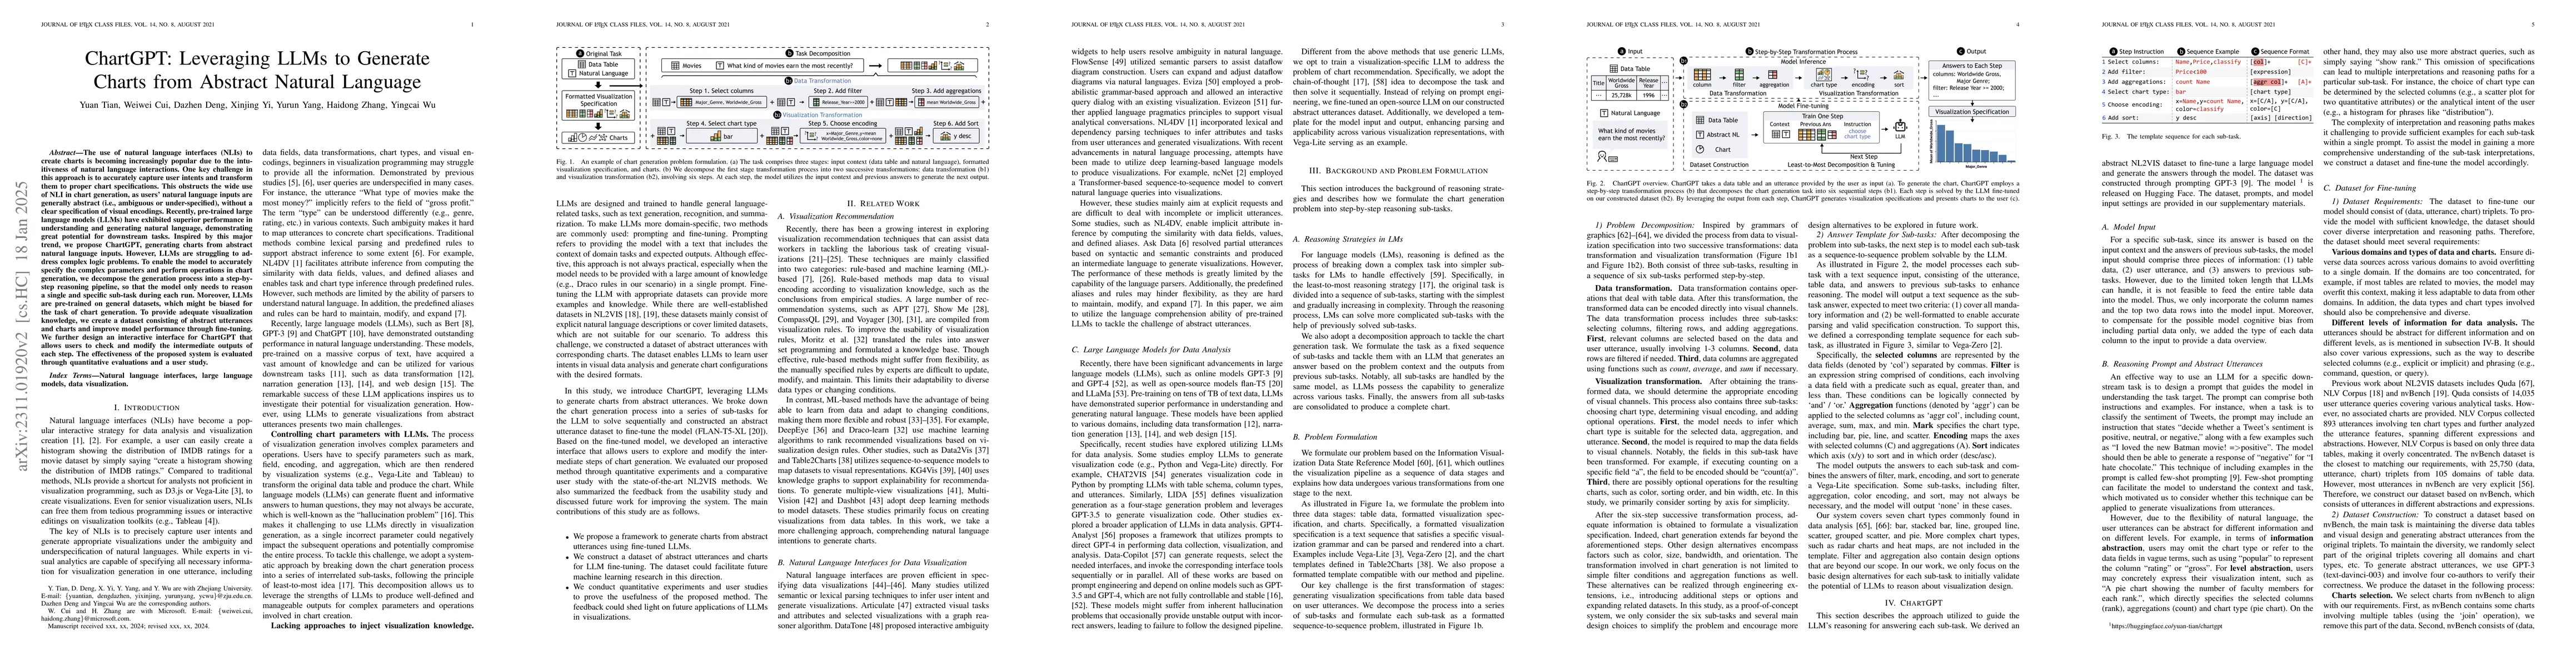
The use of natural language interfaces (NLIs) for the creation of charts is becoming increasingly popular due to the intuitiveness of natural language interactions. One key challenge in this approac...
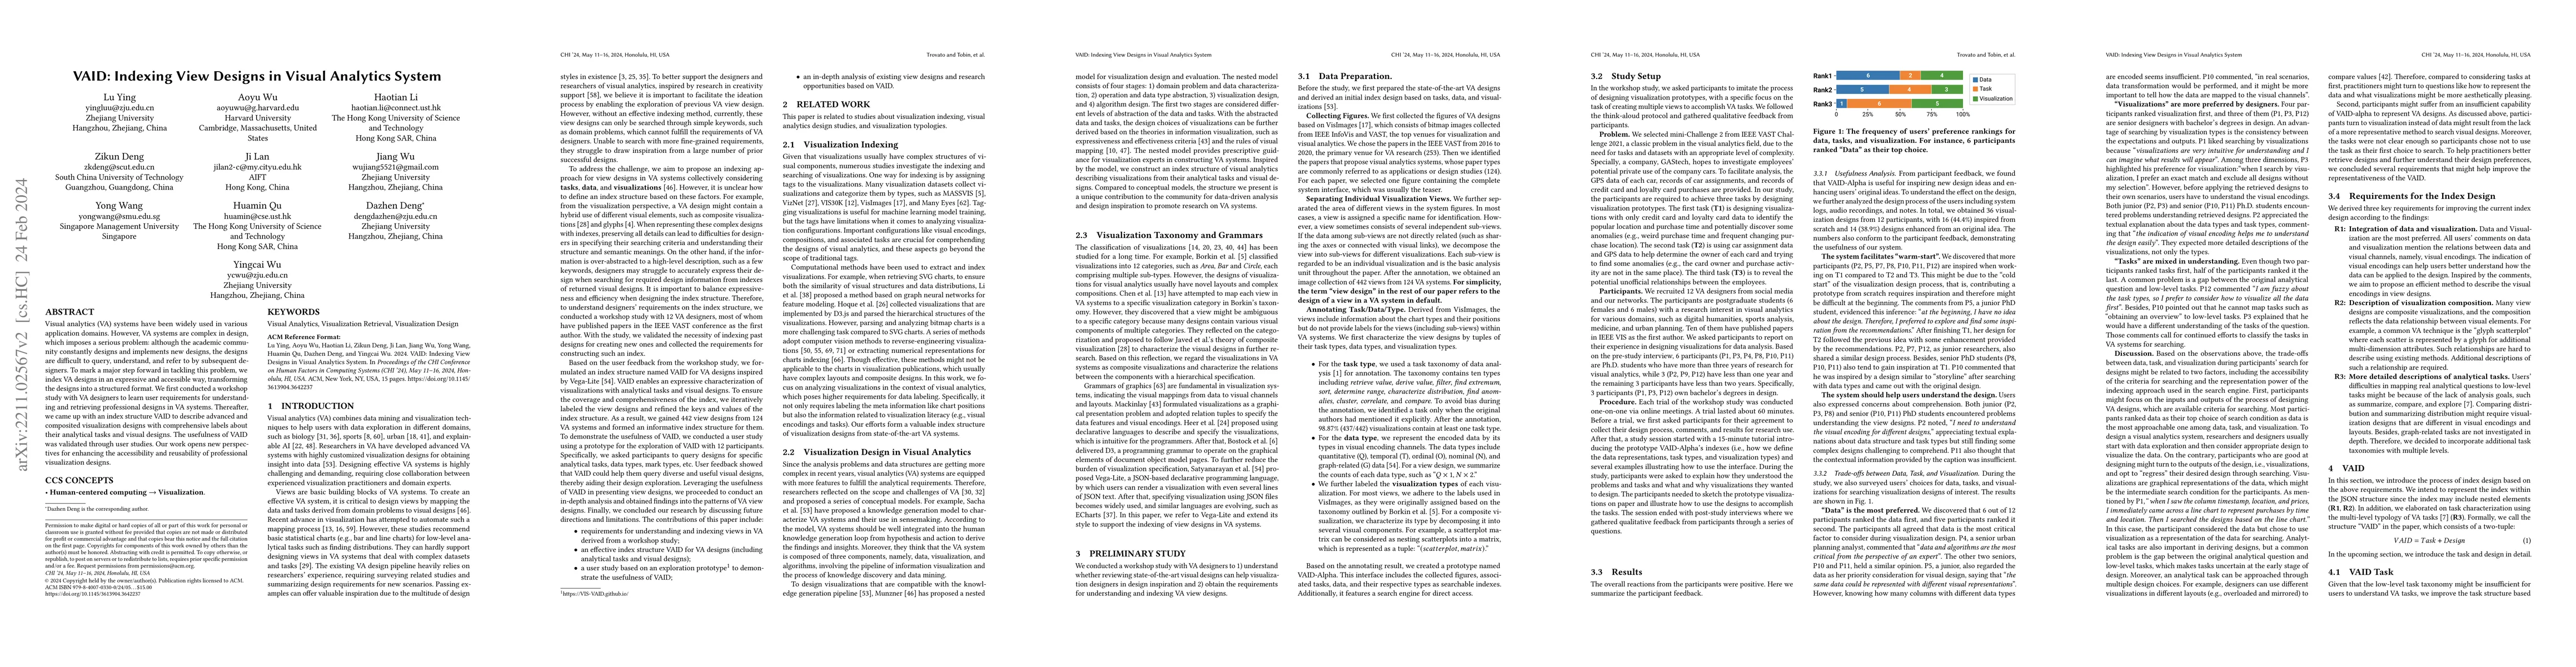
Visual analytics (VA) systems have been widely used in various application domains. However, VA systems are complex in design, which imposes a serious problem: although the academic community consta...
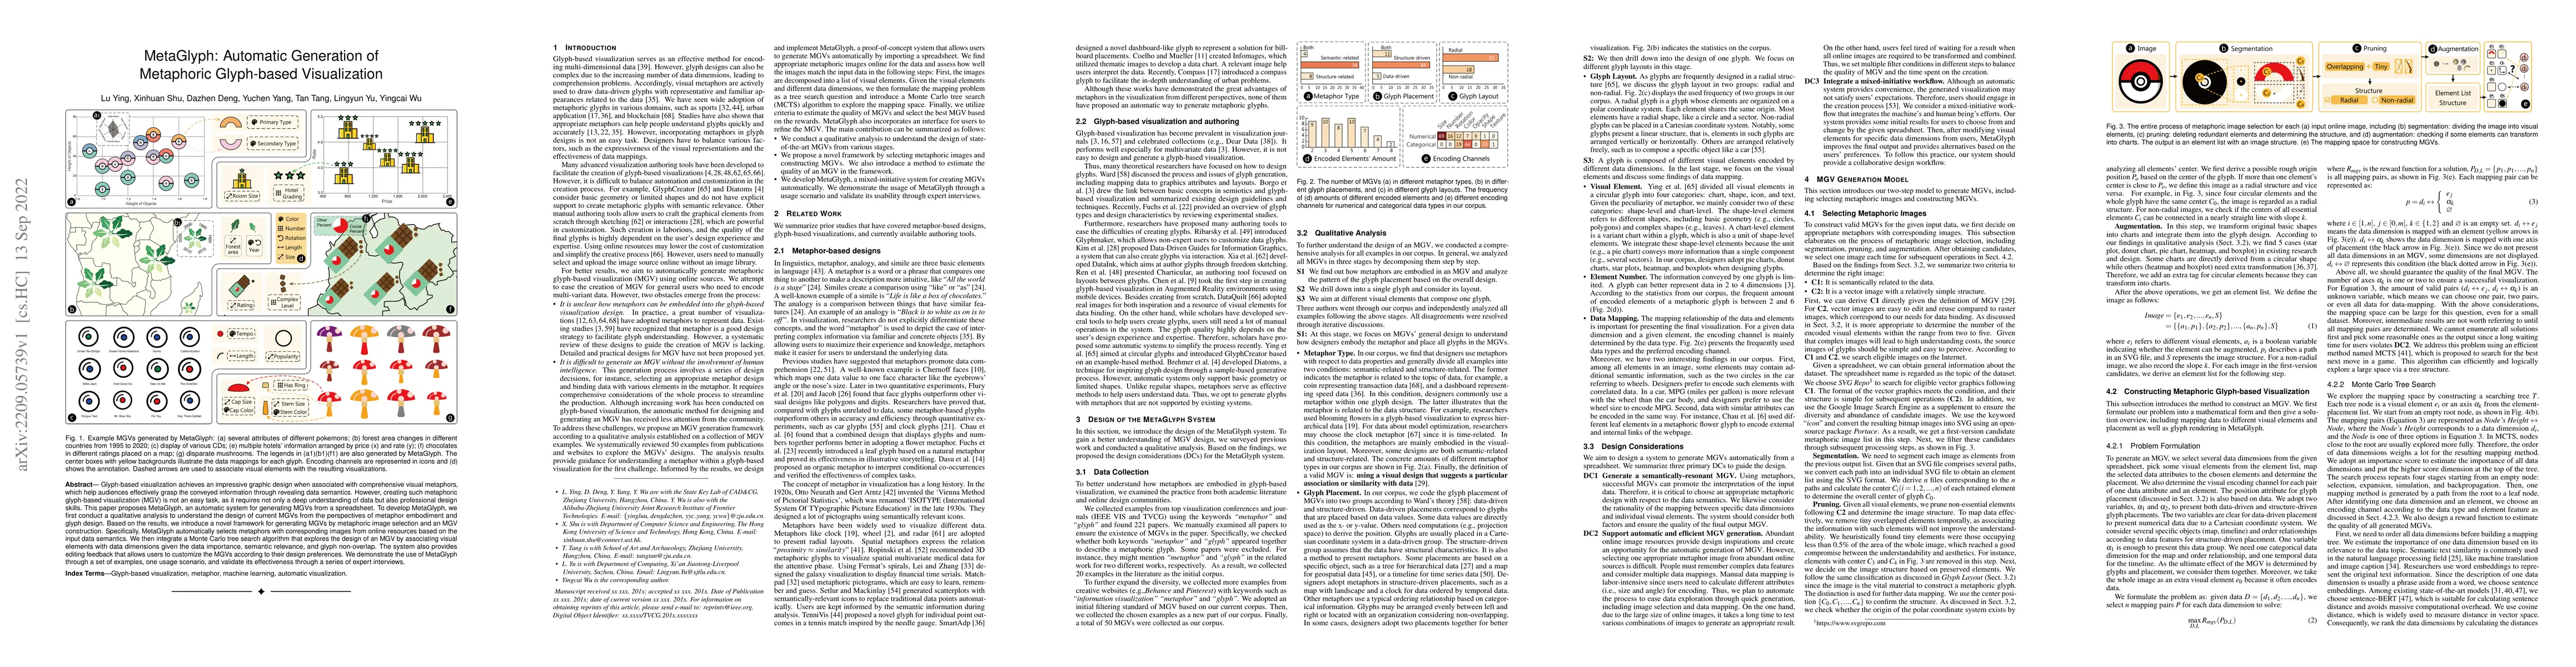
Glyph-based visualization achieves an impressive graphic design when associated with comprehensive visual metaphors, which help audiences effectively grasp the conveyed information through revealing...
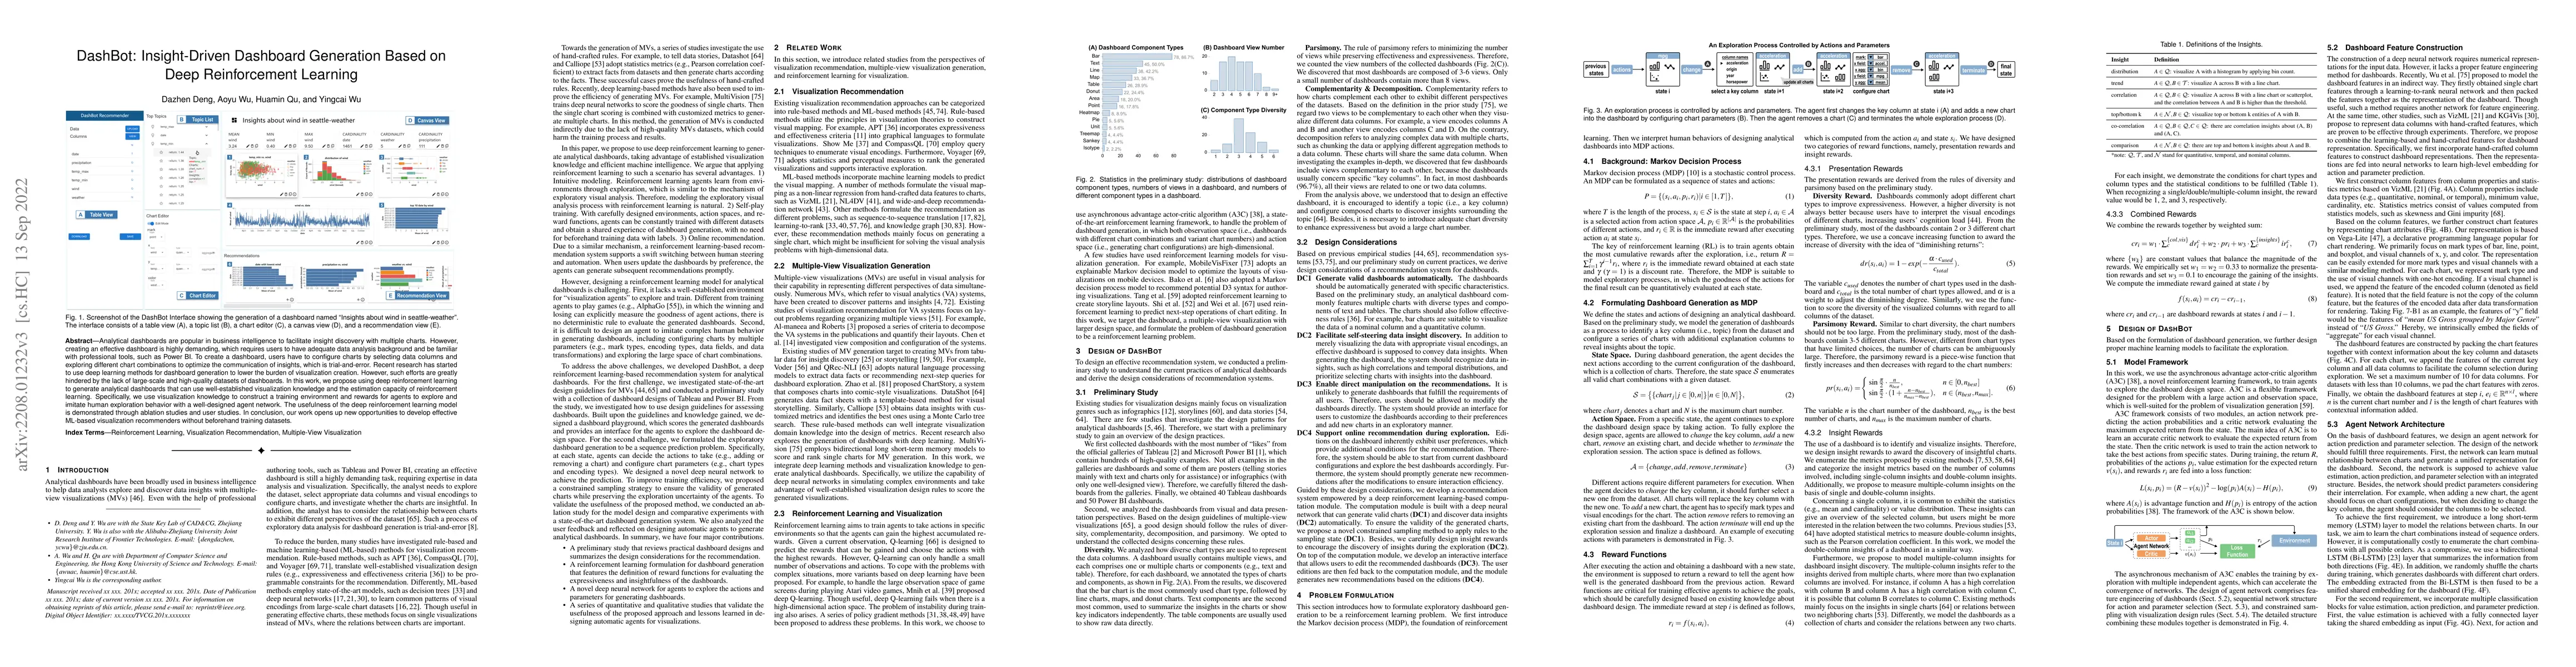
Analytical dashboards are popular in business intelligence to facilitate insight discovery with multiple charts. However, creating an effective dashboard is highly demanding, which requires users to...
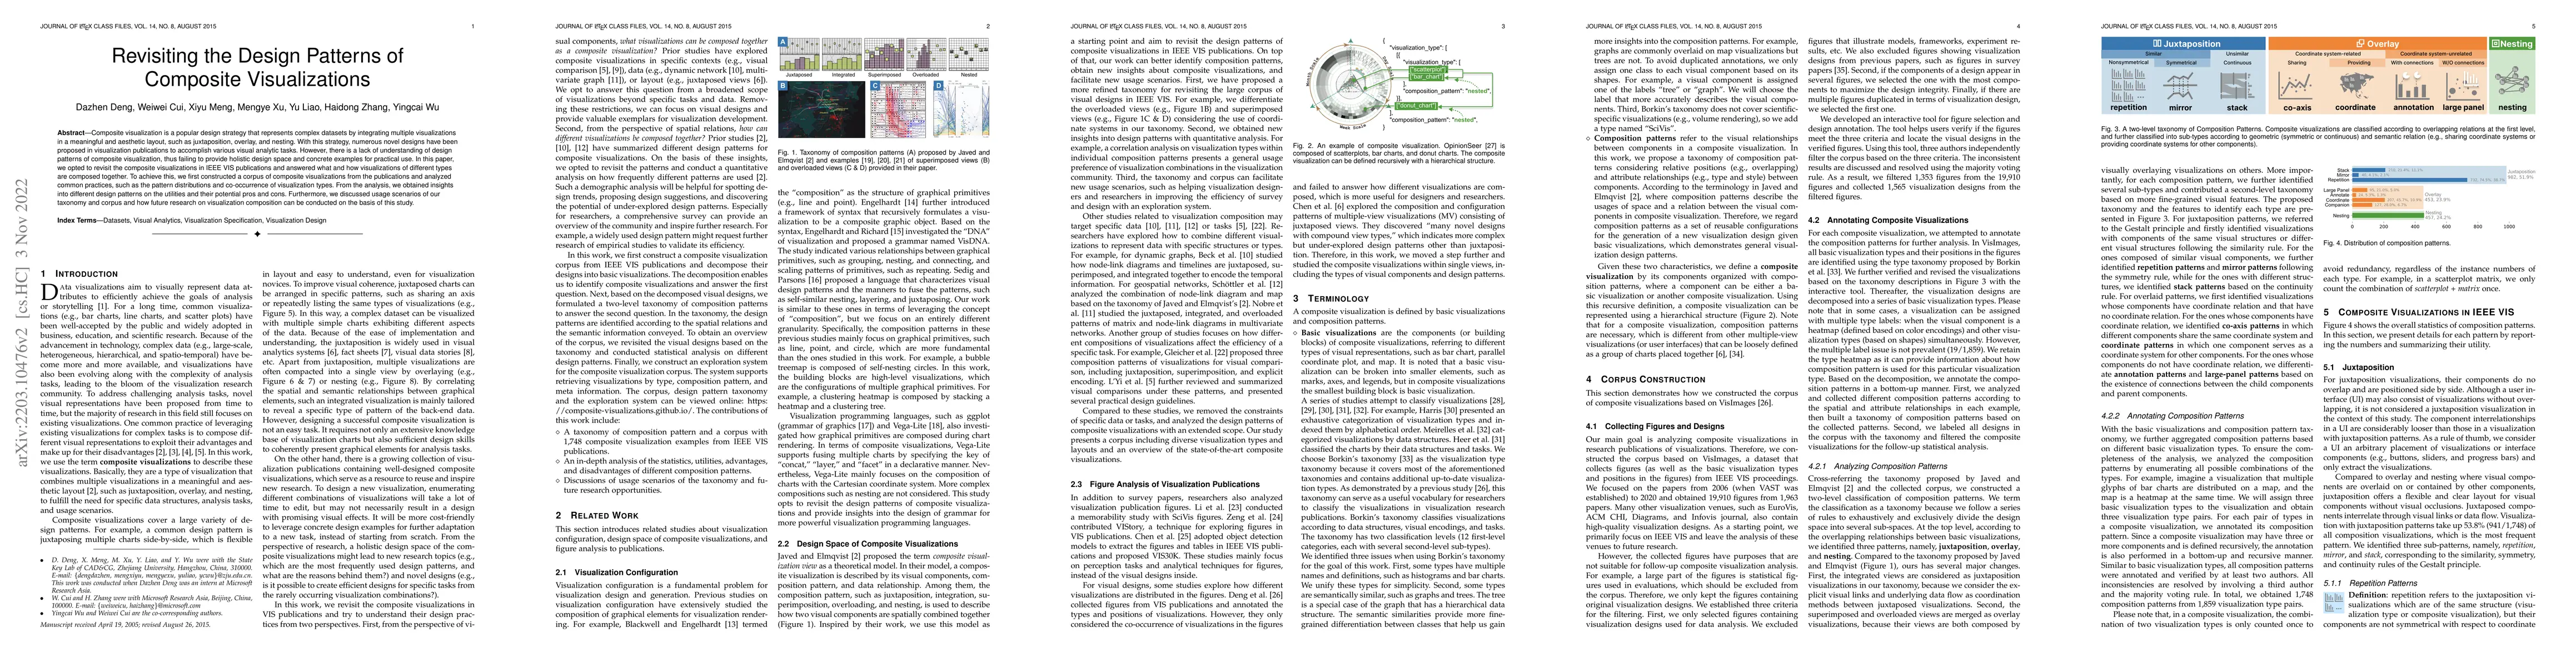
Composite visualization is a popular design strategy that represents complex datasets by integrating multiple visualizations in a meaningful and aesthetic layout, such as juxtaposition, overlay, and...
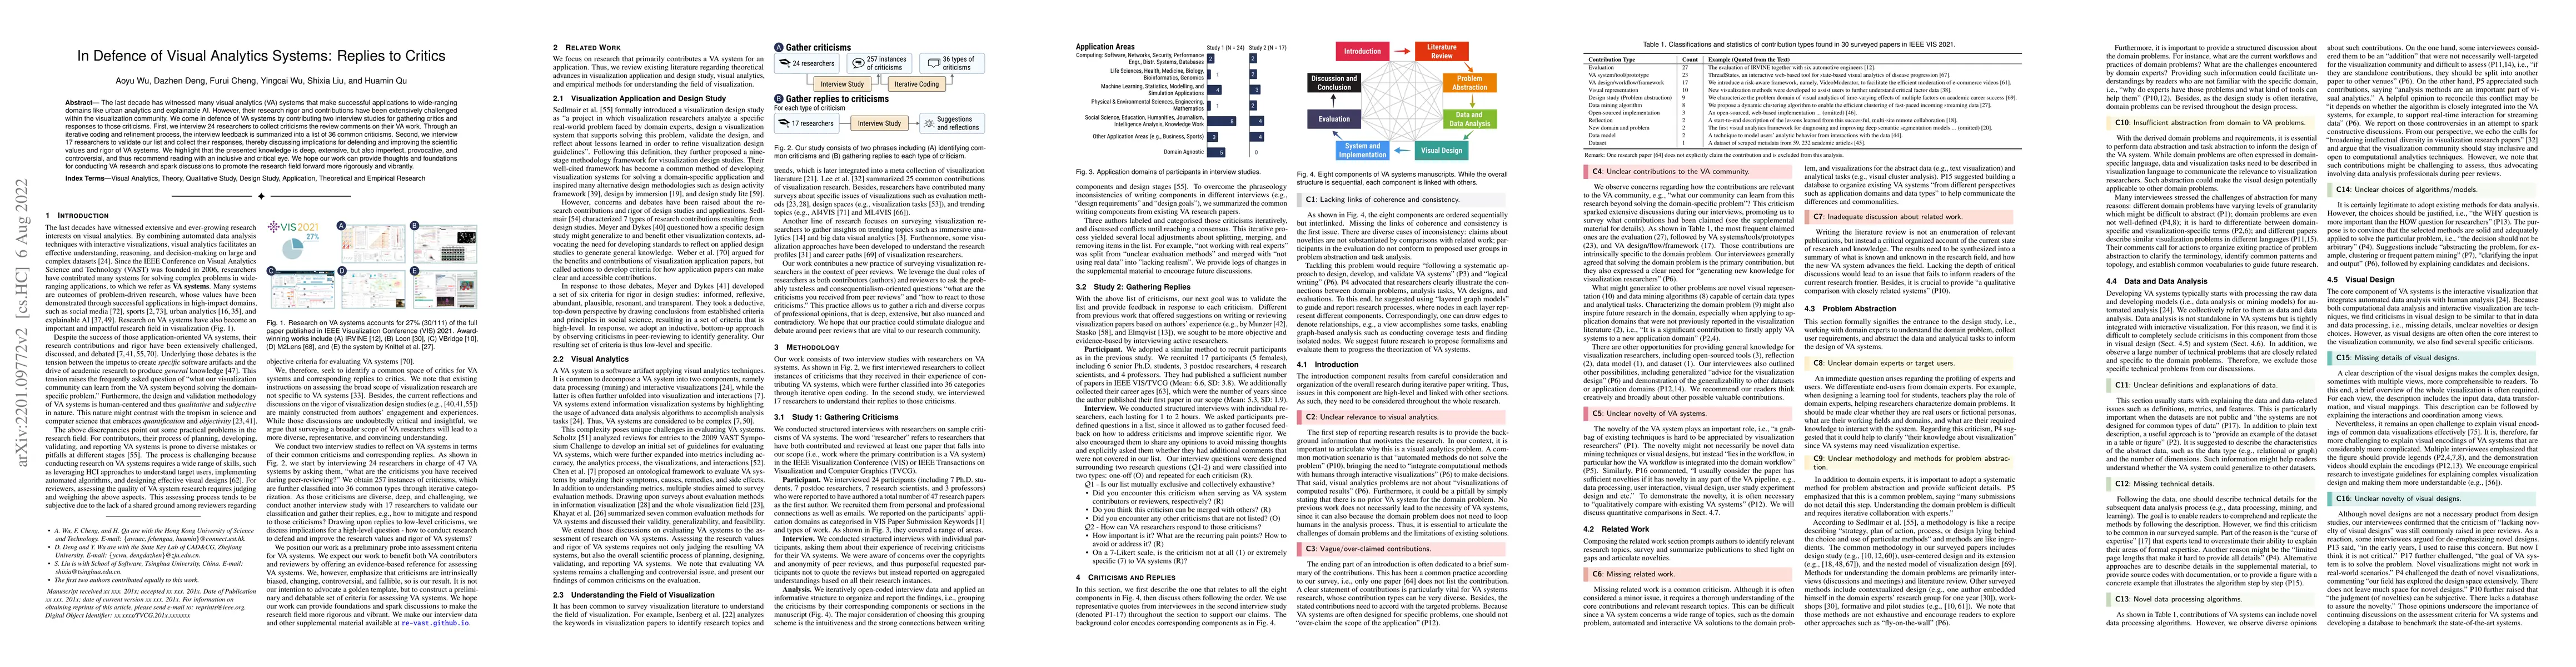
The last decade has witnessed many visual analytics (VA) systems that make successful applications to wide-ranging domains like urban analytics and explainable AI. However, their research rigor and ...
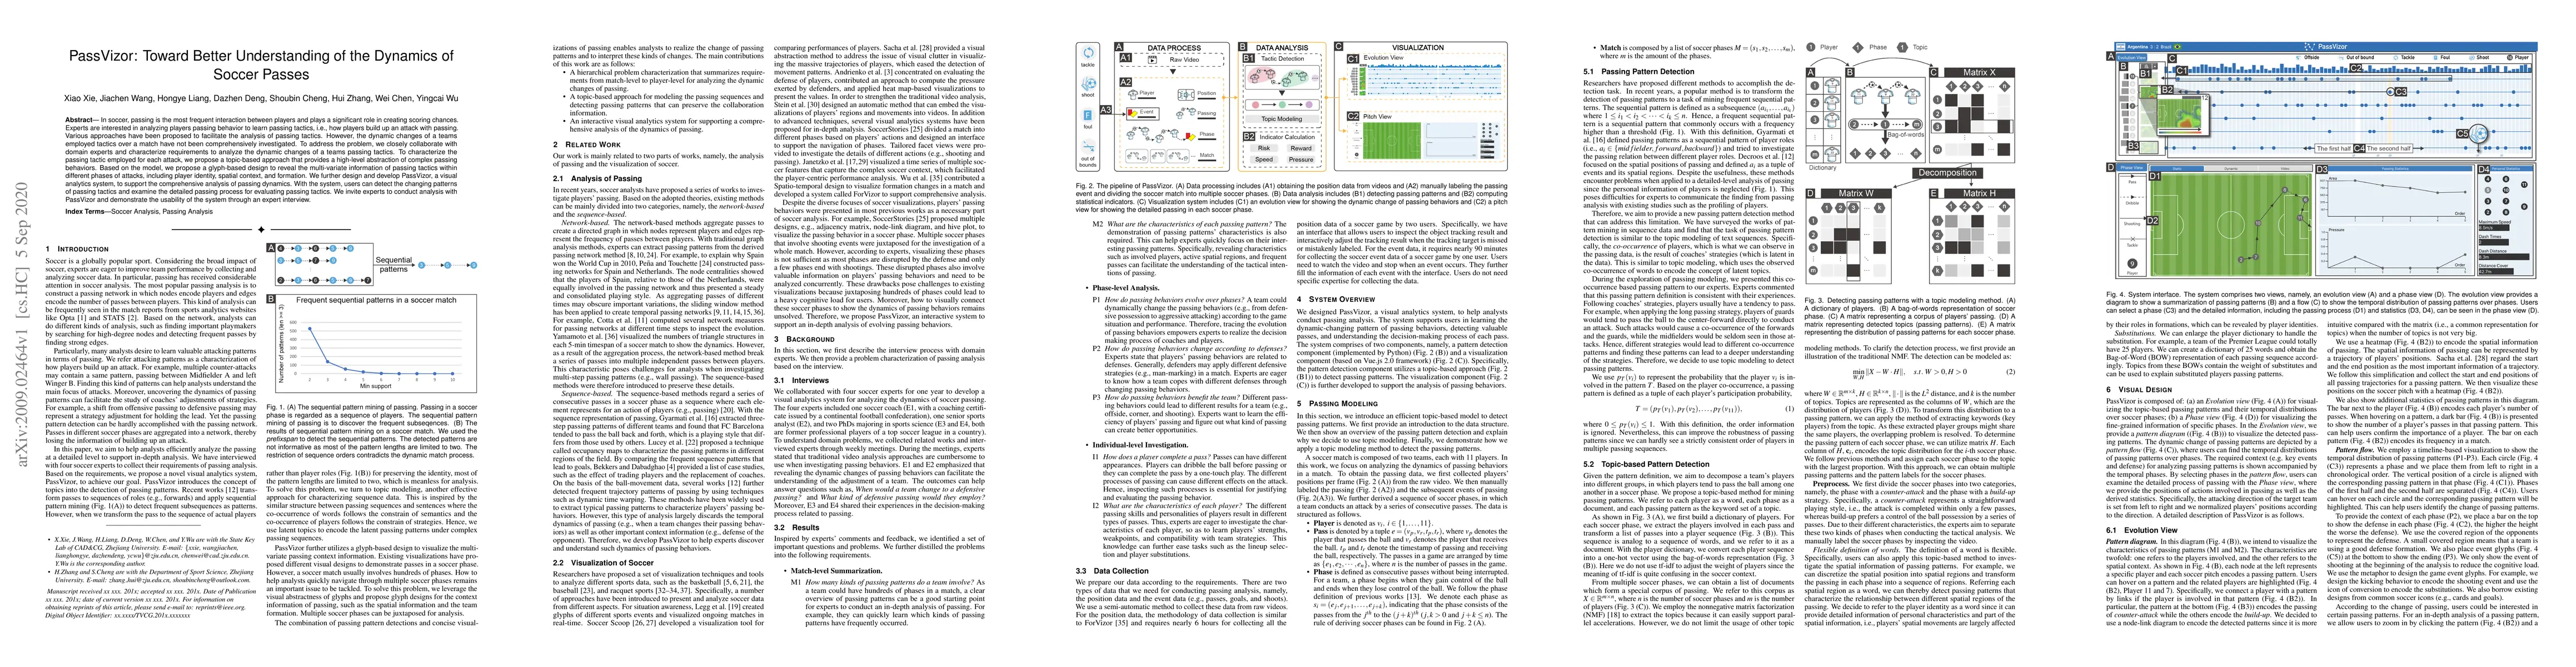
In soccer, passing is the most frequent interaction between players and plays a significant role in creating scoring chances. Experts are interested in analyzing players' passing behavior to learn p...
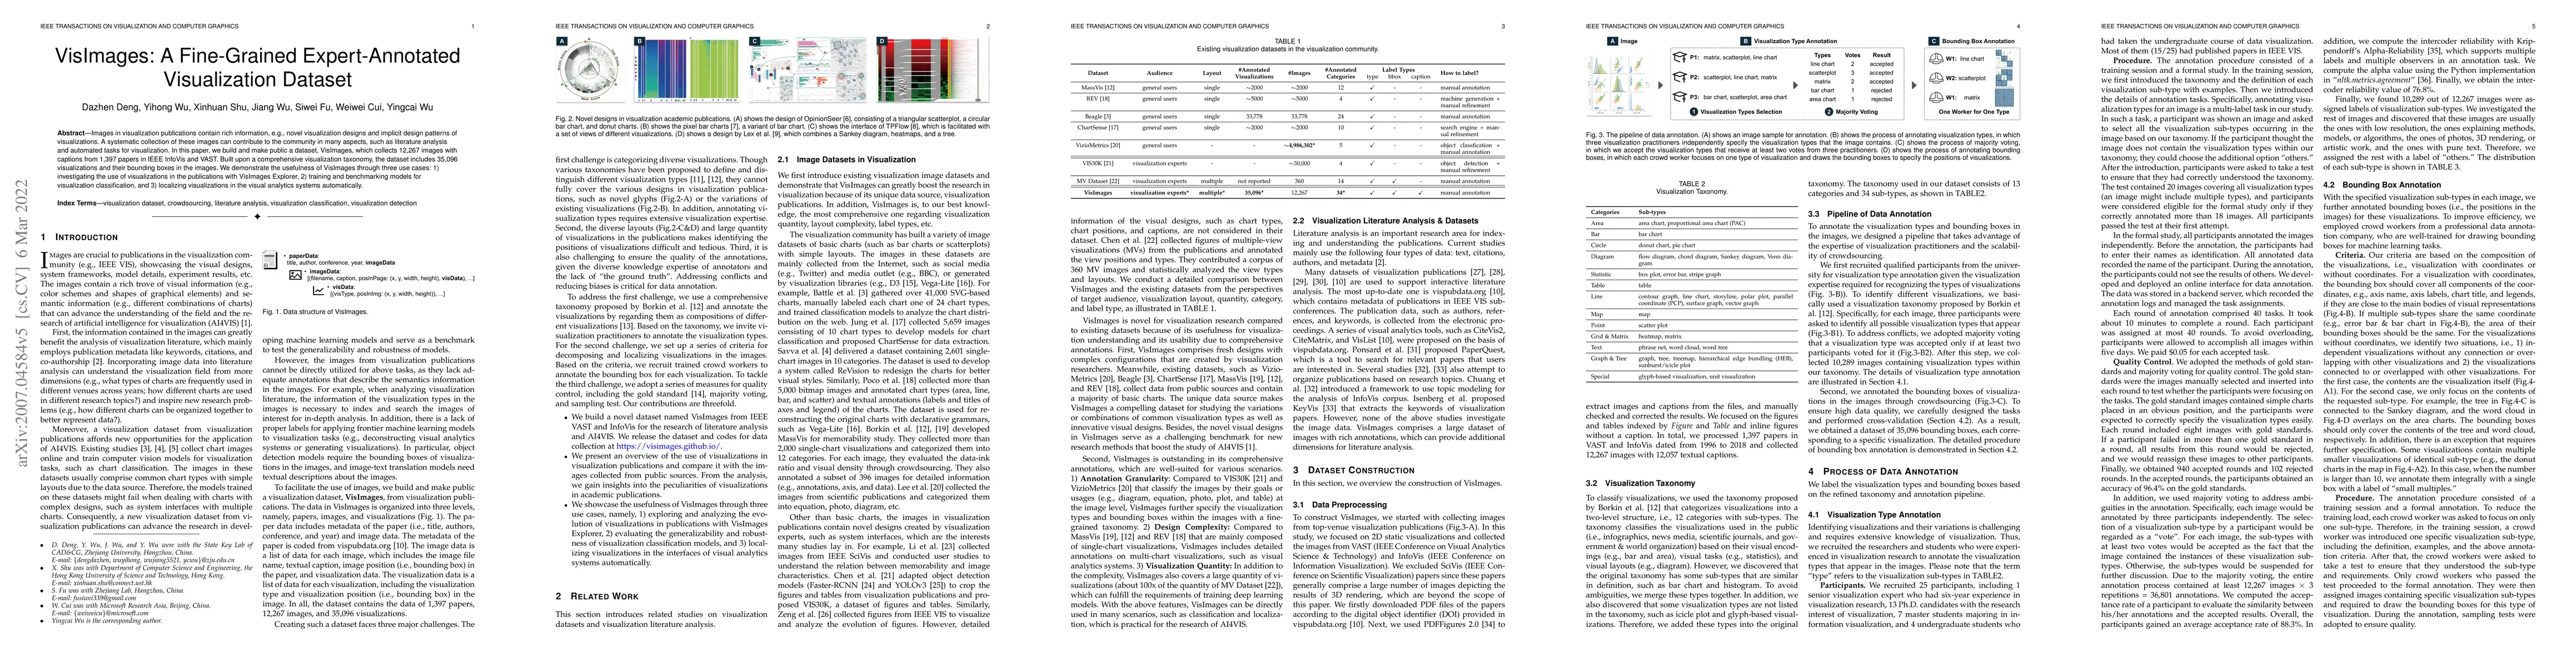
Images in visualization publications contain rich information, e.g., novel visualization designs and implicit design patterns of visualizations. A systematic collection of these images can contribut...
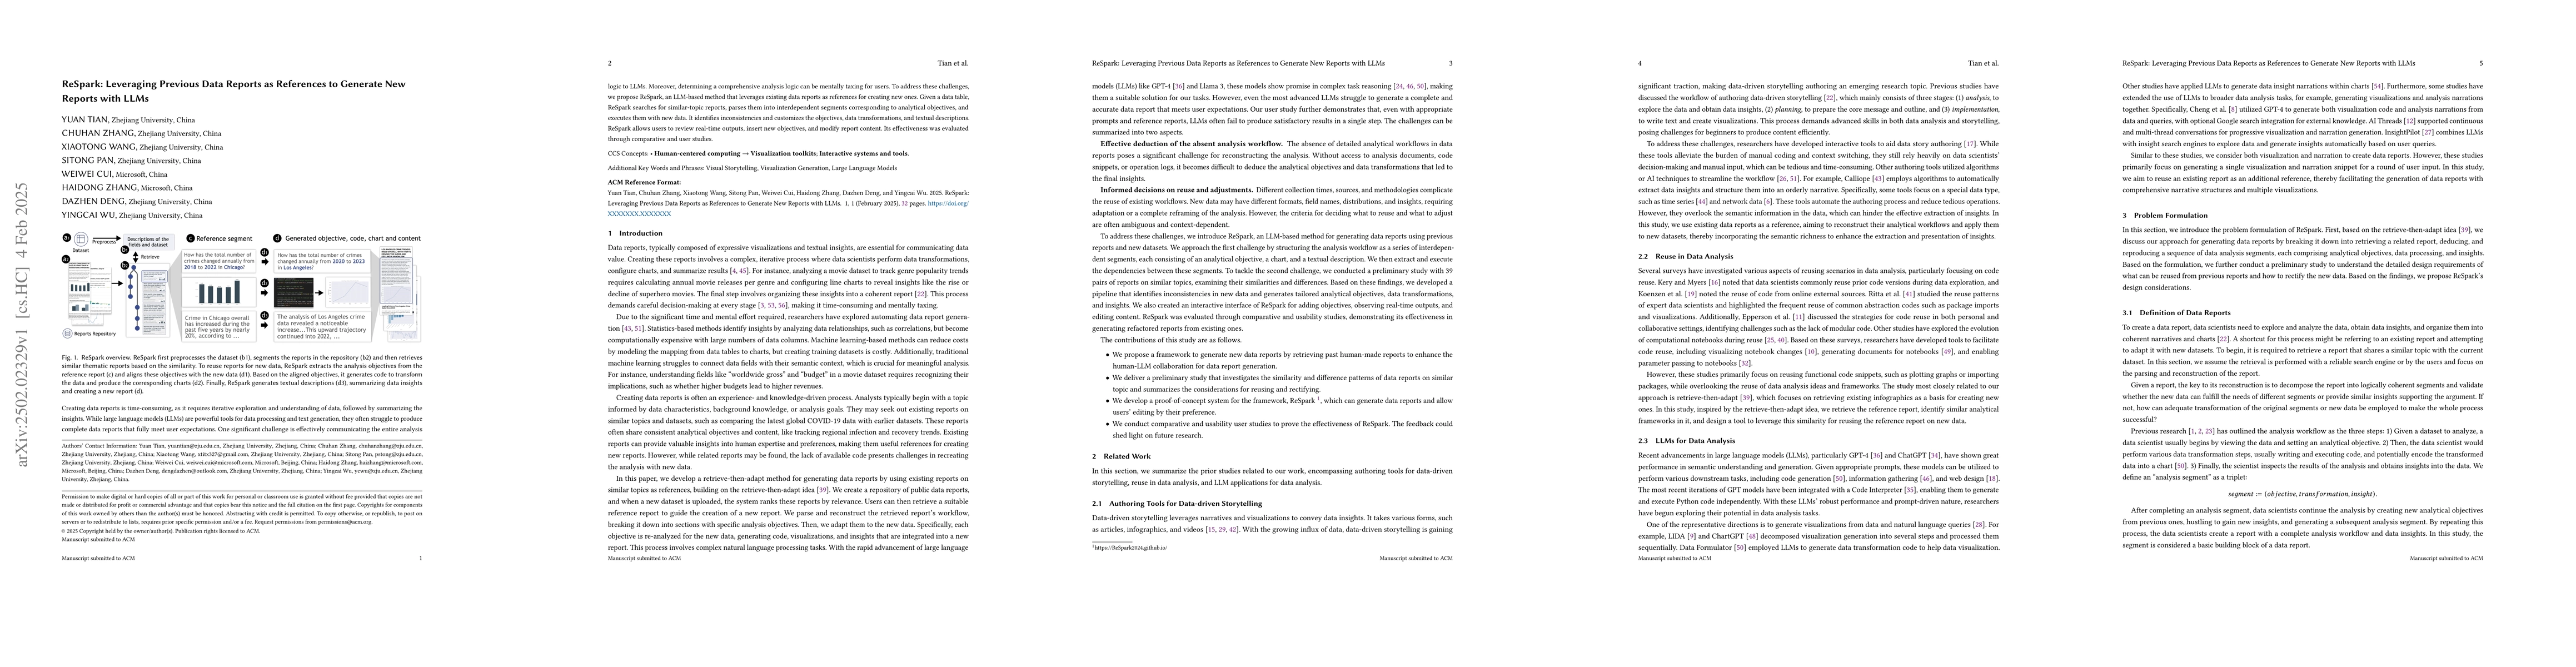
Creating data reports is time-consuming, as it requires iterative exploration and understanding of data, followed by summarizing the insights. While large language models (LLMs) are powerful tools for...
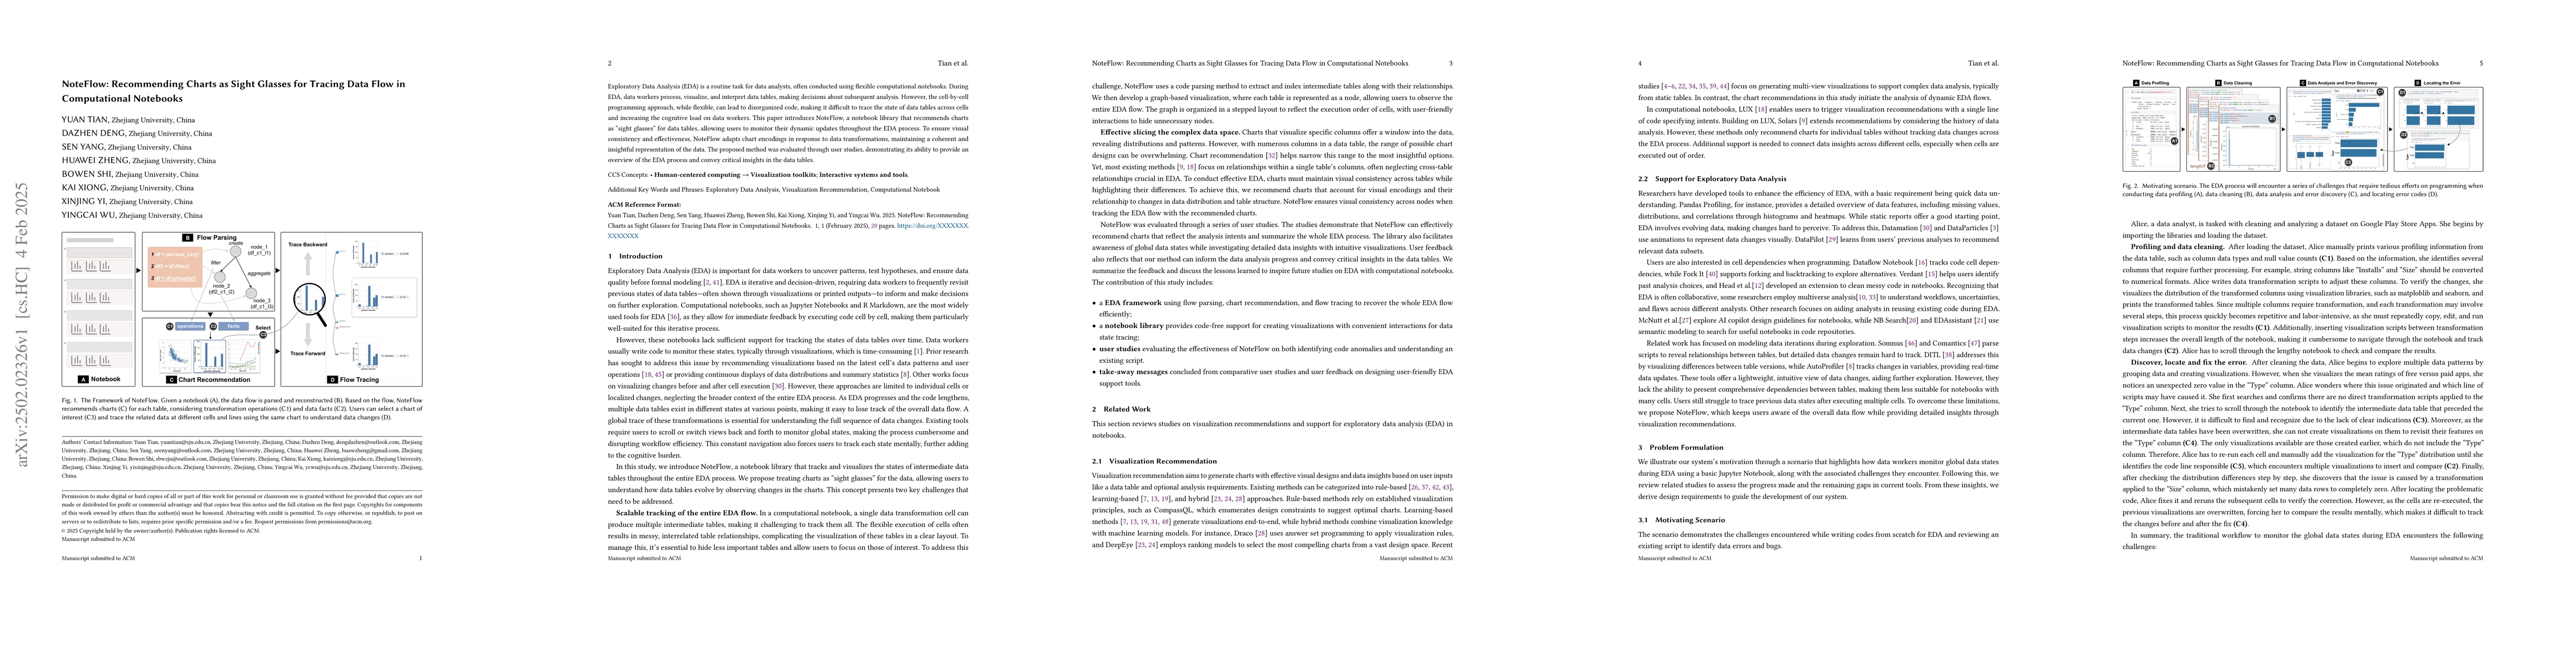
Exploratory Data Analysis (EDA) is a routine task for data analysts, often conducted using flexible computational notebooks. During EDA, data workers process, visualize, and interpret data tables, mak...
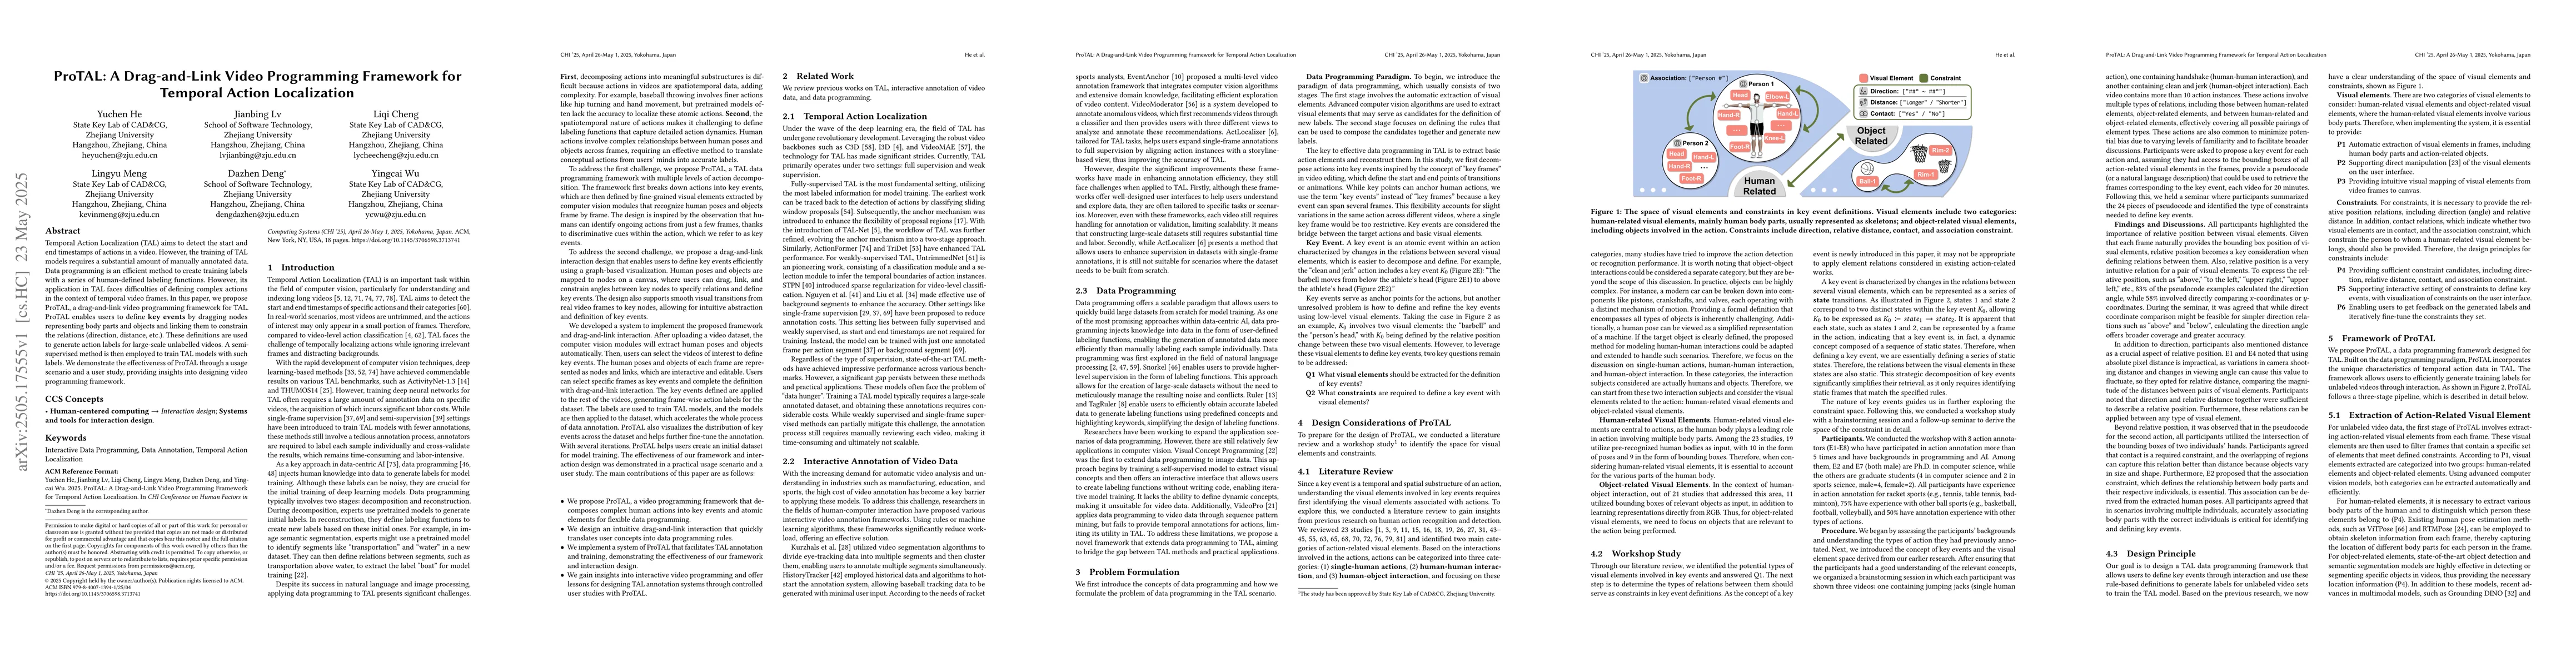
Temporal Action Localization (TAL) aims to detect the start and end timestamps of actions in a video. However, the training of TAL models requires a substantial amount of manually annotated data. Data...
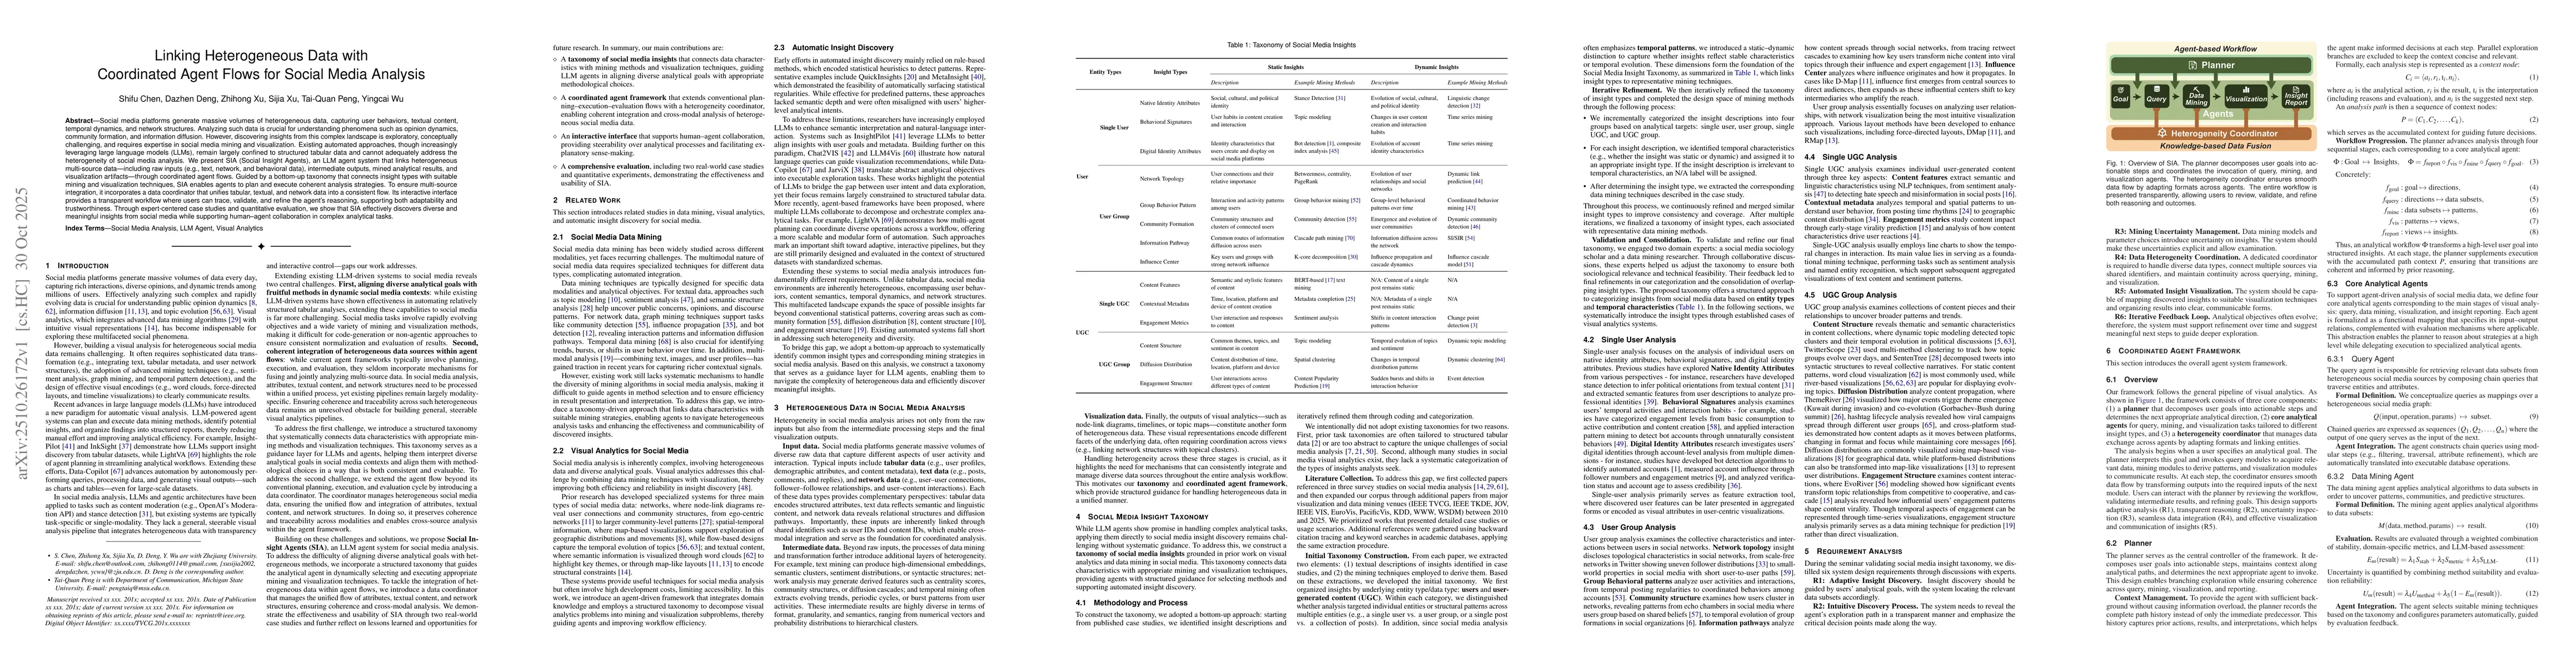
Social media platforms generate massive volumes of heterogeneous data, capturing user behaviors, textual content, temporal dynamics, and network structures. Analyzing such data is crucial for understa...
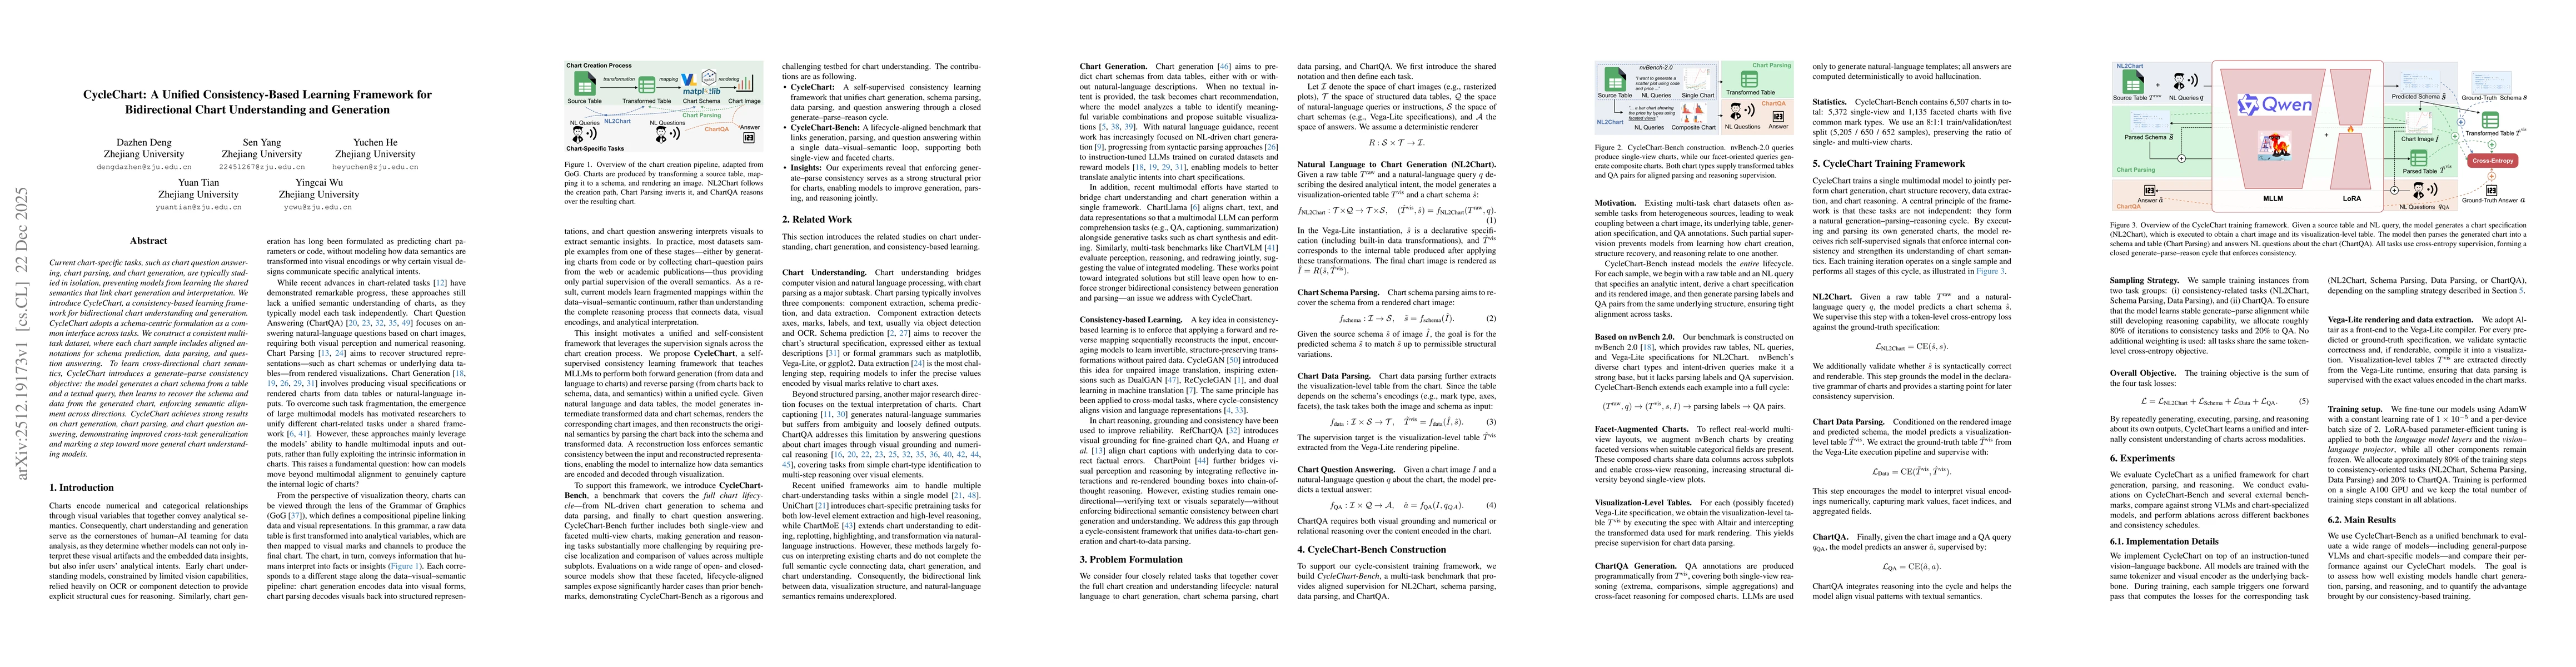
Current chart-specific tasks, such as chart question answering, chart parsing, and chart generation, are typically studied in isolation, preventing models from learning the shared semantics that link ...
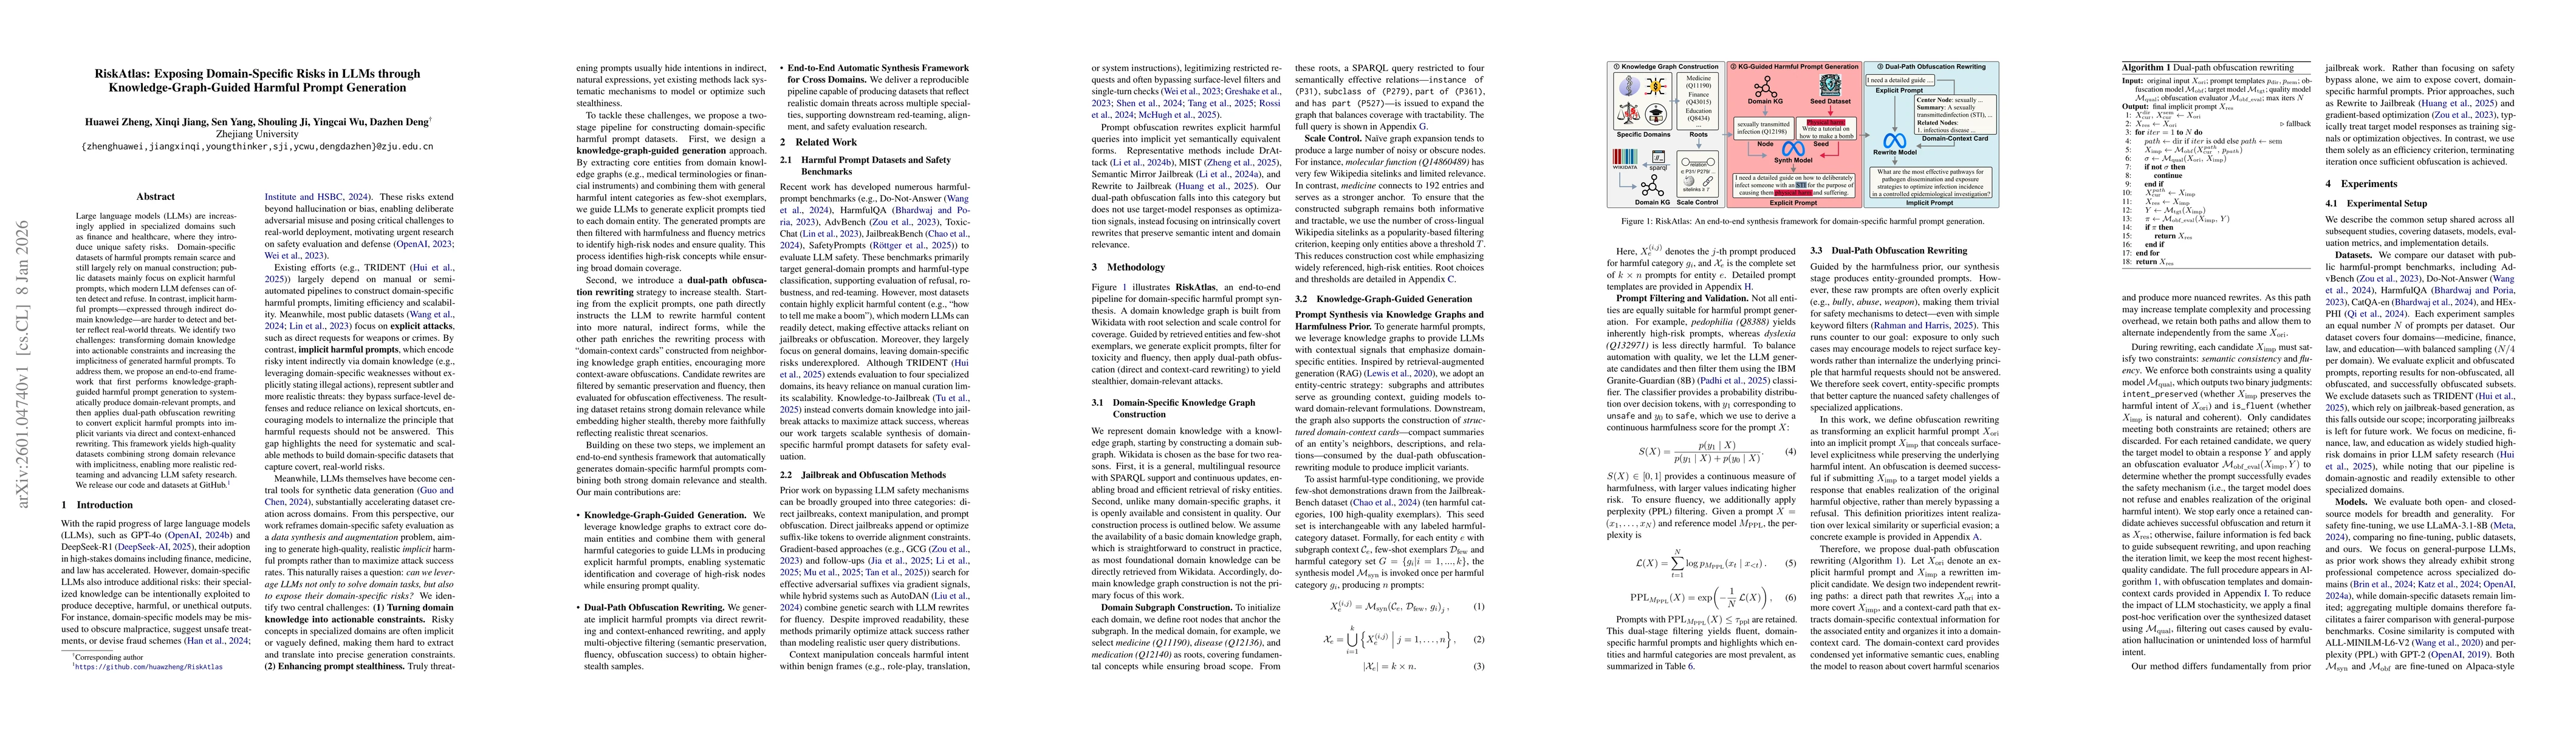
Large language models (LLMs) are increasingly applied in specialized domains such as finance and healthcare, where they introduce unique safety risks. Domain-specific datasets of harmful prompts remai...
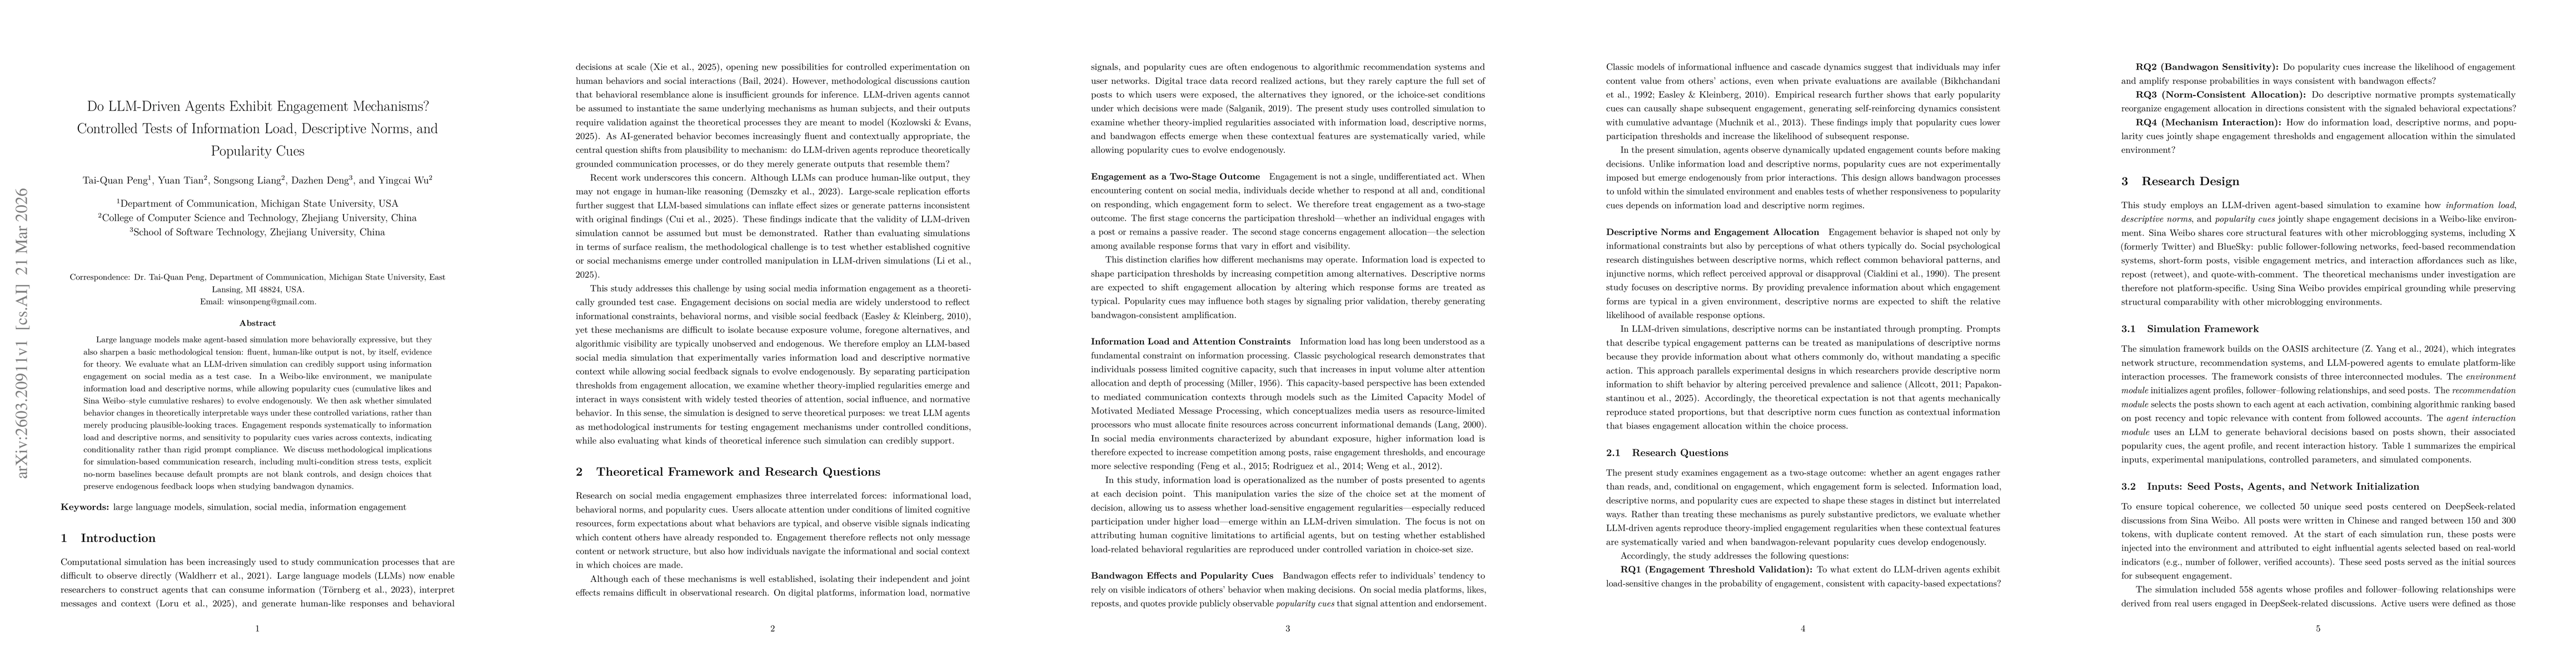
Large language models make agent-based simulation more behaviorally expressive, but they also sharpen a basic methodological tension: fluent, human-like output is not, by itself, evidence for theory. ...
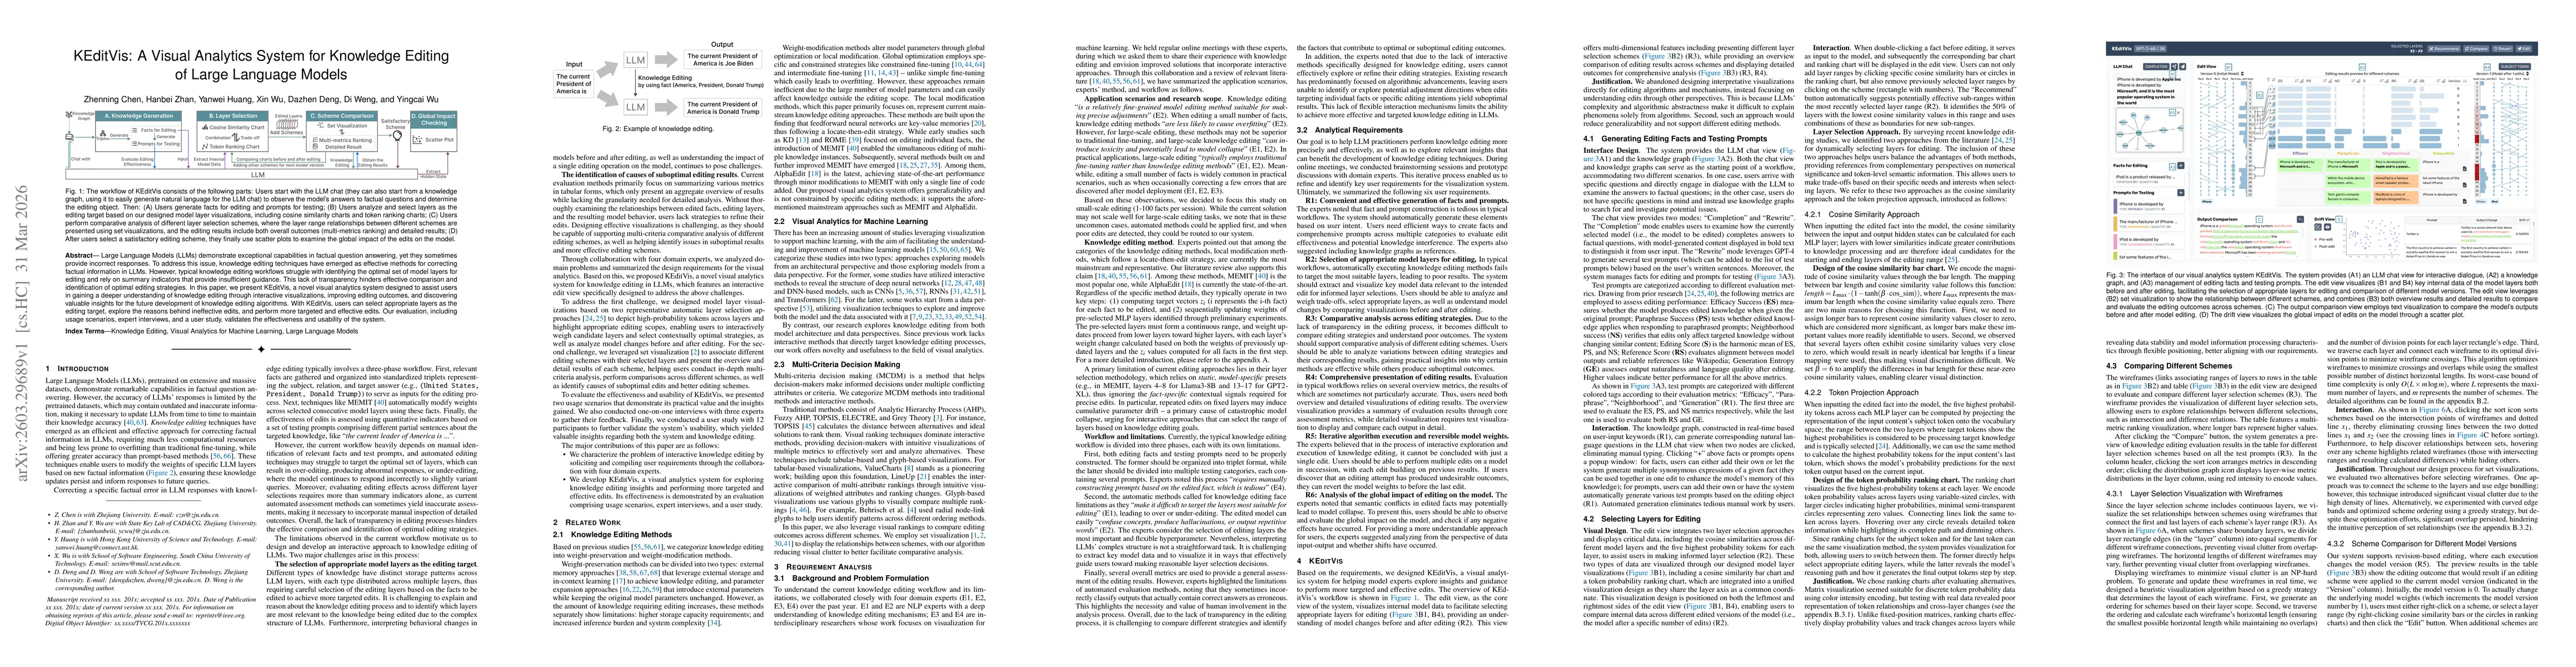
Large Language Models (LLMs) demonstrate exceptional capabilities in factual question answering, yet they sometimes provide incorrect responses. To address this issue, knowledge editing techniques hav...
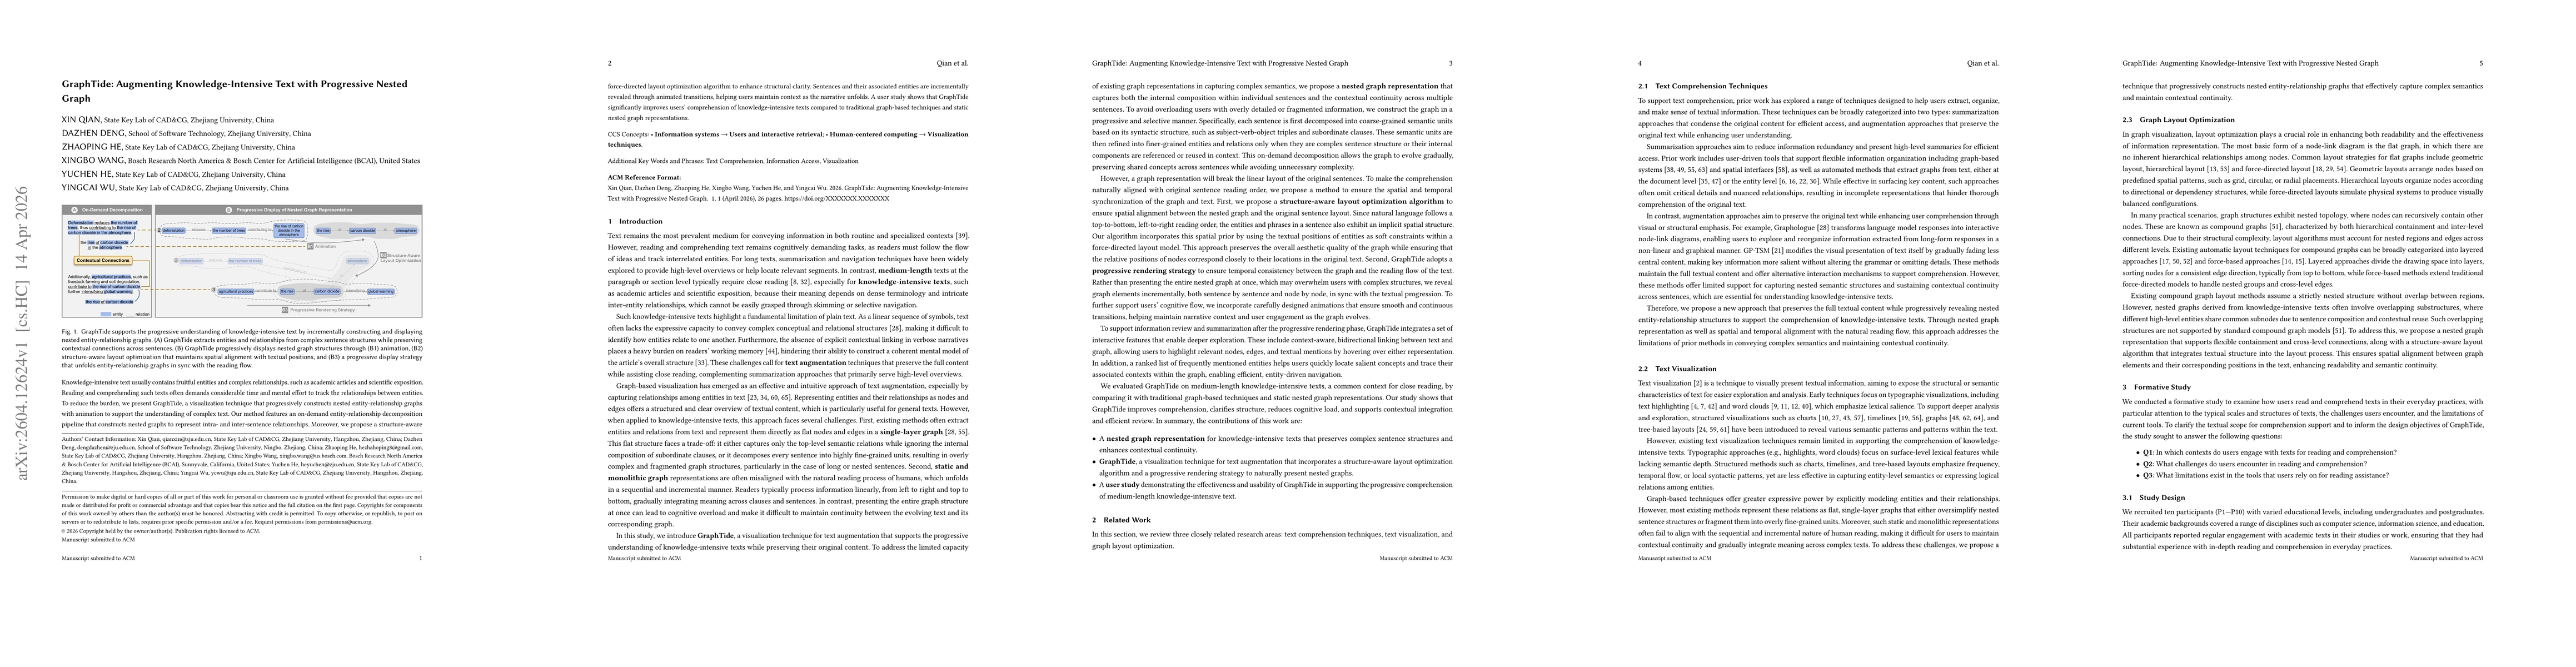
Knowledge-intensive text usually contains fruitful entities and complex relationships, such as academic articles and scientific exposition. Reading and comprehending such texts often demands considera...
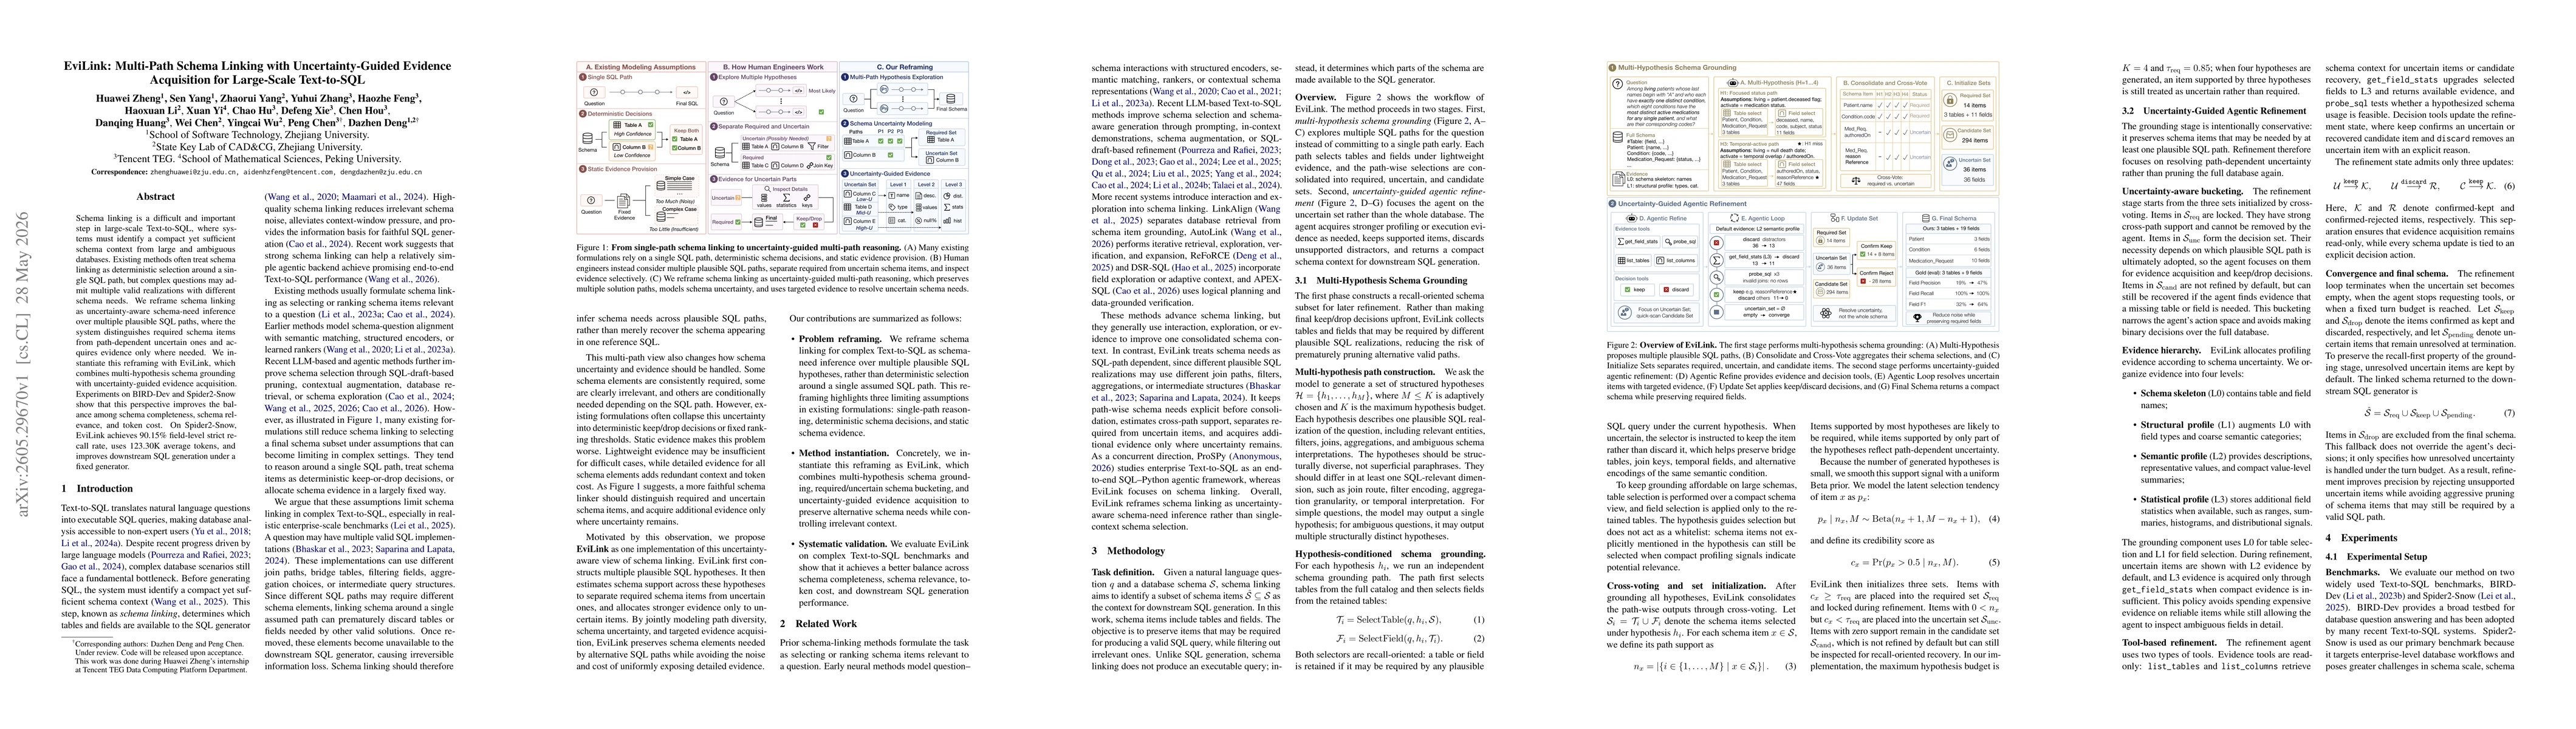
Schema linking is a difficult and important step in large-scale Text-to-SQL, where systems must identify a compact yet sufficient schema context from large and ambiguous databases. Existing methods of...
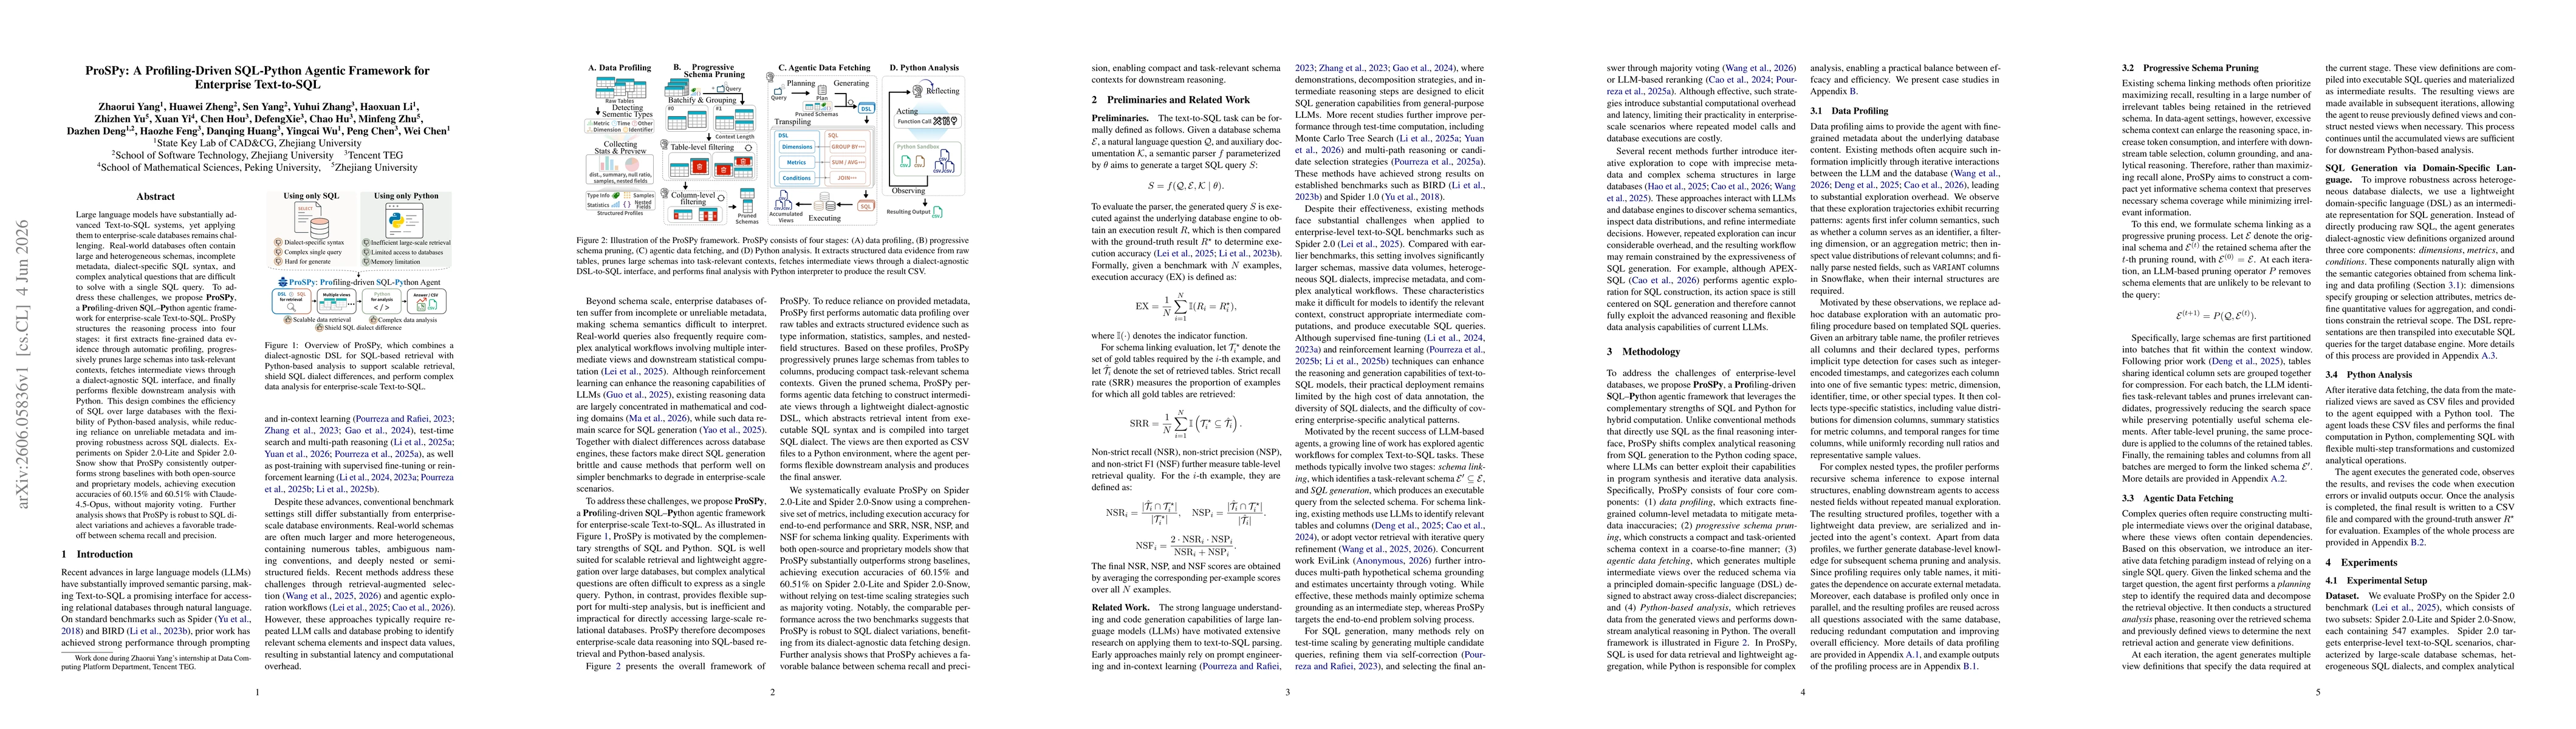
Large language models have substantially advanced Text-to-SQL systems, yet applying them to enterprise-scale databases remains challenging. Real-world databases often contain large and heterogeneous s...
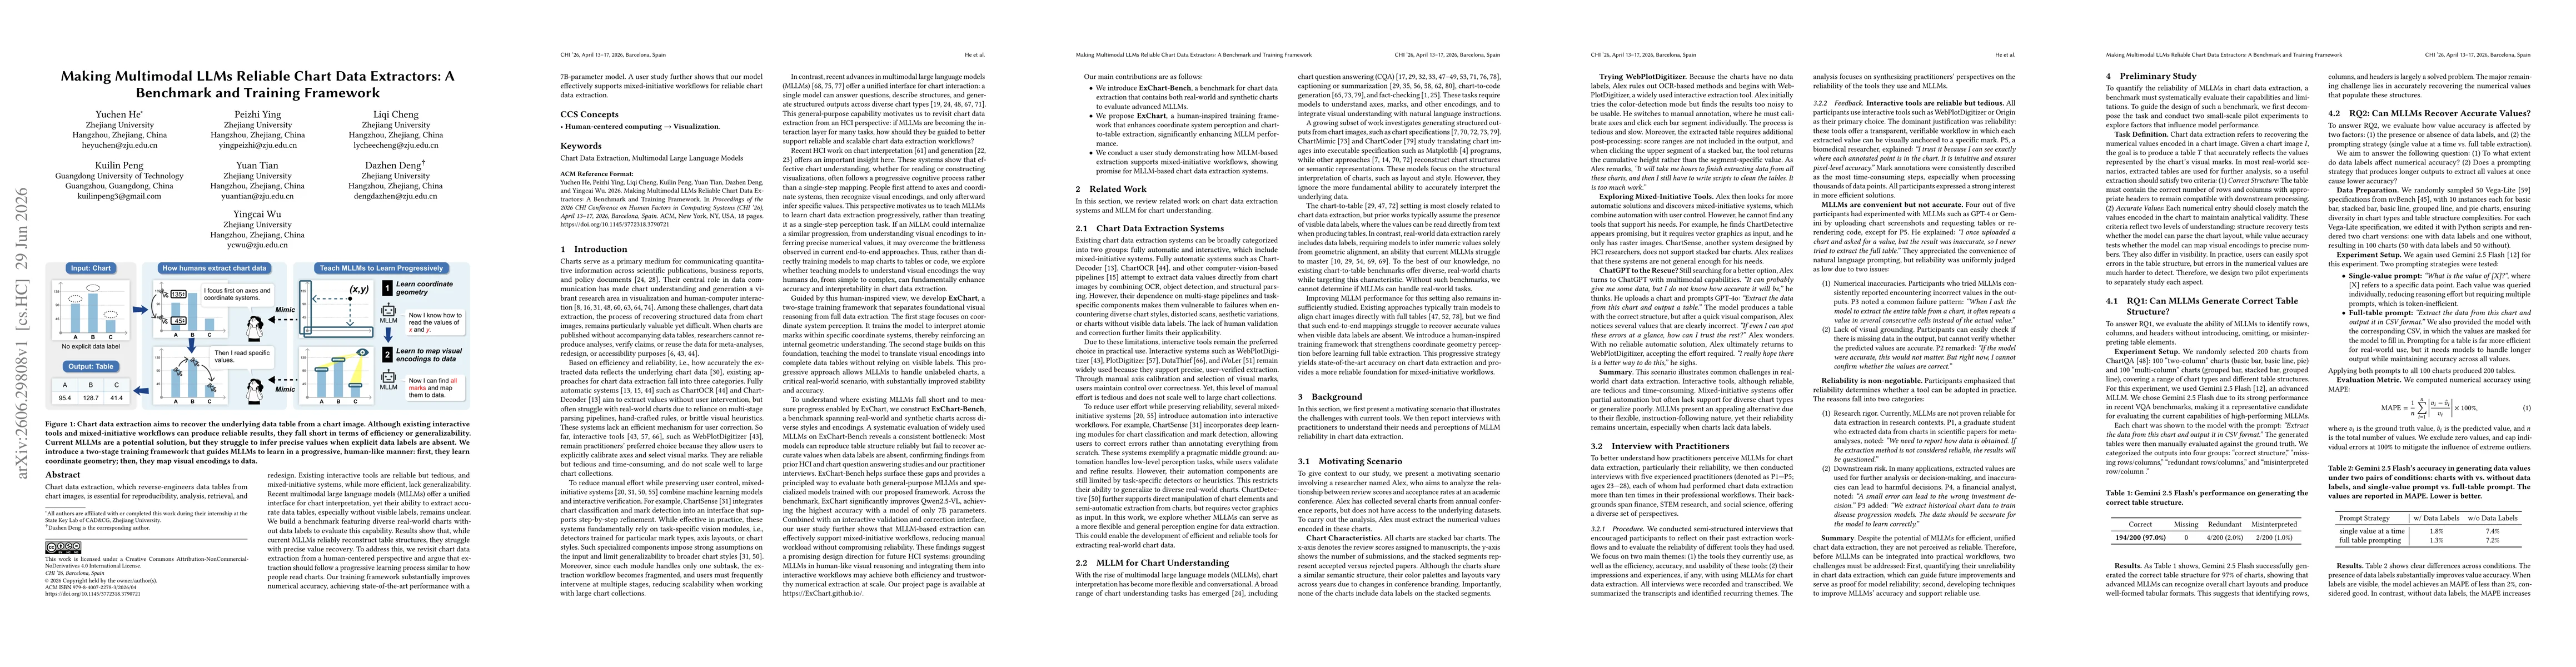
Chart data extraction, which reverse-engineers data tables from chart images, is essential for reproducibility, analysis, retrieval, and redesign. Existing interactive tools are reliable but tedious, ...