Quick Summary:

This paper revisits composite visualizations from IEEE VIS publications to identify and categorize design patterns, proposing a taxonomy of eight patterns based on spatial and semantic relationships. It also develops an interactive system to explore these patterns and insights for visualization designers.

Summary

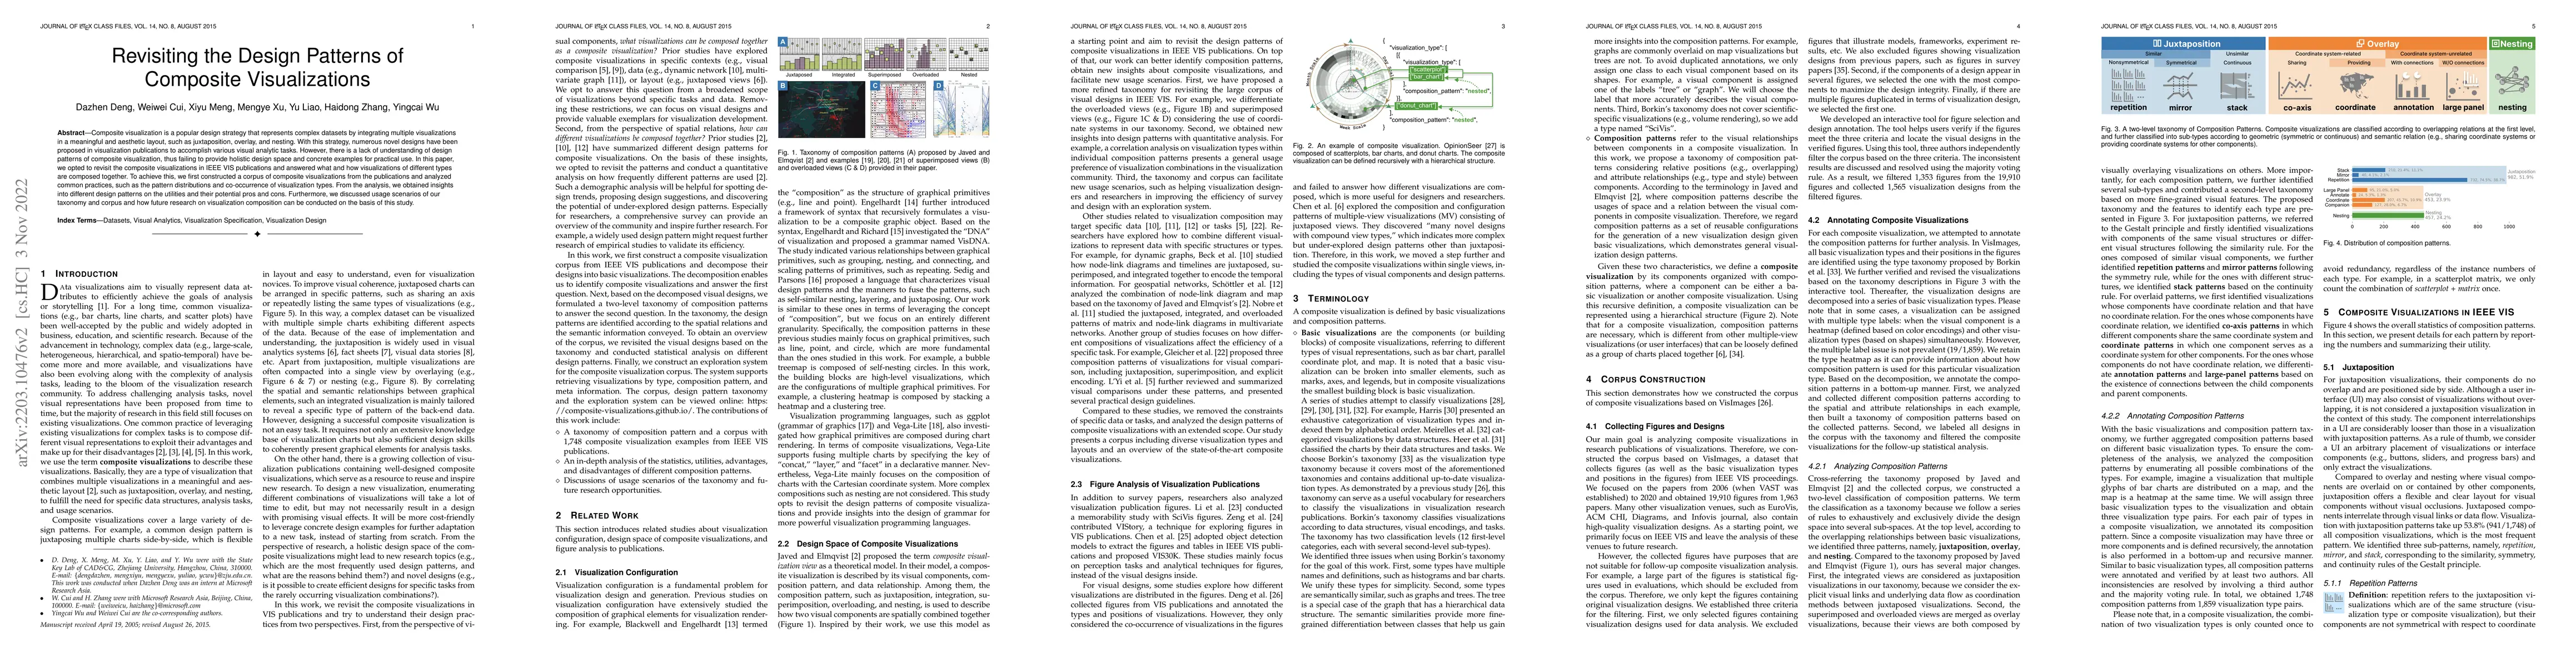
Composite visualization is a popular design strategy that represents complex datasets by integrating multiple visualizations in a meaningful and aesthetic layout, such as juxtaposition, overlay, and nesting. With this strategy, numerous novel designs have been proposed in visualization publications to accomplish various visual analytic tasks. These well-crafted composite visualizations have formed a valuable collection for designers and researchers to address real-world problems and inspire new research topics and designs. However, there is a lack of understanding of design patterns of composite visualization, thus failing to provide holistic design space and concrete examples for practical use. In this paper, we opted to revisit the composite visualizations in VIS publications and answered what and how visualizations of different types are composed together. To achieve this, we first constructed a corpus of composite visualizations from IEEE VIS publications and decomposed them into a series of basic visualization types (e.g., bar chart, map, and matrix). With this corpus, we studied the spatial (e.g., separated or overlaying) and semantic relationships (e.g., with same types or shared axis) between visualizations and proposed a taxonomy consisting of eight different design patterns (e.g., repeated, stacked, accompanied, and nested). Furthermore, we analyzed and discussed common practices of composite visualizations, such as the distribution of different patterns and correlations between visualization types. From the analysis and examples, we obtained insights into different design patterns on the utilities, advantages, and disadvantages. Finally, we developed an interactive system to help visualization developers and researchers conveniently explore collected examples and design patterns.

AI Key Findings

Get AI-generated insights about this paper's methodology, results, and significance.

Paper Details

PDF Preview

Download PDF

Key Terms

visualization (0.326)
composite (0.294)
composite (0.293)
patterns (0.240)
patterns (0.235)
corpus (0.208)
corpus (0.206)
design (0.199)
design (0.199)
types (0.193)
types (0.189)
designs (0.187)
designs (0.185)
researchers (0.174)
researchers (0.171)
examples (0.161)
examples (0.154)
strategy (0.150)
strategy (0.142)
layout (0.127)

Citation Network

Current paper (gray), citations (green), references (blue)

Current Paper
Citations
References
Click to view
Title Authors Year Actions
AdversaFlow: Visual Red Teaming for Large Language Models with Multi-Level Adversarial Flow
Dazhen Deng, Chuhan Zhang, Huawei Zheng, Yuwen Pu, Shouling Ji, Yingcai Wu
2024
View Paper
CompositingVis: Exploring Interactions for Creating Composite Visualizations in Immersive Environments
Qian Zhu, Tao Lu, Shunan Guo, Xiaojuan Ma, Yalong Yang
2024
View Paper
Advancing Multimodal Large Language Models in Chart Question Answering with Visualization-Referenced Instruction Tuning
Xingchen Zeng, Haichuan Lin, Yilin Ye, Wei Zeng
2024
View Paper
Assessing the landscape of toolkits, frameworks, and authoring tools for urban visual analytics systems
L. Ferreira, Gustavo Moreira, Maryam Hosseini, Marcos Lage, Nivan Ferreira, Fabio Miranda
2024
View Paper
RemixTape: Enriching Narratives about Metrics with Semantic Alignment and Contextual Recommendation
Matthew Brehmer, Margaret Drouhard, Arjun Srinivasan
2024
View Paper
A Survey of Designs for Combined 2D+3D Visual Representations
Jia-Shun Hong, R. Hnatyshyn, Ebrar A. D. Santos, Ross Maciejewski, Tobias Isenberg
2024
View Paper
AR-Enhanced Workouts: Exploring Visual Cues for At-Home Workout Videos in AR Environment
Yihong Wu, Lingyun Yu, Jie Xu, Dazhen Deng, Jiachen Wang, Xiao Xie, Hui Zhang, Yingcai Wu
2023
View Paper
Reviving Static Charts into Live Charts
Lu Ying, Yun Wang, Haotian Li, Shuguang Dou, Haidong Zhang, Xinyang Jiang, Huamin Qu, Yingcai Wu
2023
View Paper
OldVisOnline: Curating a Dataset of Historical Visualizations
Yu Zhang, Ruike Jiang, Liwenhan Xie, Yuheng Zhao, Can Liu, Tianhong Ding, Siming Chen, Xiaoru Yuan
2023
View Paper
Heuristics for Supporting Cooperative Dashboard Design
V. Setlur, M. Correll, Arvind Satyanarayan, Melanie Tory
2023
View Paper
VISAtlas: An Image-Based Exploration and Query System for Large Visualization Collections via Neural Image Embedding
Yilin Ye, Rong Huang, Weizhen Zeng
2022
View Paper
VAID: Indexing View Designs in Visual Analytics System
Lu Ying, Aoyu Wu, Haotian Li, Zikun Deng, Ji Lan, Jiang Wu, Yong Wang, Huamin Qu, Dazhen Deng, Yingcai Wu
2022
View Paper
Multi-View Design Patterns and Responsive Visualization for Genomics Data
S. L’Yi, Nils Gehlenborg
2022
View Paper
DashBot: Insight-Driven Dashboard Generation Based on Deep Reinforcement Learning
Dazhen Deng, Aoyu Wu, Huamin Qu, Yingcai Wu
2022
View Paper

Comments (0)

This website uses cookies to ensure you get the best experience. Learn more