Feature-Action Design Patterns for Storytelling Visualizations with Time Series Data
Publication
Metrics
AI Quick Summary
This paper introduces a method for creating dynamic storytelling visualizations for time series data, focusing on feature-action design patterns to accommodate data-driven narratives. It aims to enable personalized, context-specific storytelling for evolving datasets, exemplified through COVID-19 data and machine learning workflows.
Paper Preview
Abstract
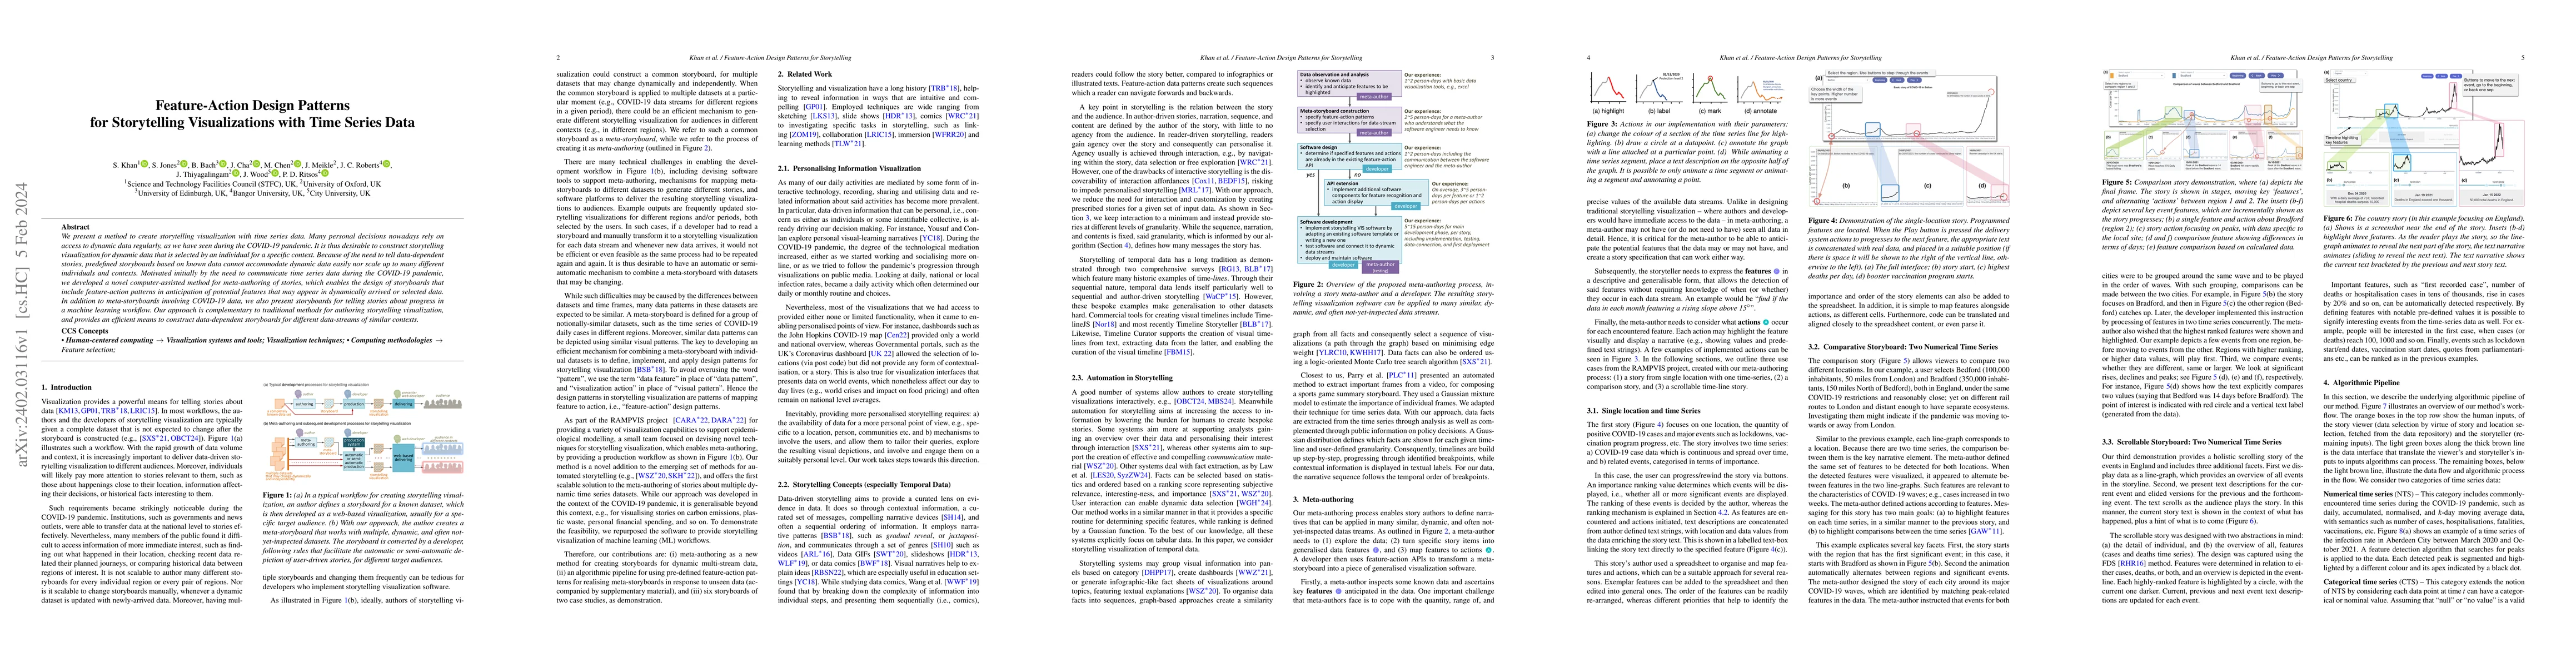
We present a method to create storytelling visualization with time series data. Many personal decisions nowadays rely on access to dynamic data regularly, as we have seen during the COVID-19 pandemic. It is thus desirable to construct storytelling visualization for dynamic data that is selected by an individual for a specific context. Because of the need to tell data-dependent stories, predefined storyboards based on known data cannot accommodate dynamic data easily nor scale up to many different individuals and contexts. Motivated initially by the need to communicate time series data during the COVID-19 pandemic, we developed a novel computer-assisted method for meta-authoring of stories, which enables the design of storyboards that include feature-action patterns in anticipation of potential features that may appear in dynamically arrived or selected data. In addition to meta-storyboards involving COVID-19 data, we also present storyboards for telling stories about progress in a machine learning workflow. Our approach is complementary to traditional methods for authoring storytelling visualization, and provides an efficient means to construct data-dependent storyboards for different data-streams of similar contexts.
AI Key Findings
Get AI-generated insights about this paper's methodology, results, significance, and more — seven facets brought into focus.
Impact
Paper Details
Authors
PDF Preview
Key Terms
Citation Network
Current paper (gray), citations (green), references (blue)
Display is limited for performance on very large graphs.
Discussion 0