Academic Profile
Statistics
Similar Authors
Papers on arXiv
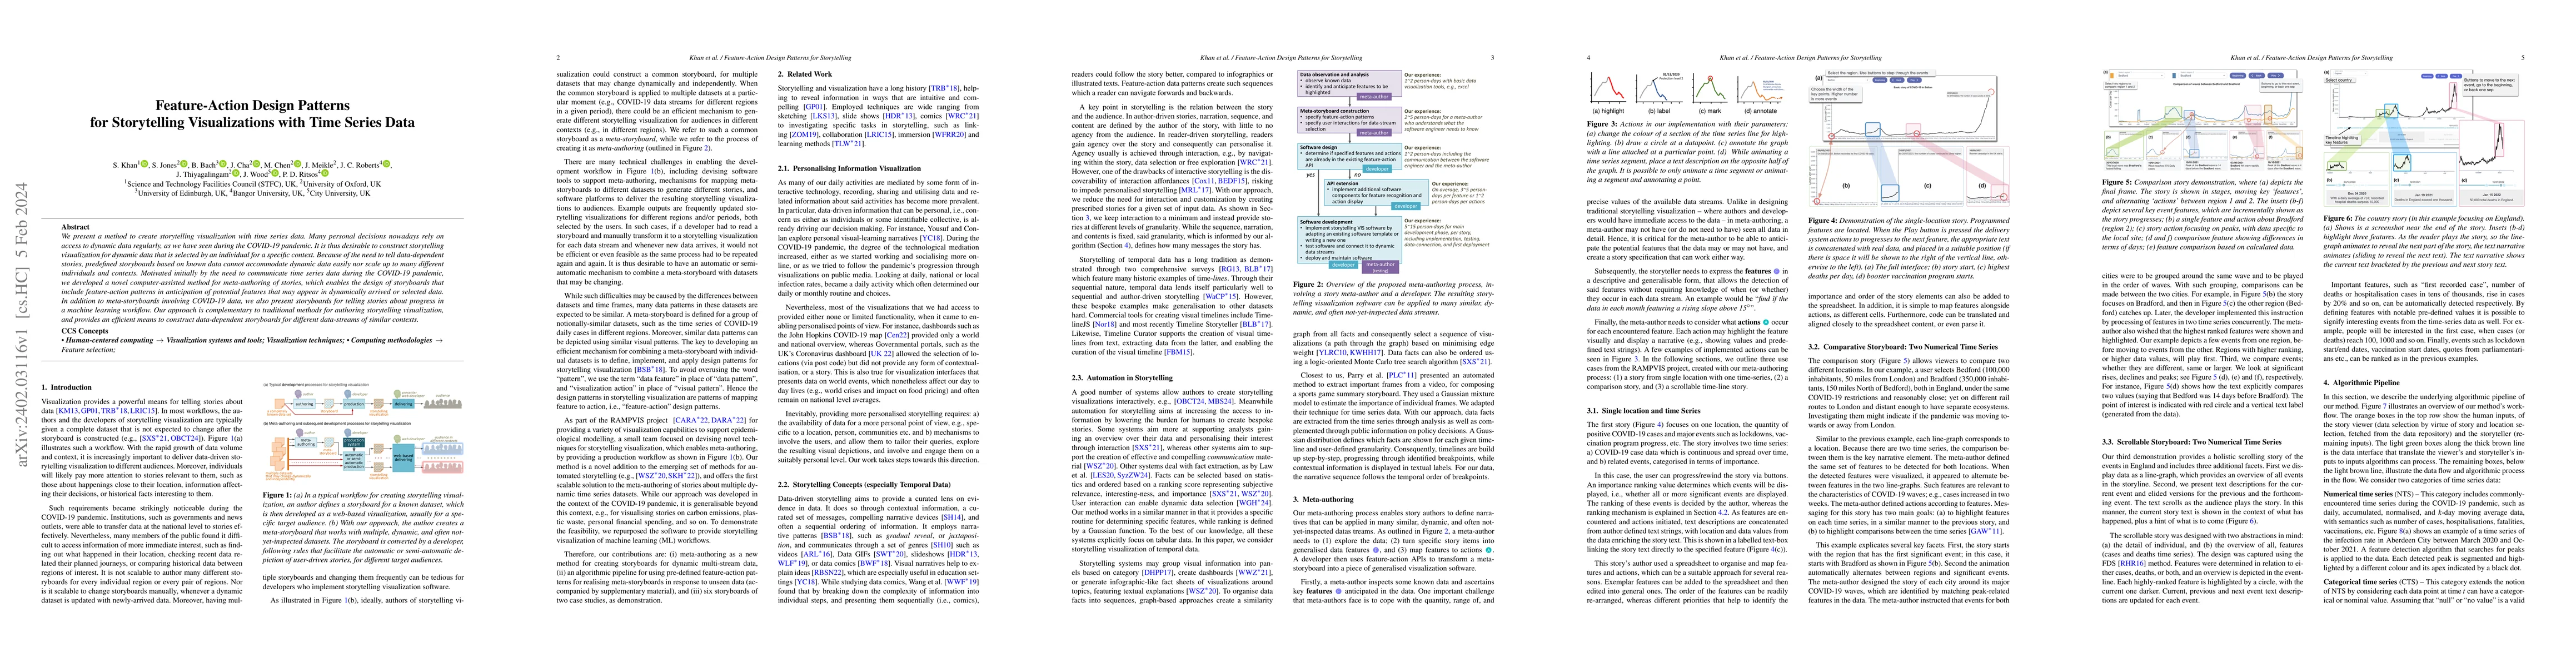
We present a method to create storytelling visualization with time series data. Many personal decisions nowadays rely on access to dynamic data regularly, as we have seen during the COVID-19 pandemi...
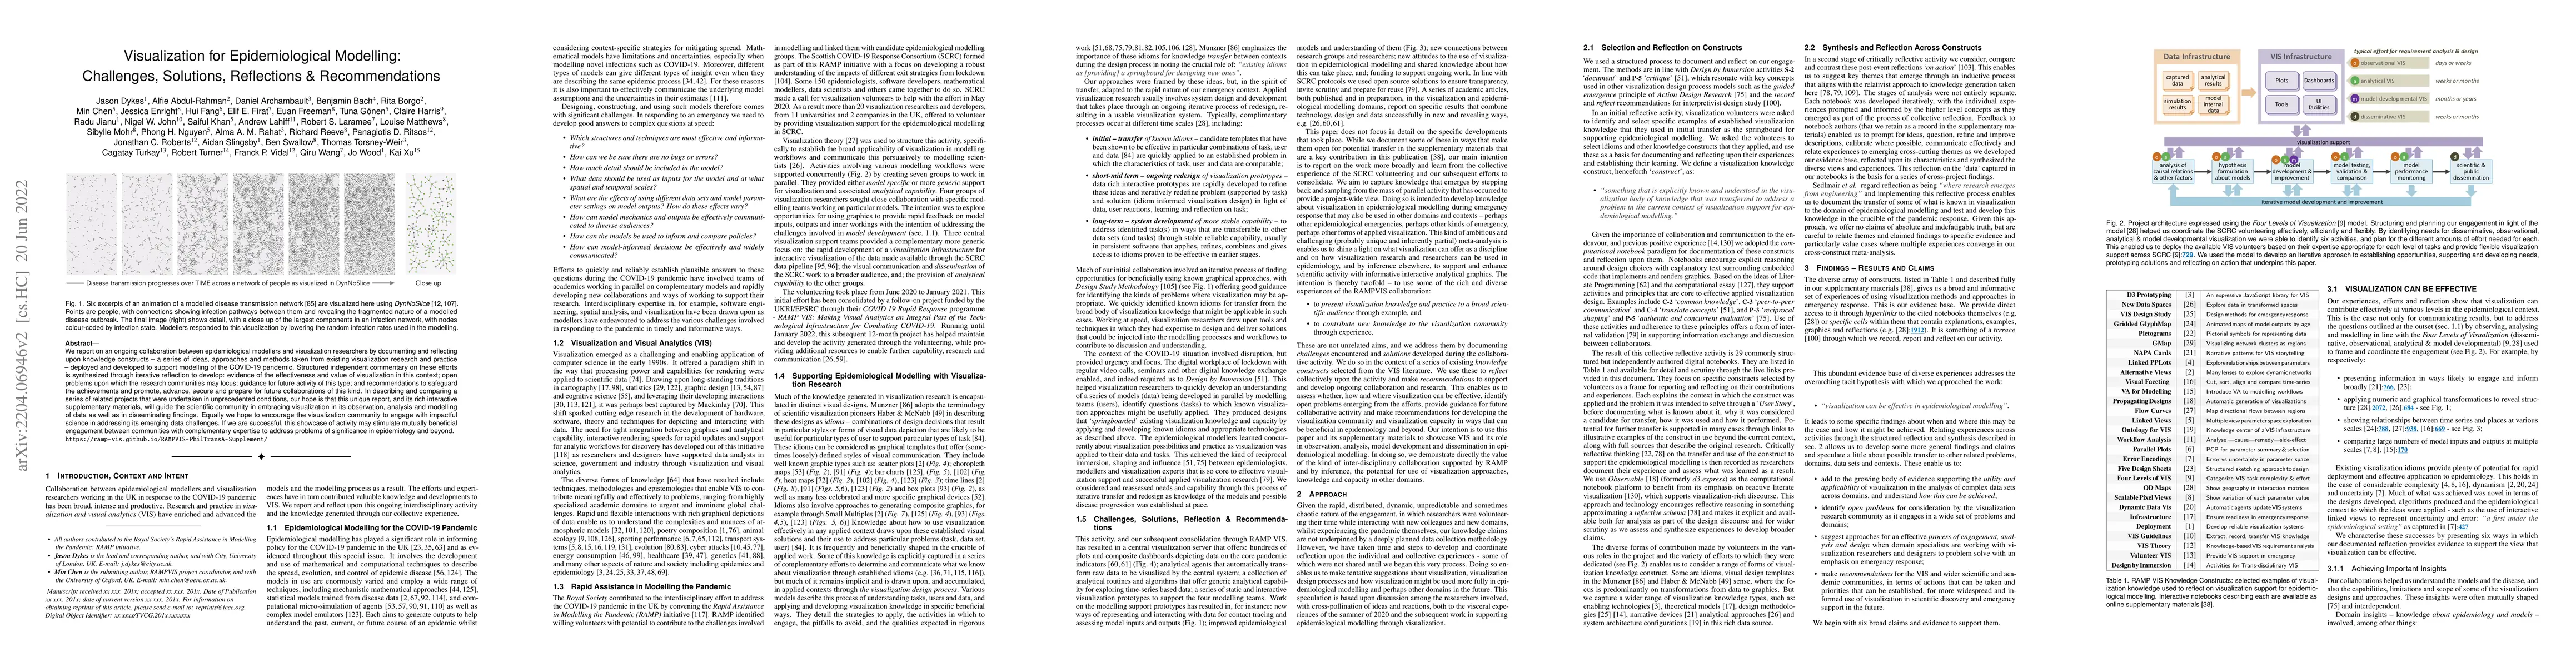
We report on an ongoing collaboration between epidemiological modellers and visualization researchers by documenting and reflecting upon knowledge constructs -- a series of ideas, approaches and met...
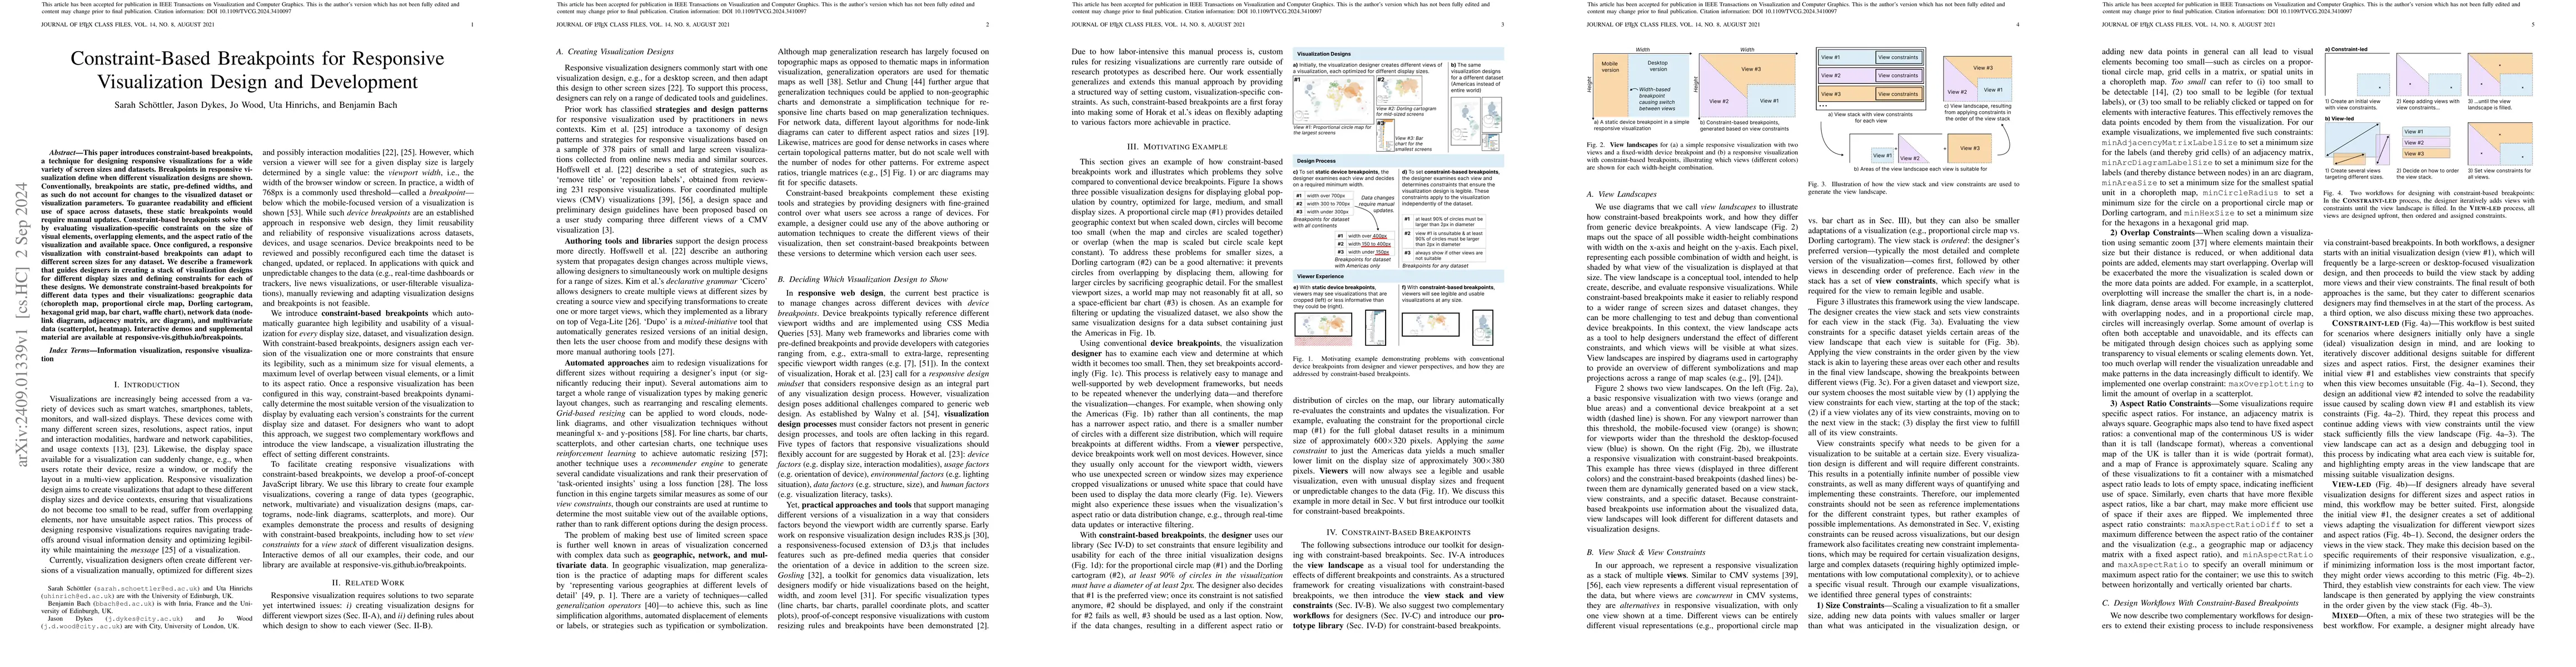
This paper introduces constraint-based breakpoints, a technique for designing responsive visualizations for a wide variety of screen sizes and datasets. Breakpoints in responsive visualization define ...
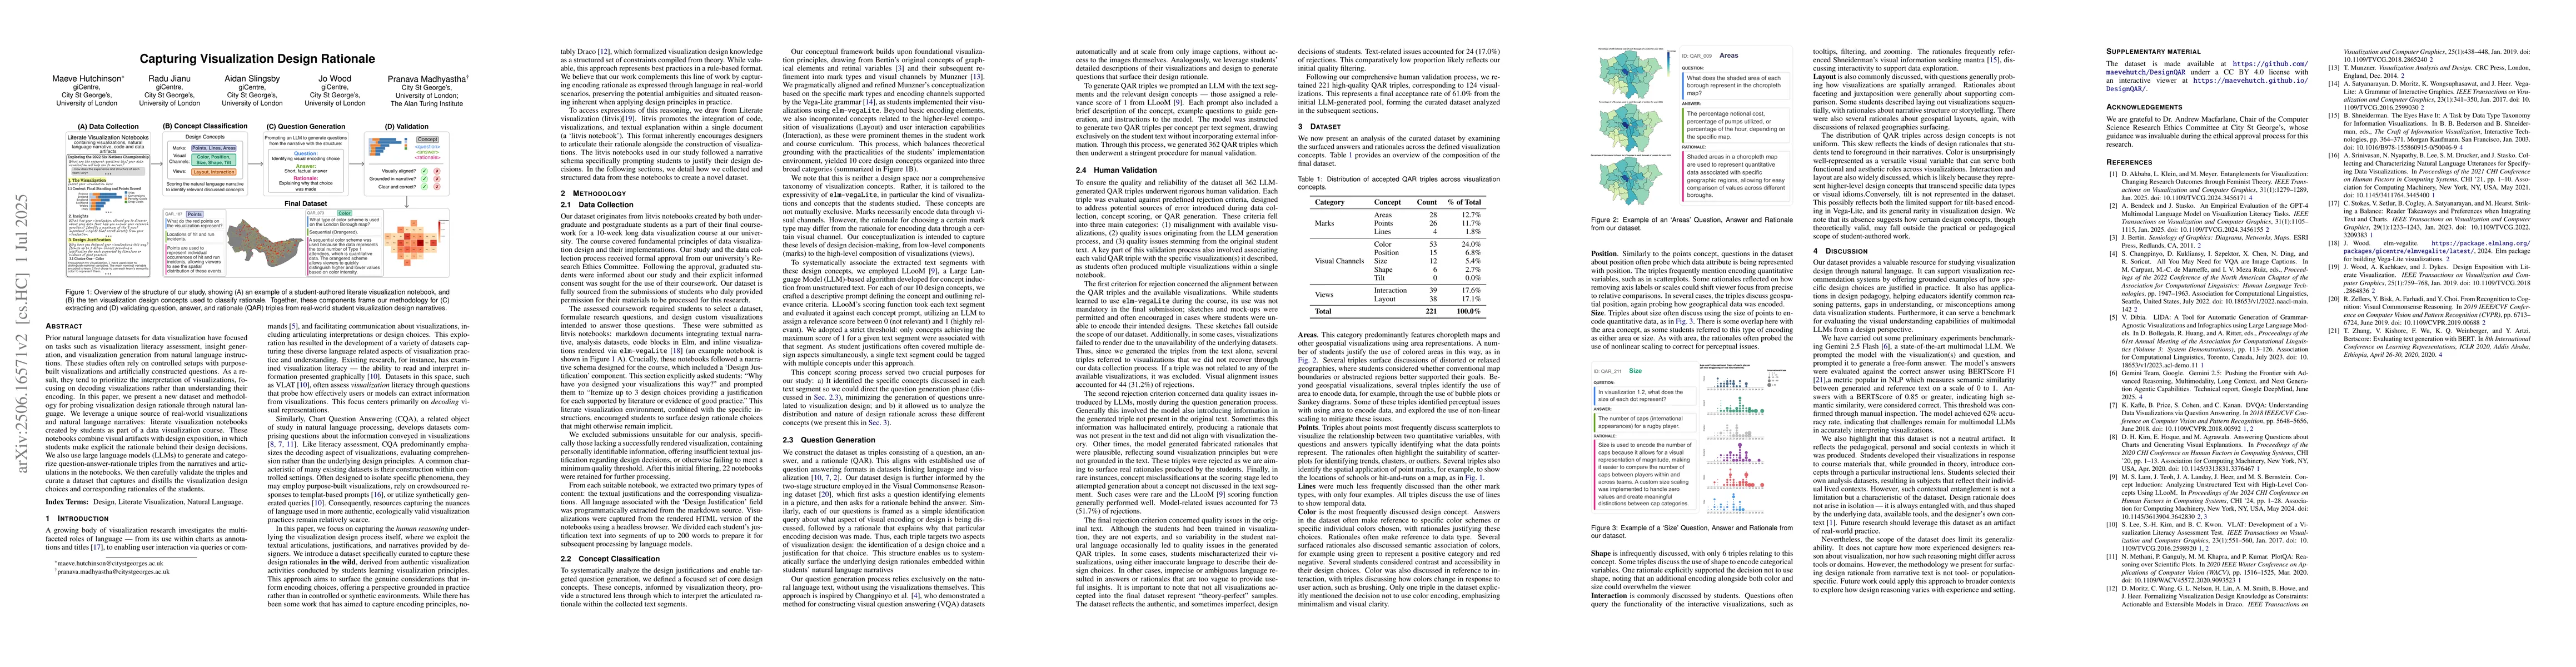
Prior natural language datasets for data visualization have focused on tasks such as visualization literacy assessment, insight generation, and visualization generation from natural language instructi...
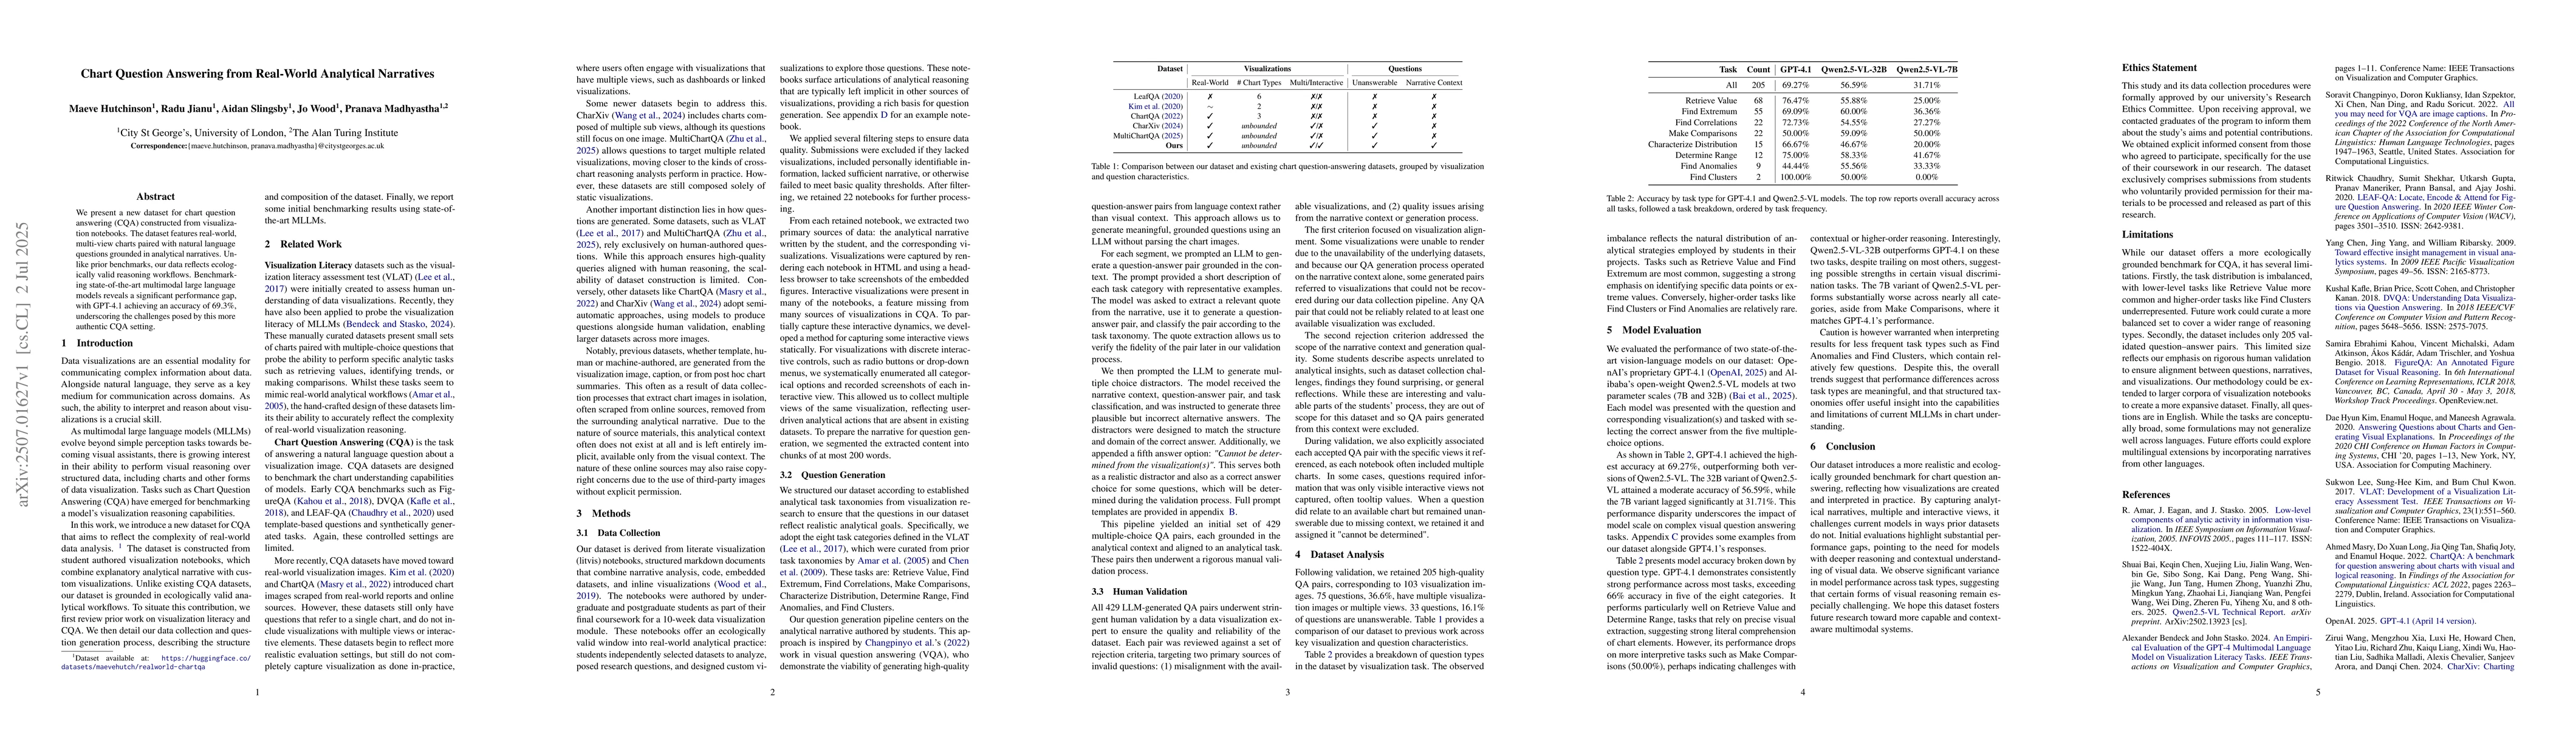
We present a new dataset for chart question answering (CQA) constructed from visualization notebooks. The dataset features real-world, multi-view charts paired with natural language questions grounded...