Academic Profile
Statistics
Similar Authors
Papers on arXiv
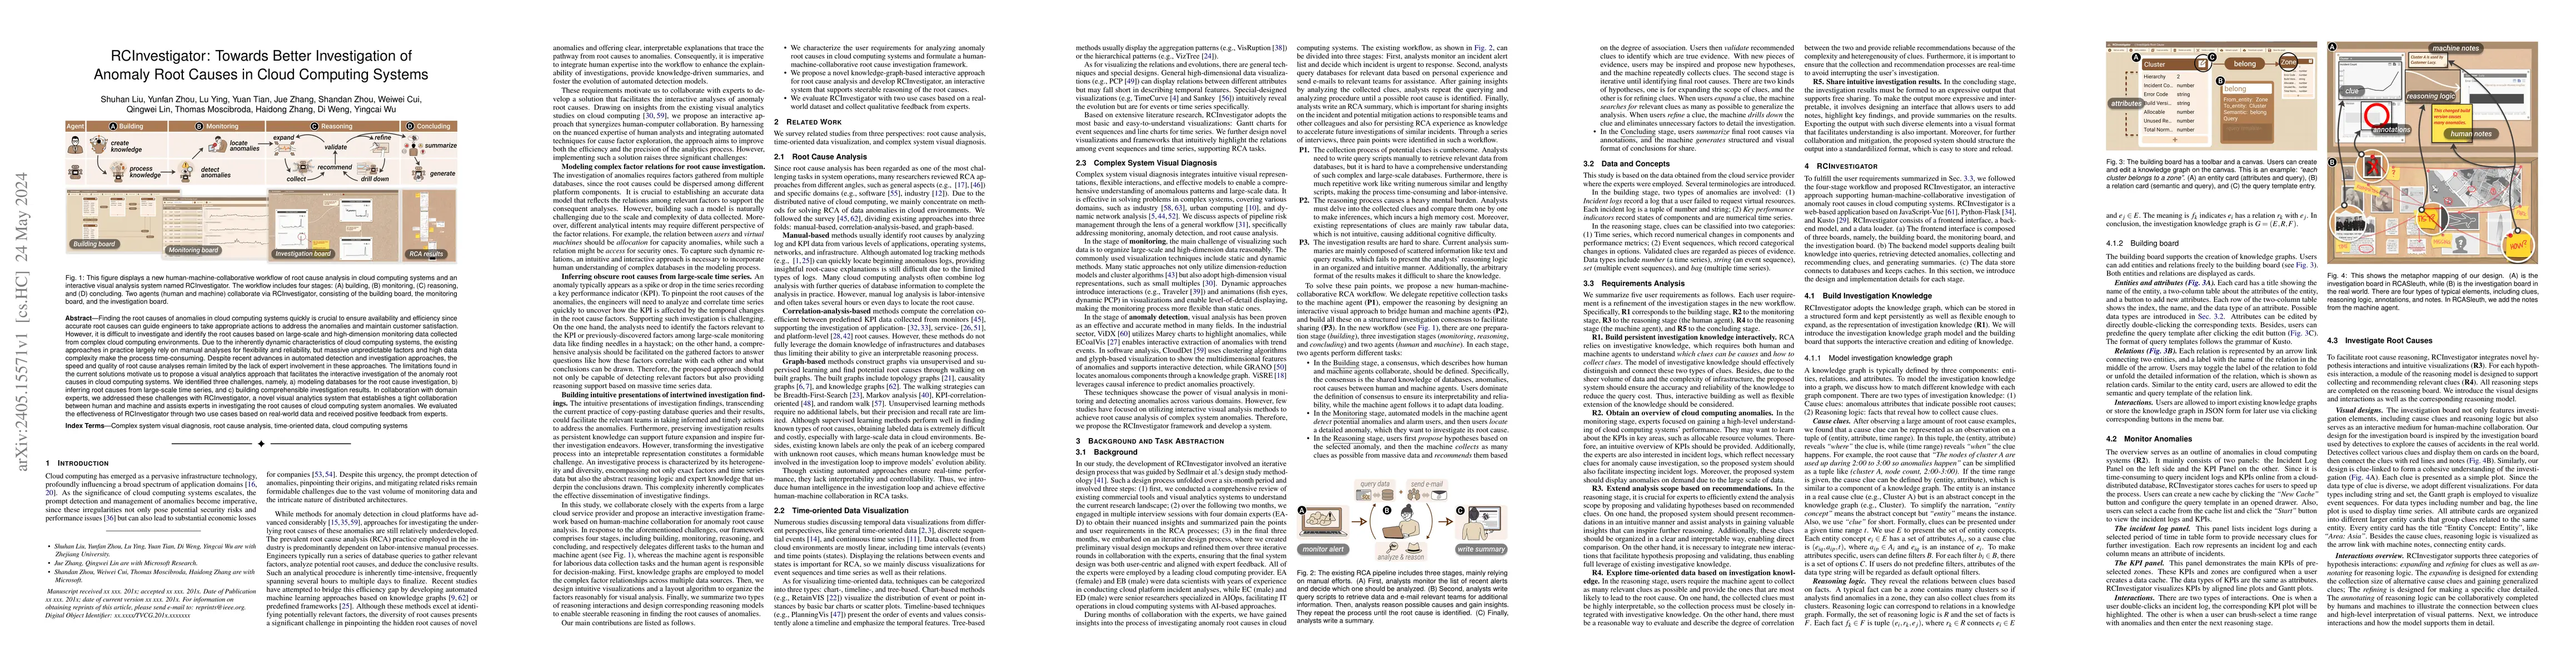
Finding the root causes of anomalies in cloud computing systems quickly is crucial to ensure availability and efficiency since accurate root causes can guide engineers to take appropriate actions to...
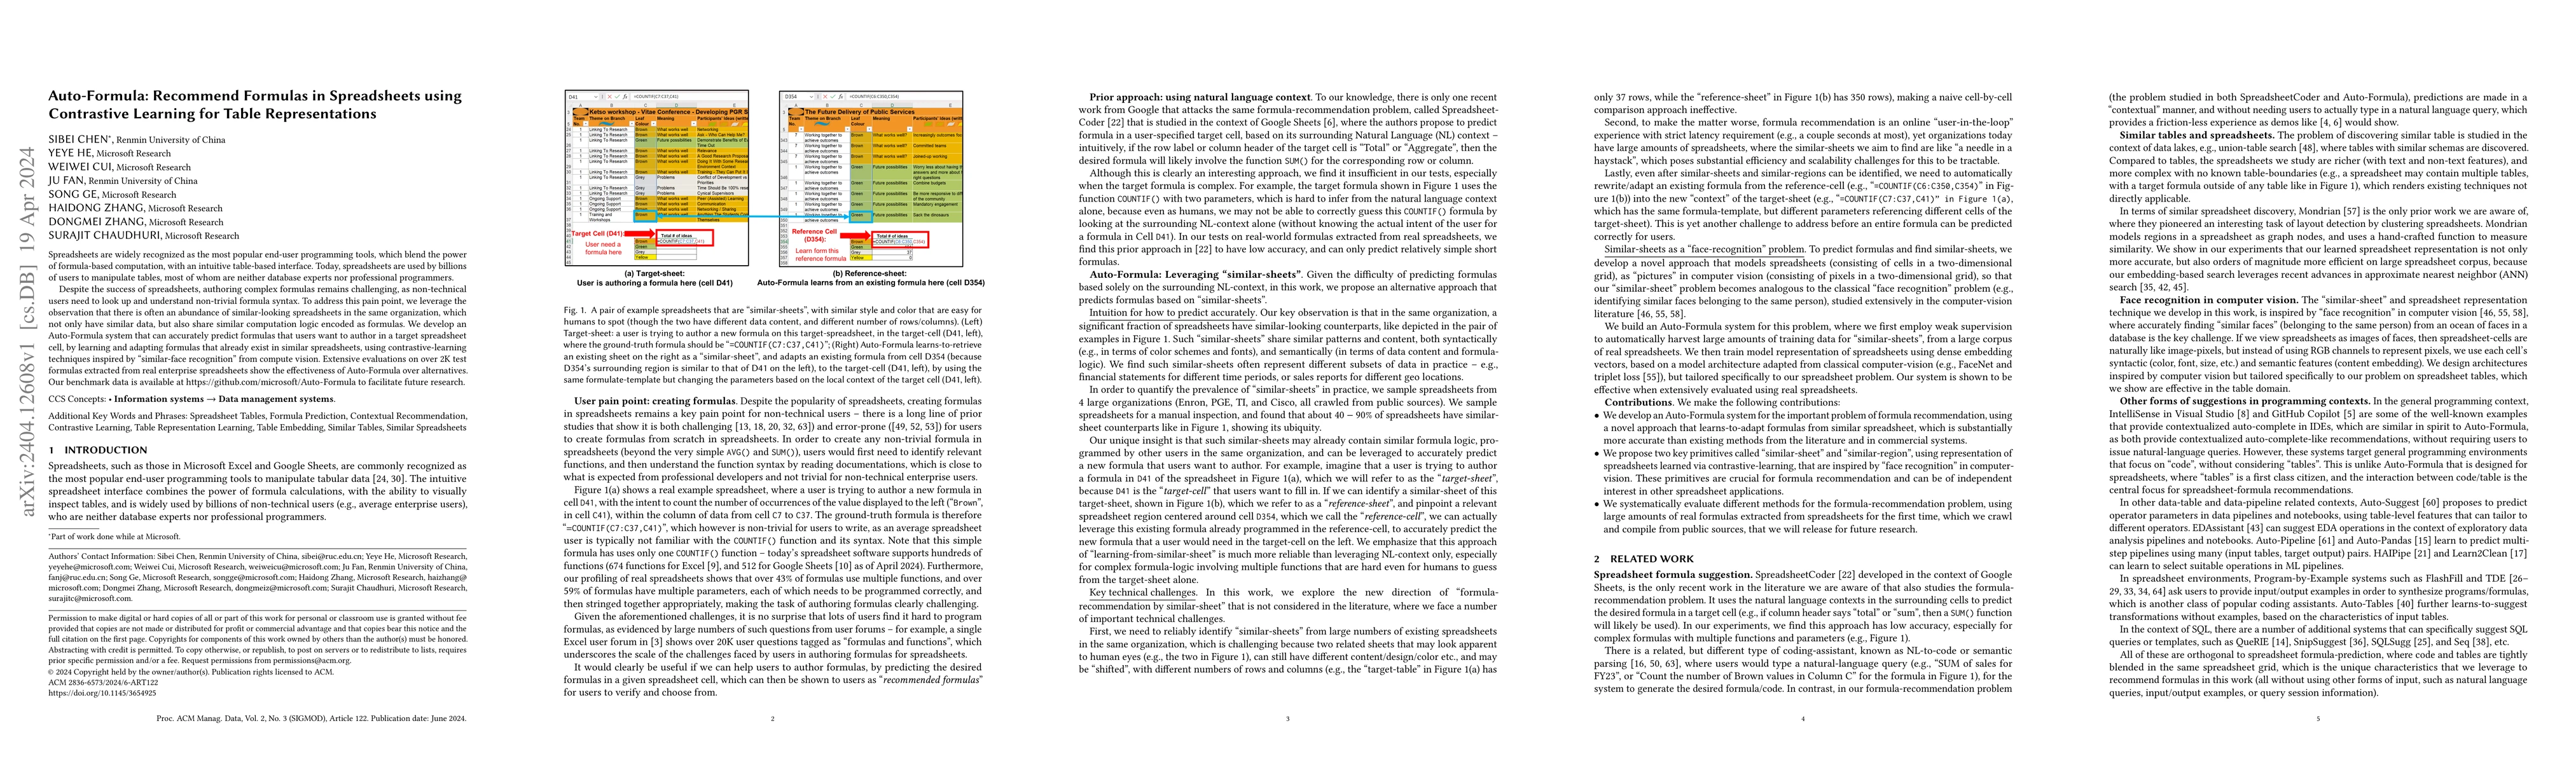
Spreadsheets are widely recognized as the most popular end-user programming tools, which blend the power of formula-based computation, with an intuitive table-based interface. Today, spreadsheets ar...
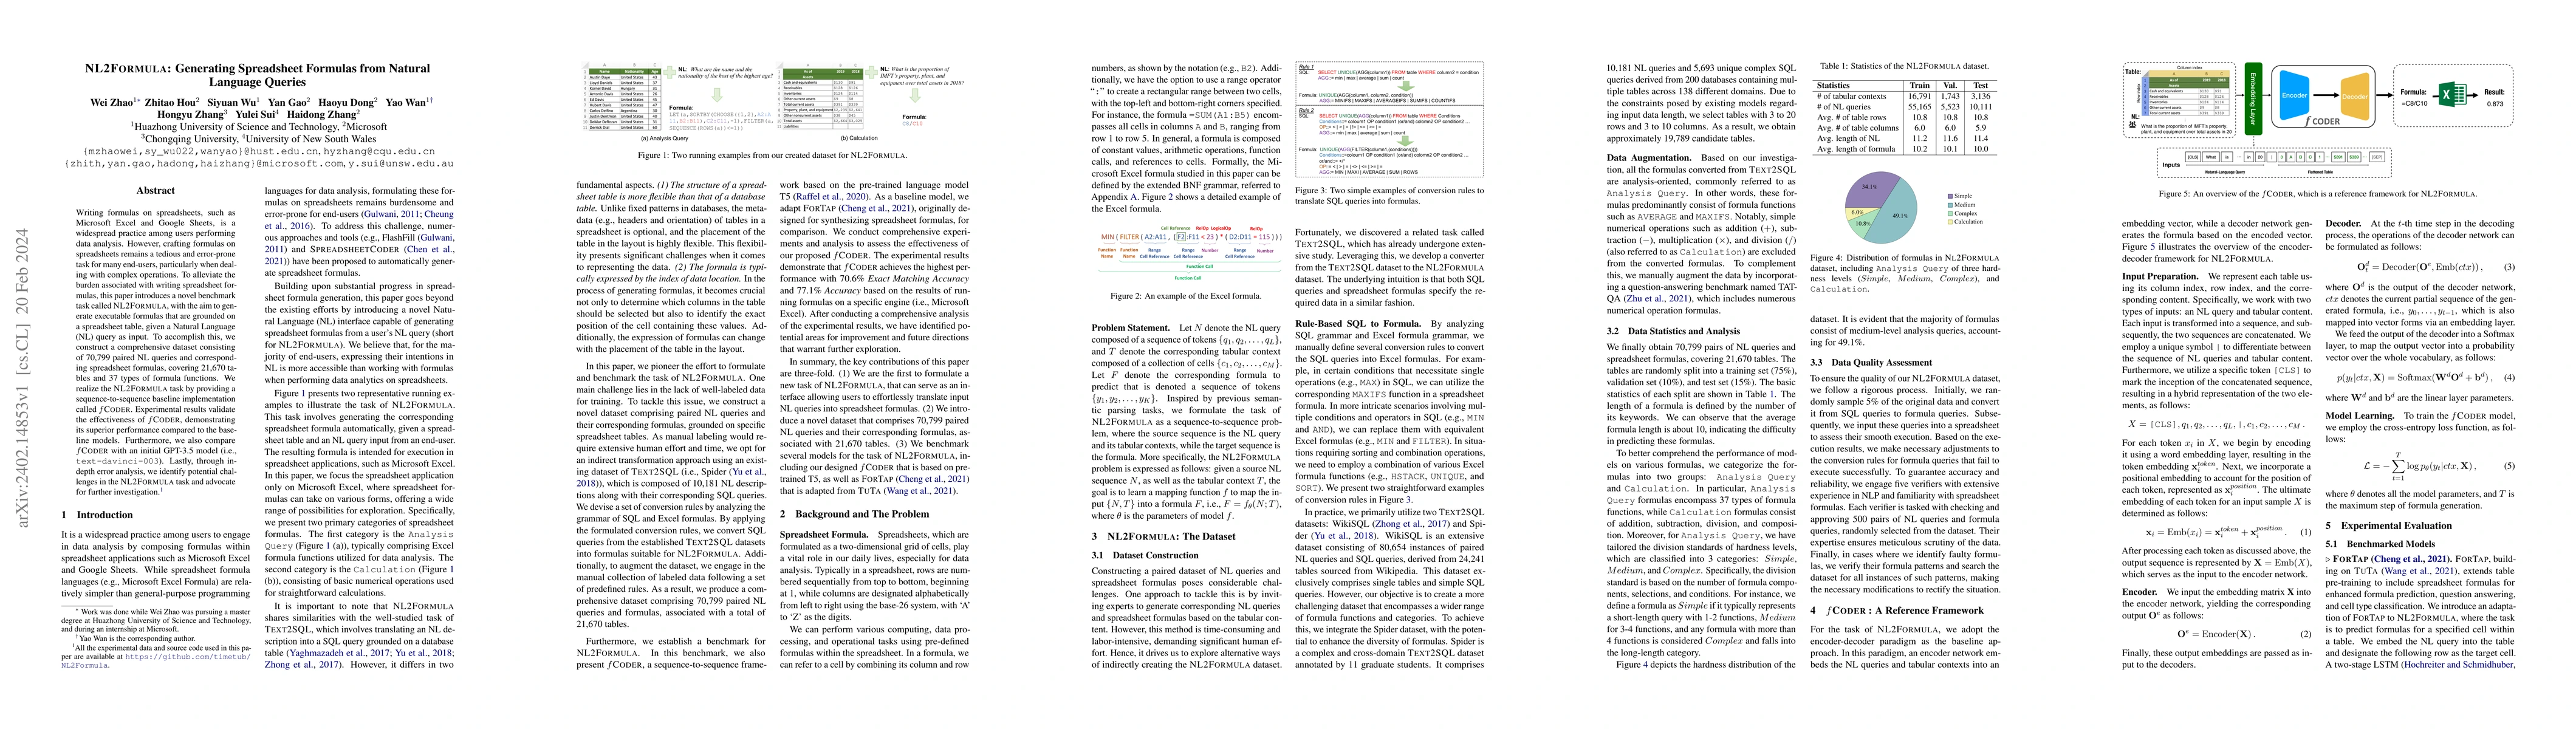
Writing formulas on spreadsheets, such as Microsoft Excel and Google Sheets, is a widespread practice among users performing data analysis. However, crafting formulas on spreadsheets remains a tedio...
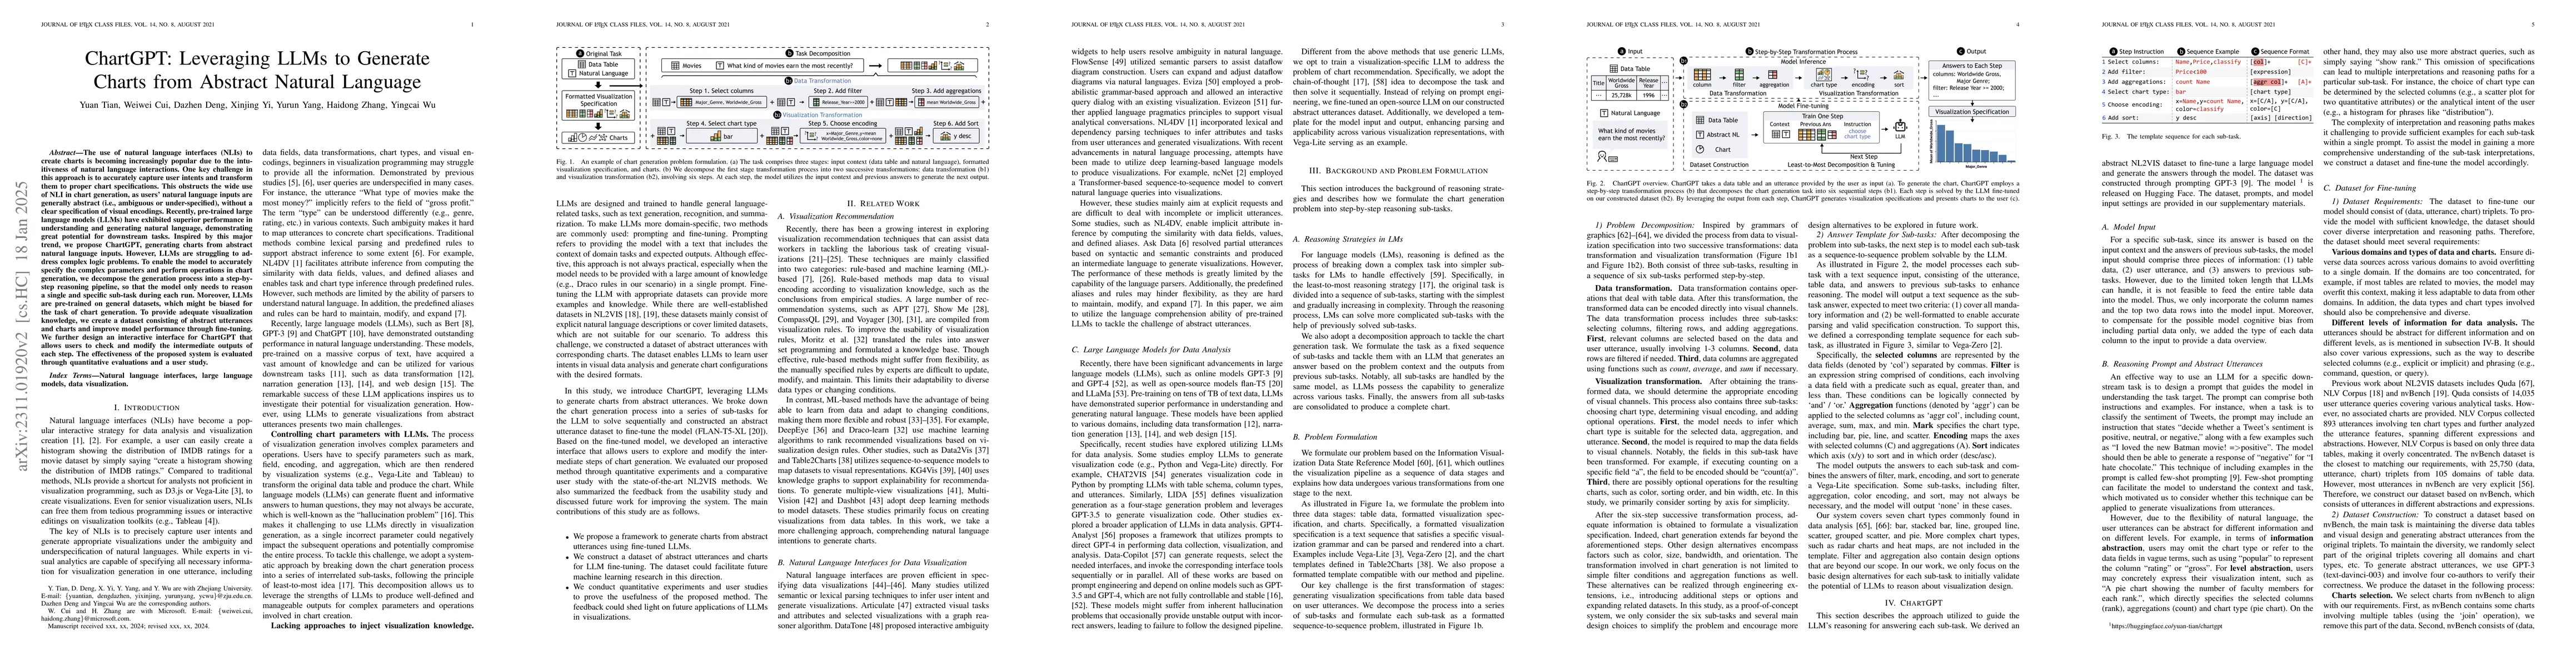
The use of natural language interfaces (NLIs) for the creation of charts is becoming increasingly popular due to the intuitiveness of natural language interactions. One key challenge in this approac...
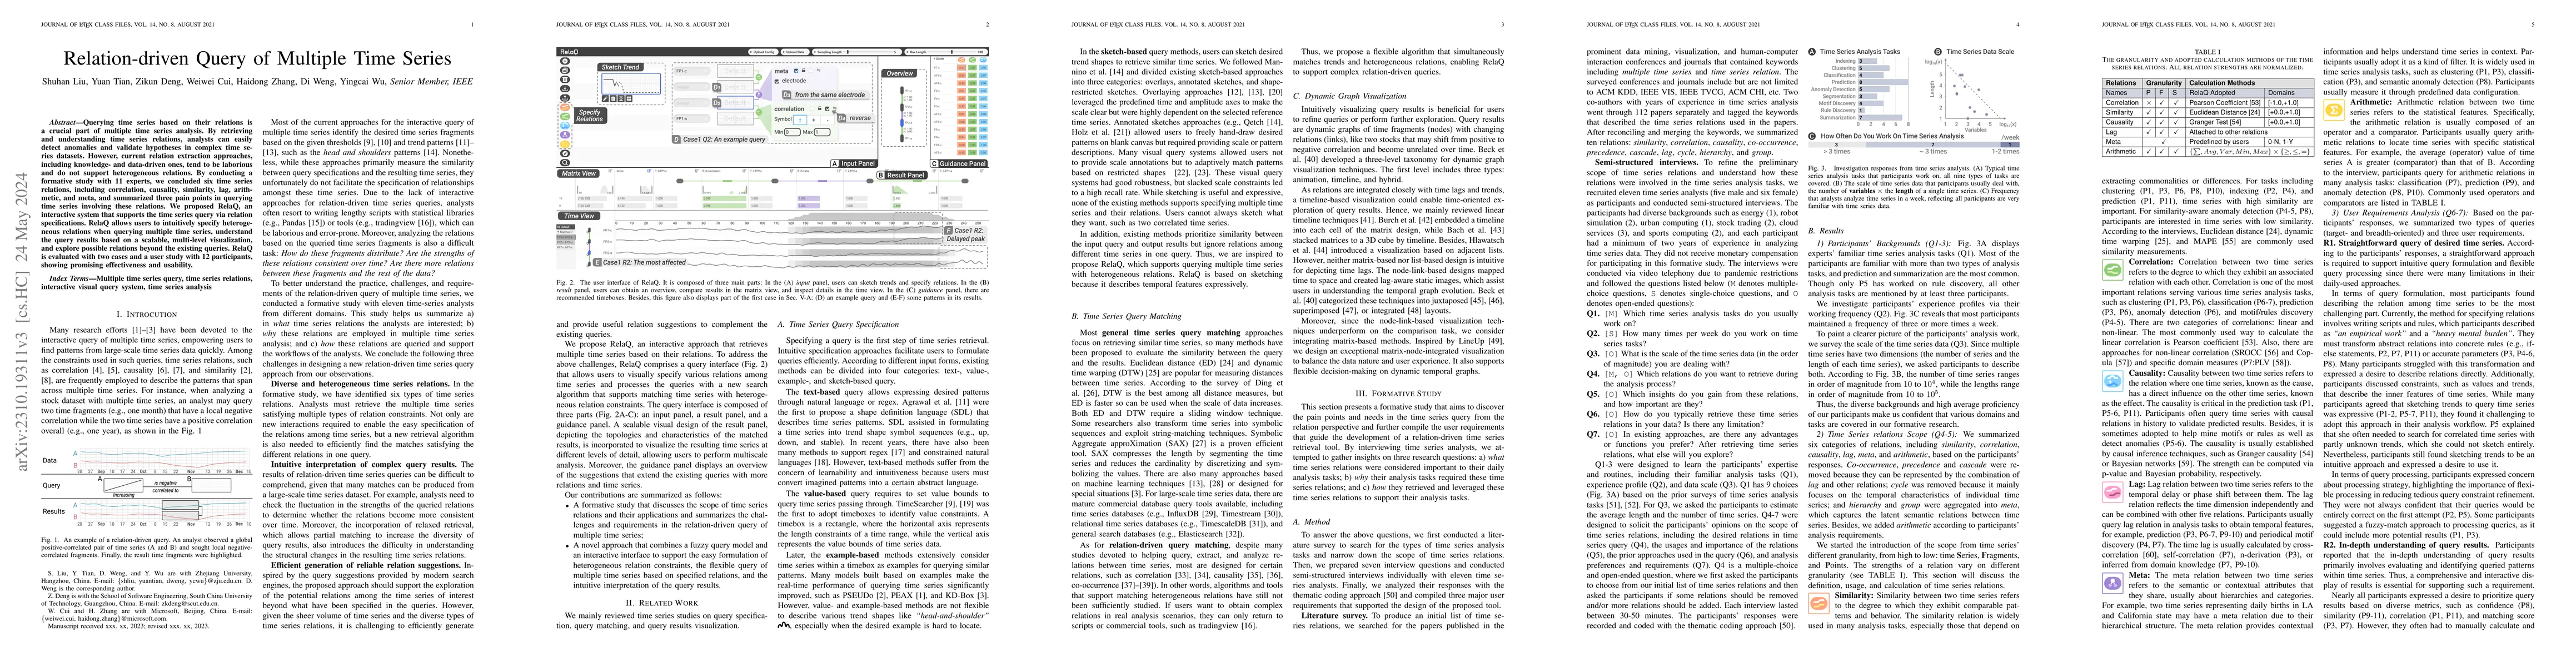
Querying time series based on their relations is a crucial part of multiple time series analysis. By retrieving and understanding time series relations, analysts can easily detect anomalies and vali...
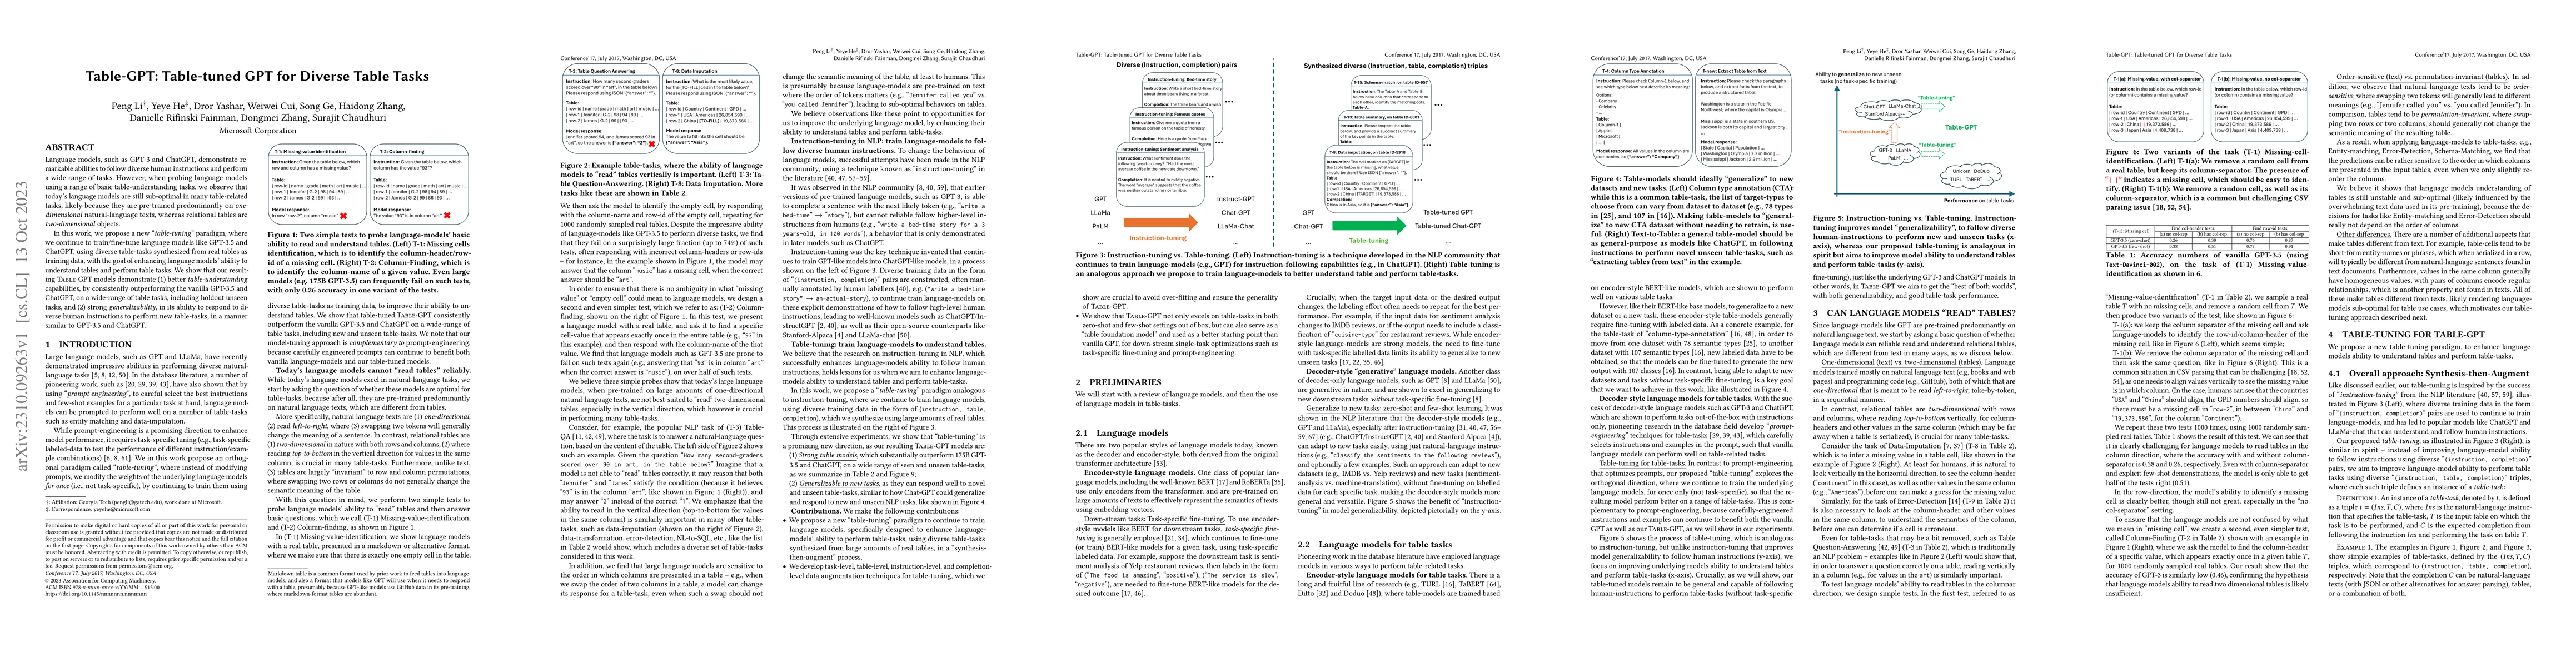
Language models, such as GPT-3.5 and ChatGPT, demonstrate remarkable abilities to follow diverse human instructions and perform a wide range of tasks. However, when probing language models using a r...
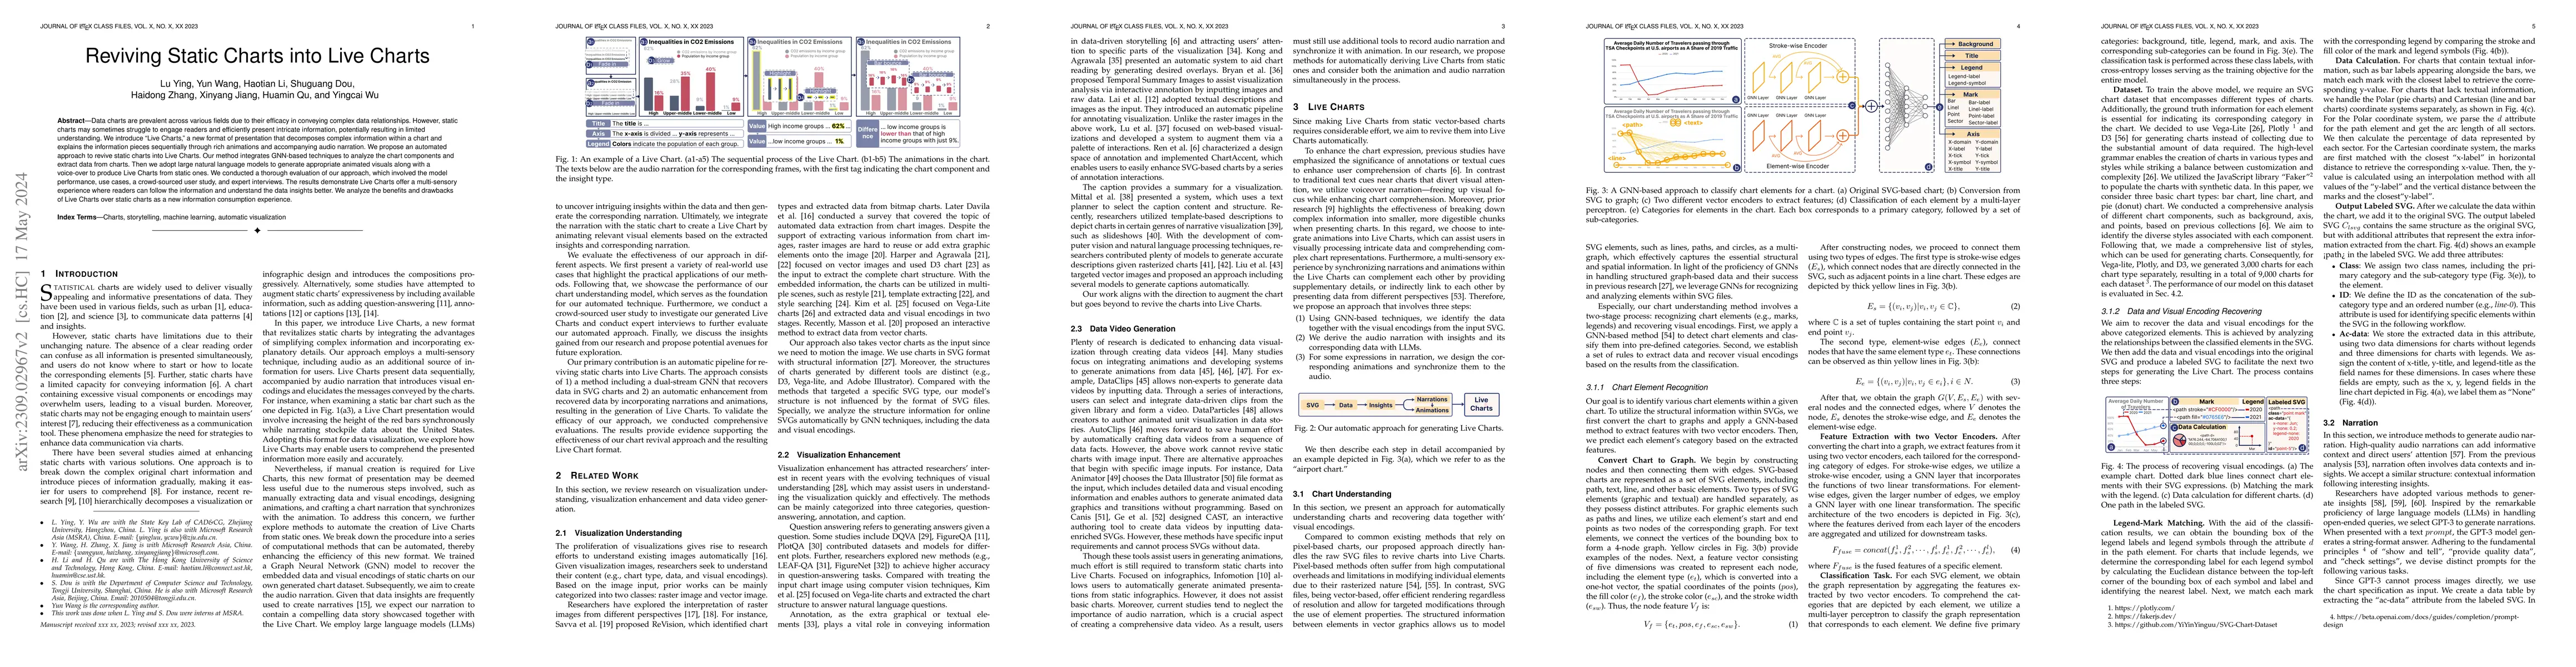
Data charts are prevalent across various fields due to their efficacy in conveying complex data relationships. However, static charts may sometimes struggle to engage readers and efficiently present...
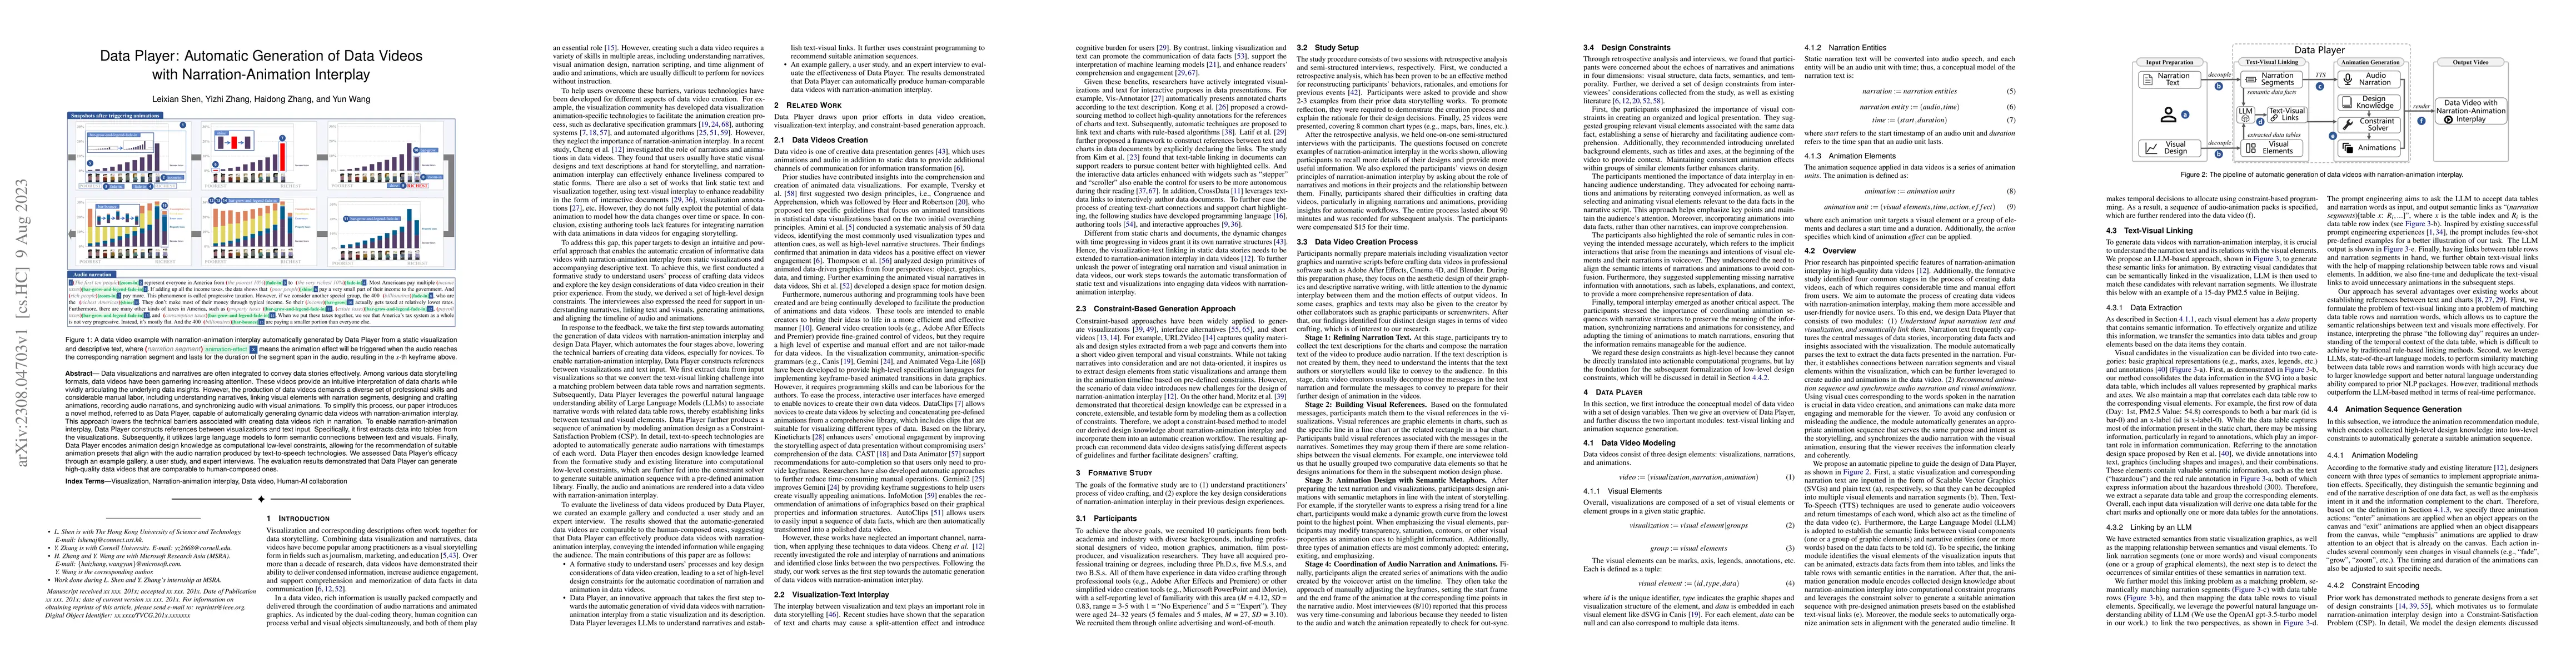
Data visualizations and narratives are often integrated to convey data stories effectively. Among various data storytelling formats, data videos have been garnering increasing attention. These video...
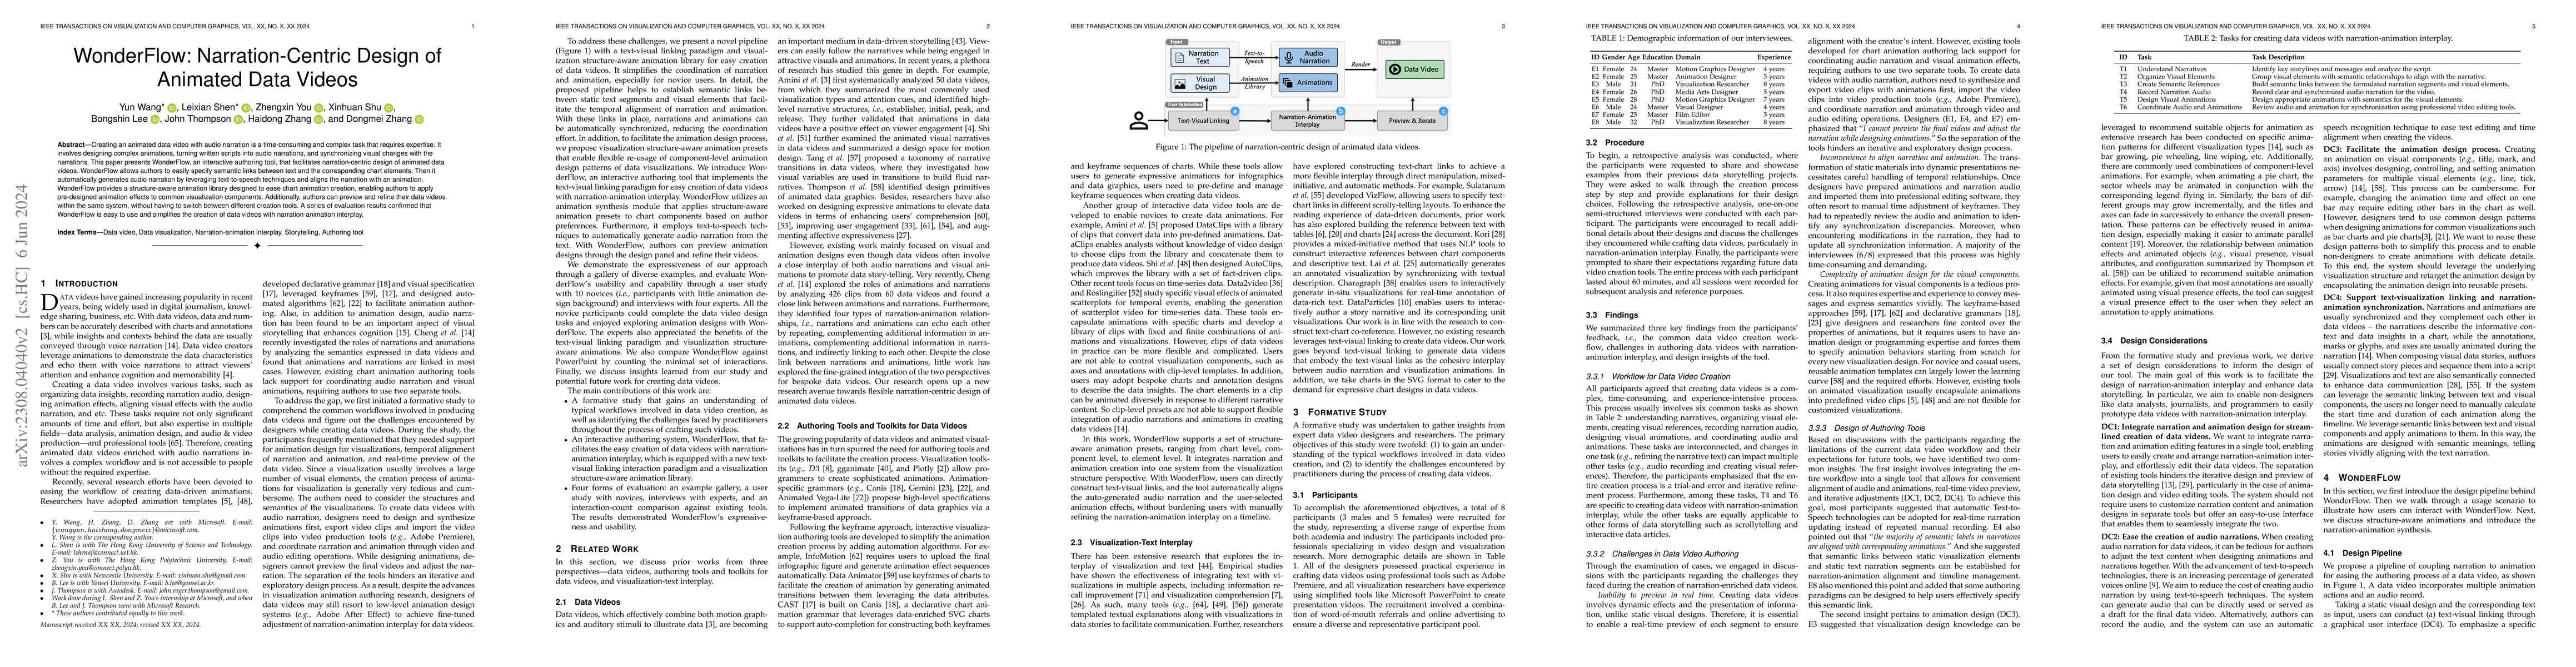
Creating an animated data video enriched with audio narration takes a significant amount of time and effort and requires expertise. Users not only need to design complex animations, but also turn wr...
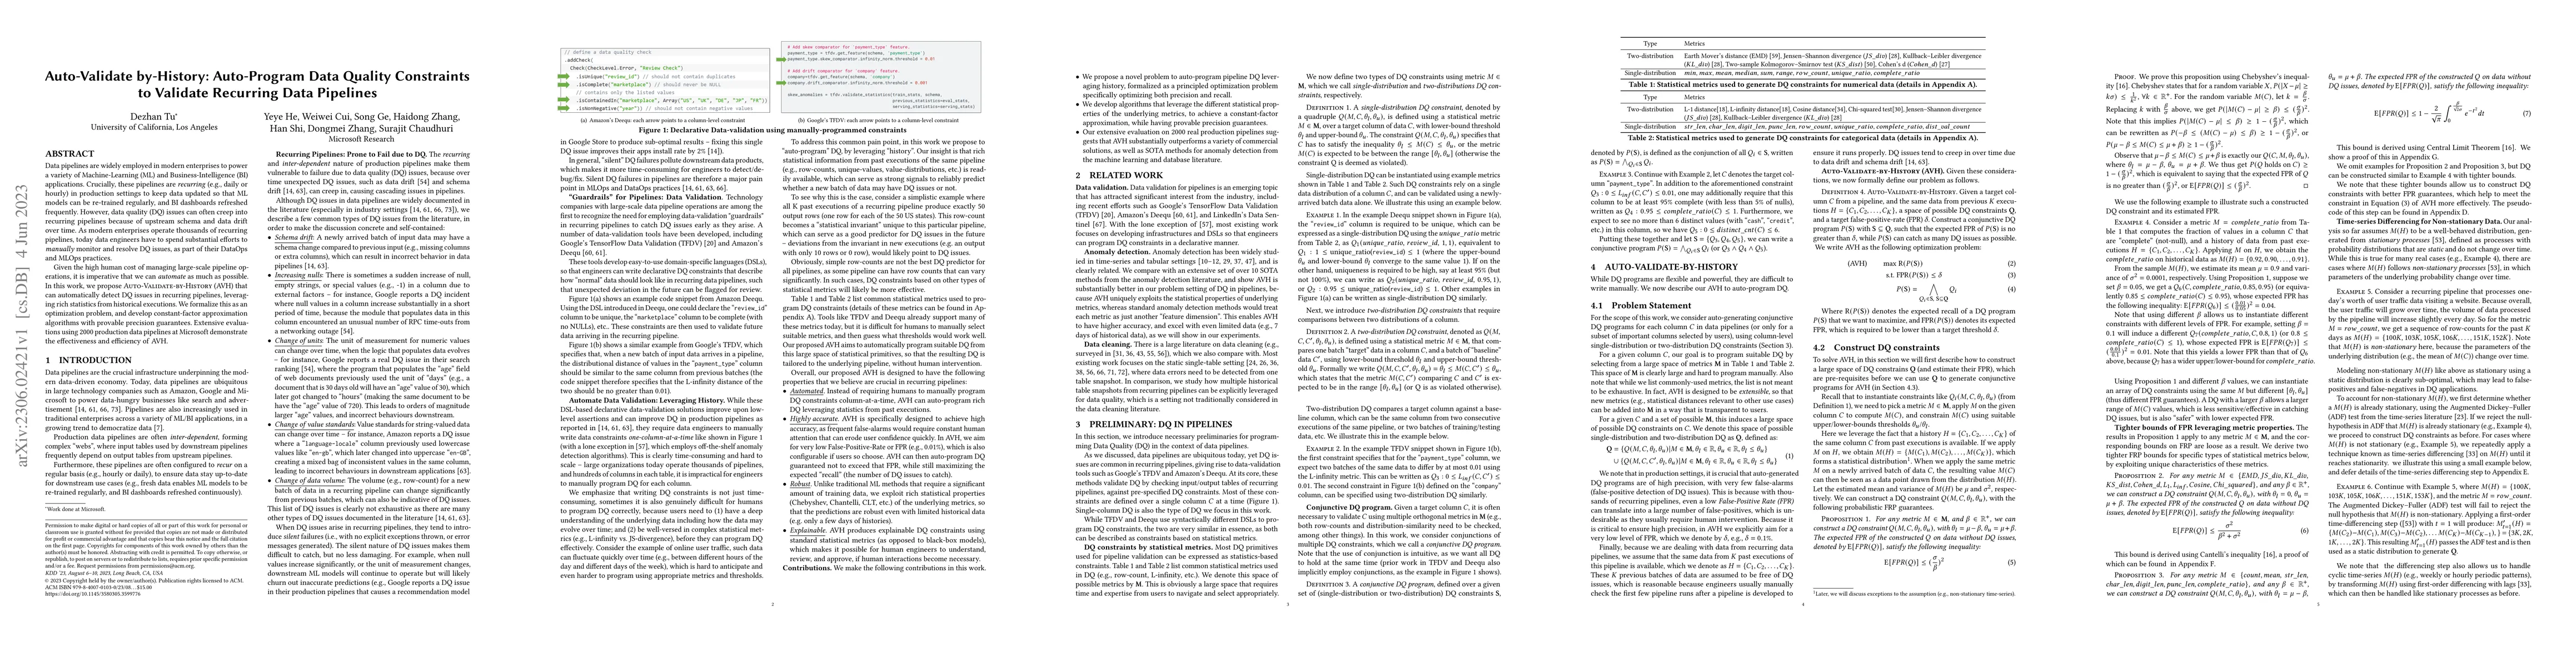
Data pipelines are widely employed in modern enterprises to power a variety of Machine-Learning (ML) and Business-Intelligence (BI) applications. Crucially, these pipelines are \emph{recurring} (e.g...
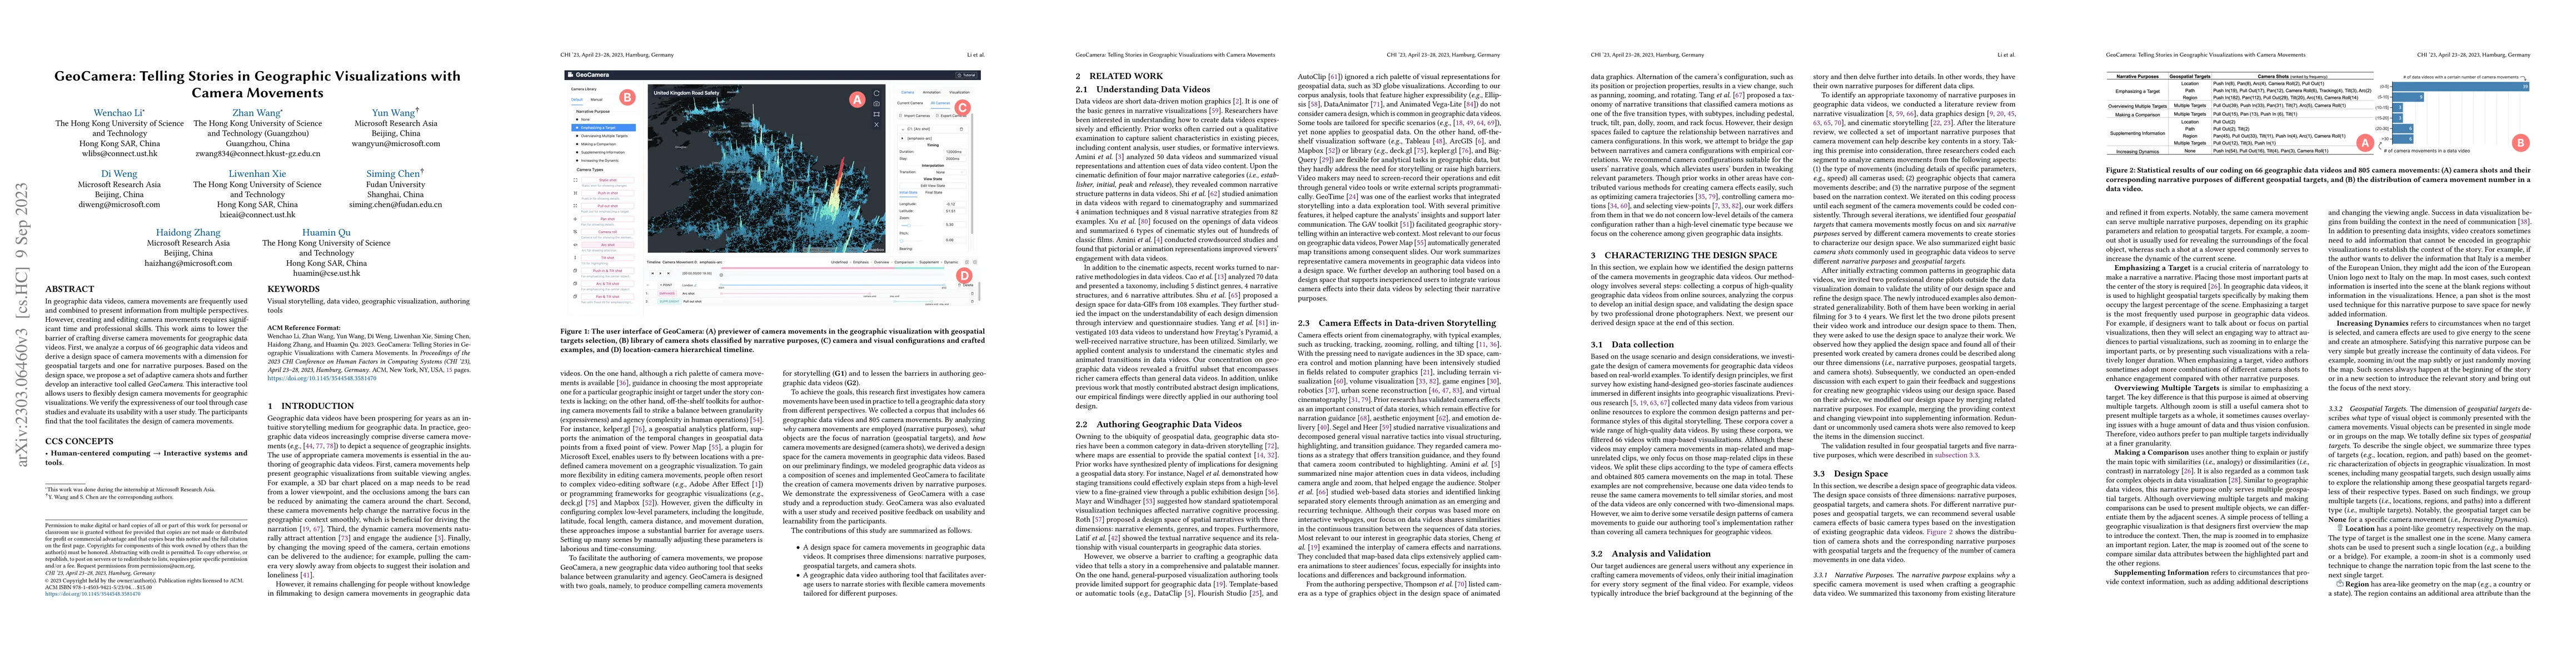
In geographic data videos, camera movements are frequently used and combined to present information from multiple perspectives. However, creating and editing camera movements requires significant ti...
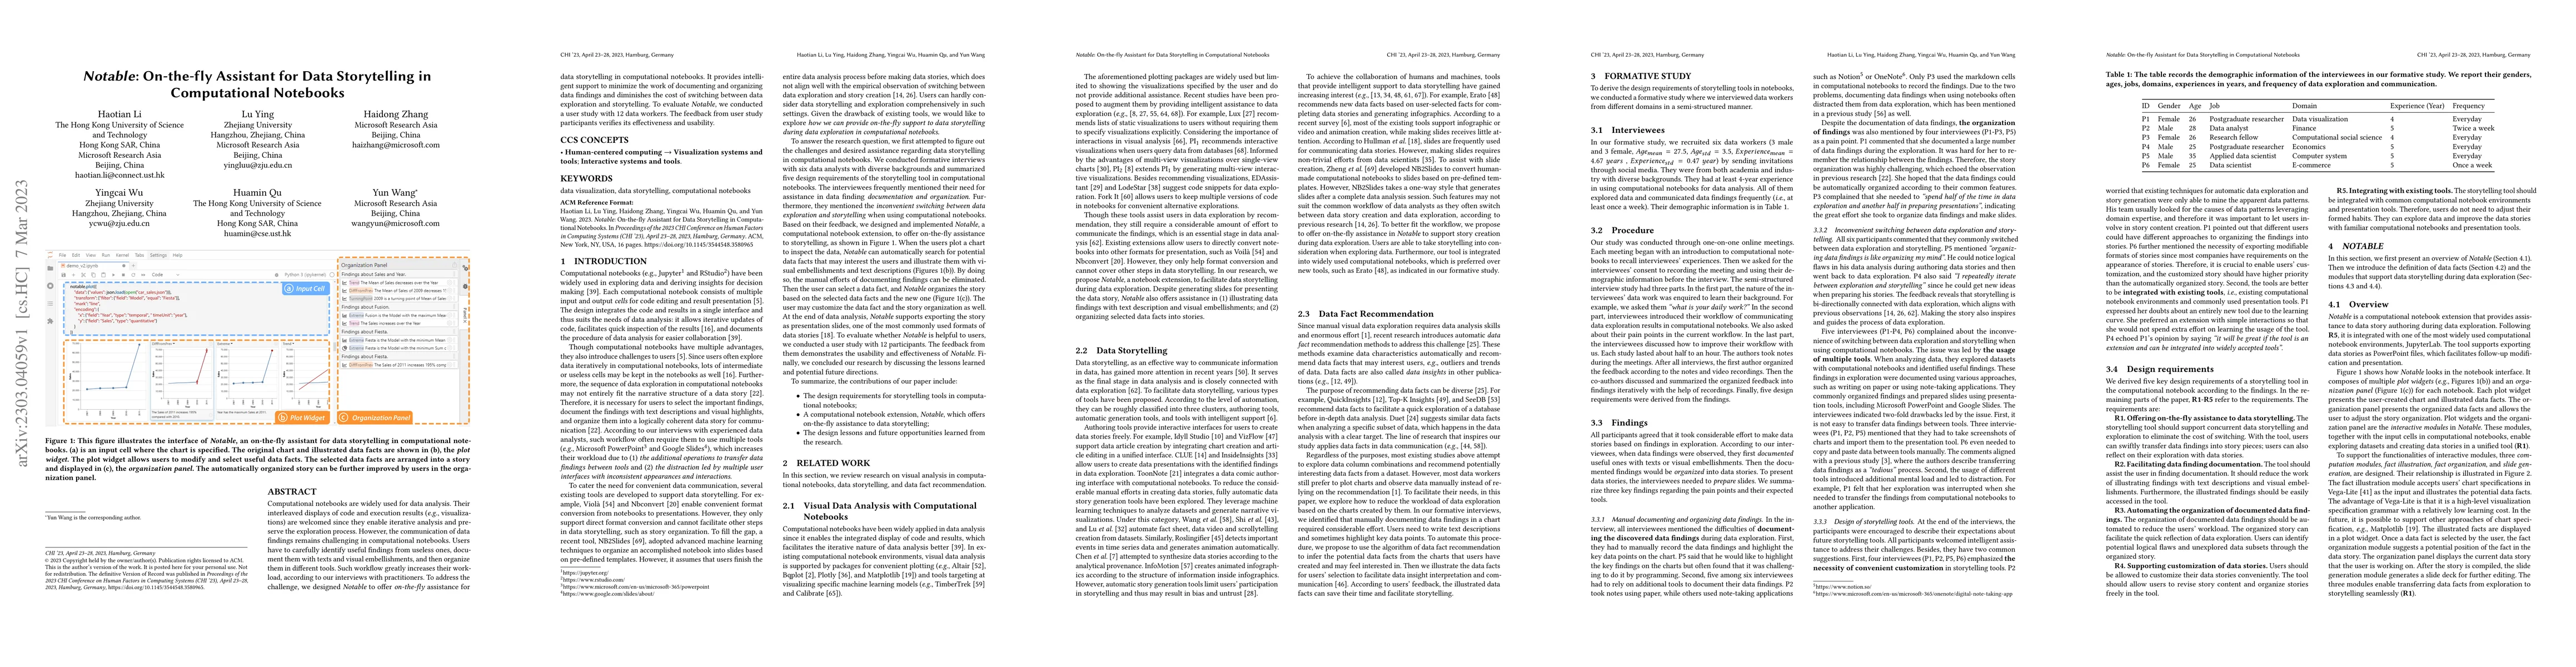
Computational notebooks are widely used for data analysis. Their interleaved displays of code and execution results (e.g., visualizations) are welcomed since they enable iterative analysis and prese...
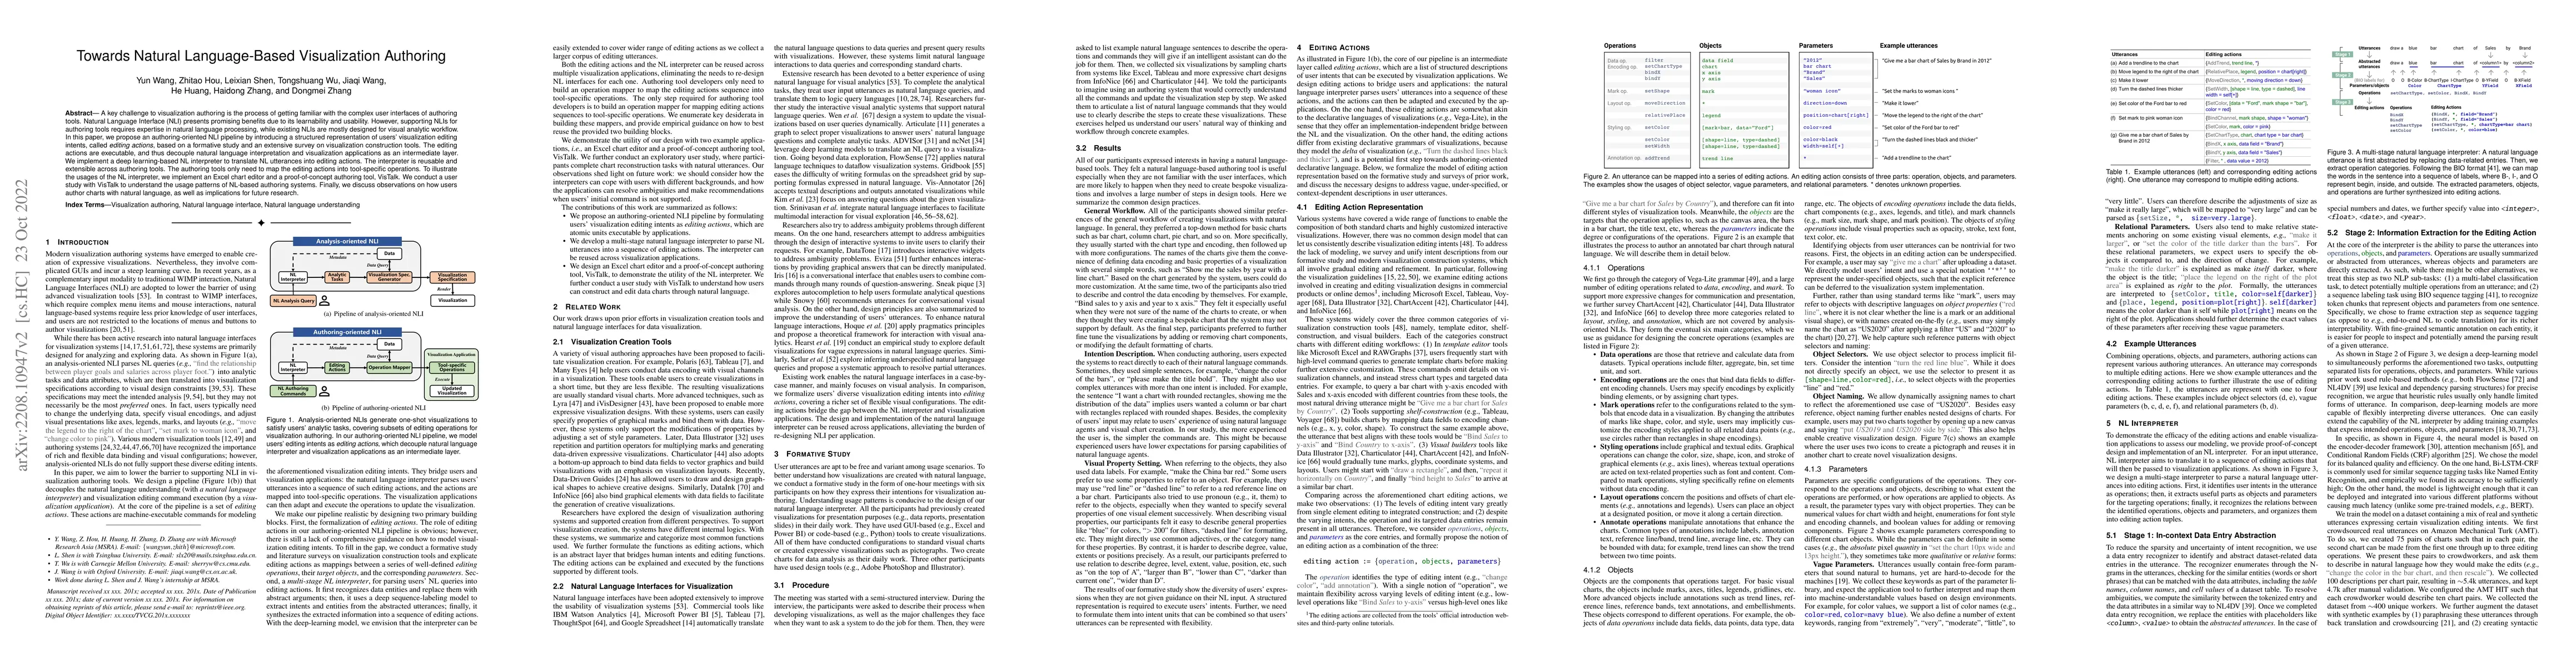
A key challenge to visualization authoring is the process of getting familiar with the complex user interfaces of authoring tools. Natural Language Interface (NLI) presents promising benefits due to...
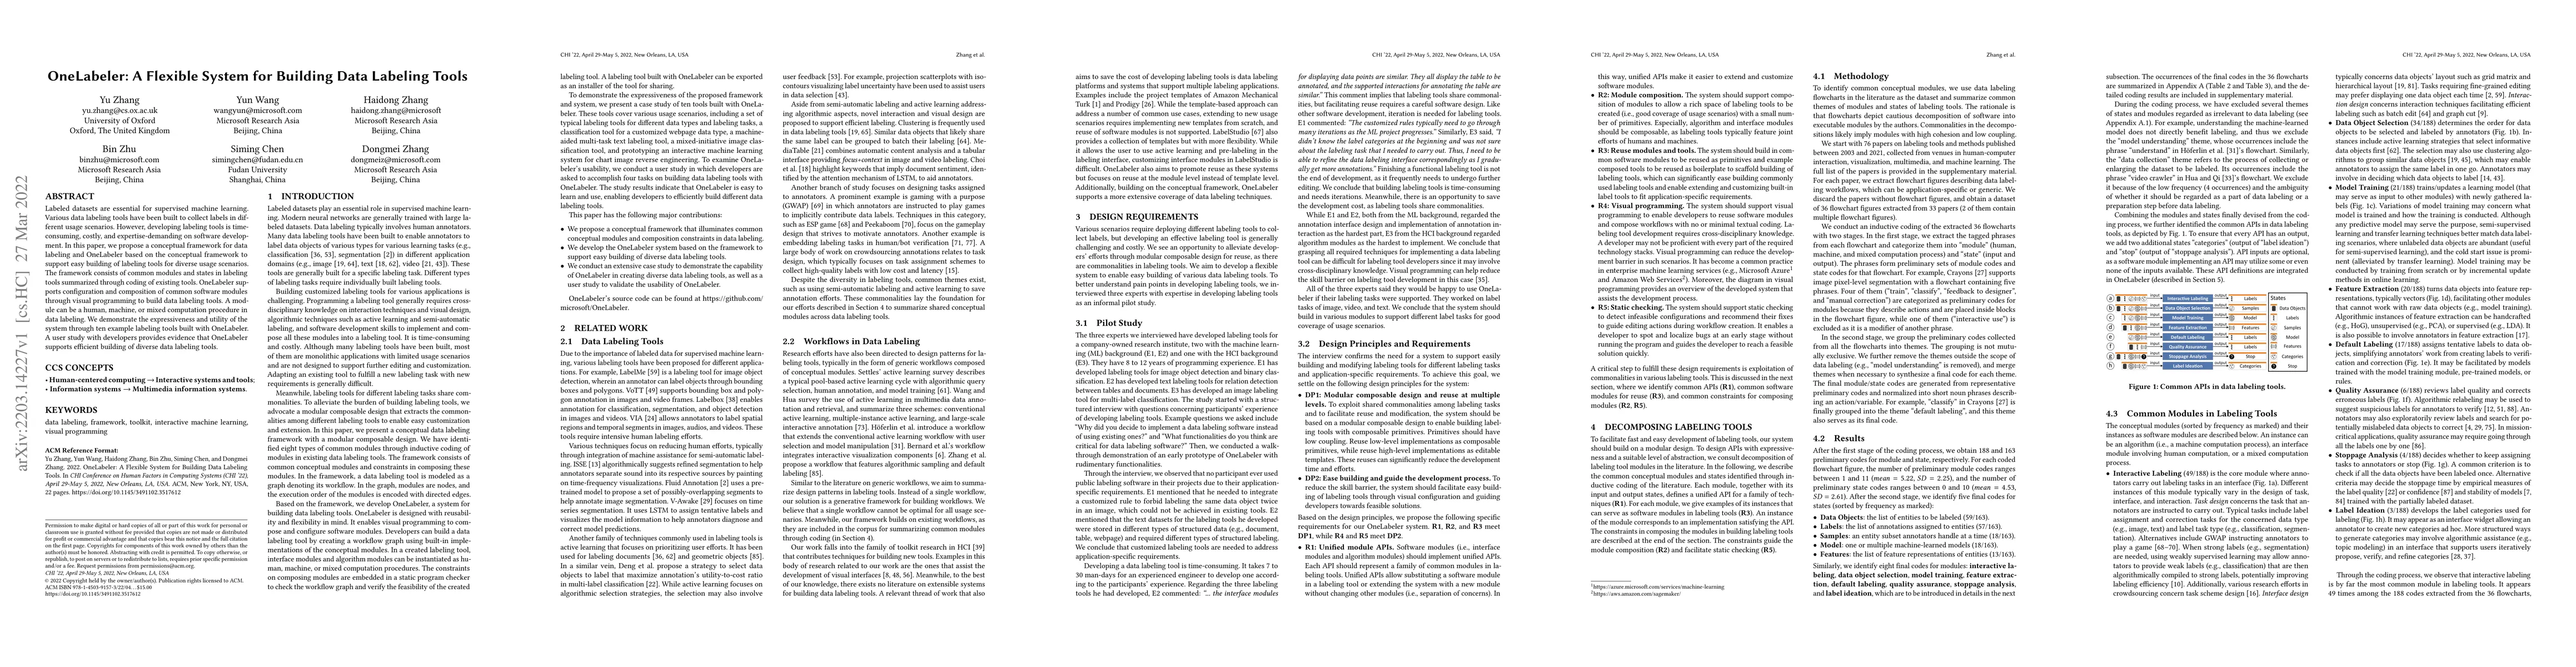
Labeled datasets are essential for supervised machine learning. Various data labeling tools have been built to collect labels in different usage scenarios. However, developing labeling tools is time...
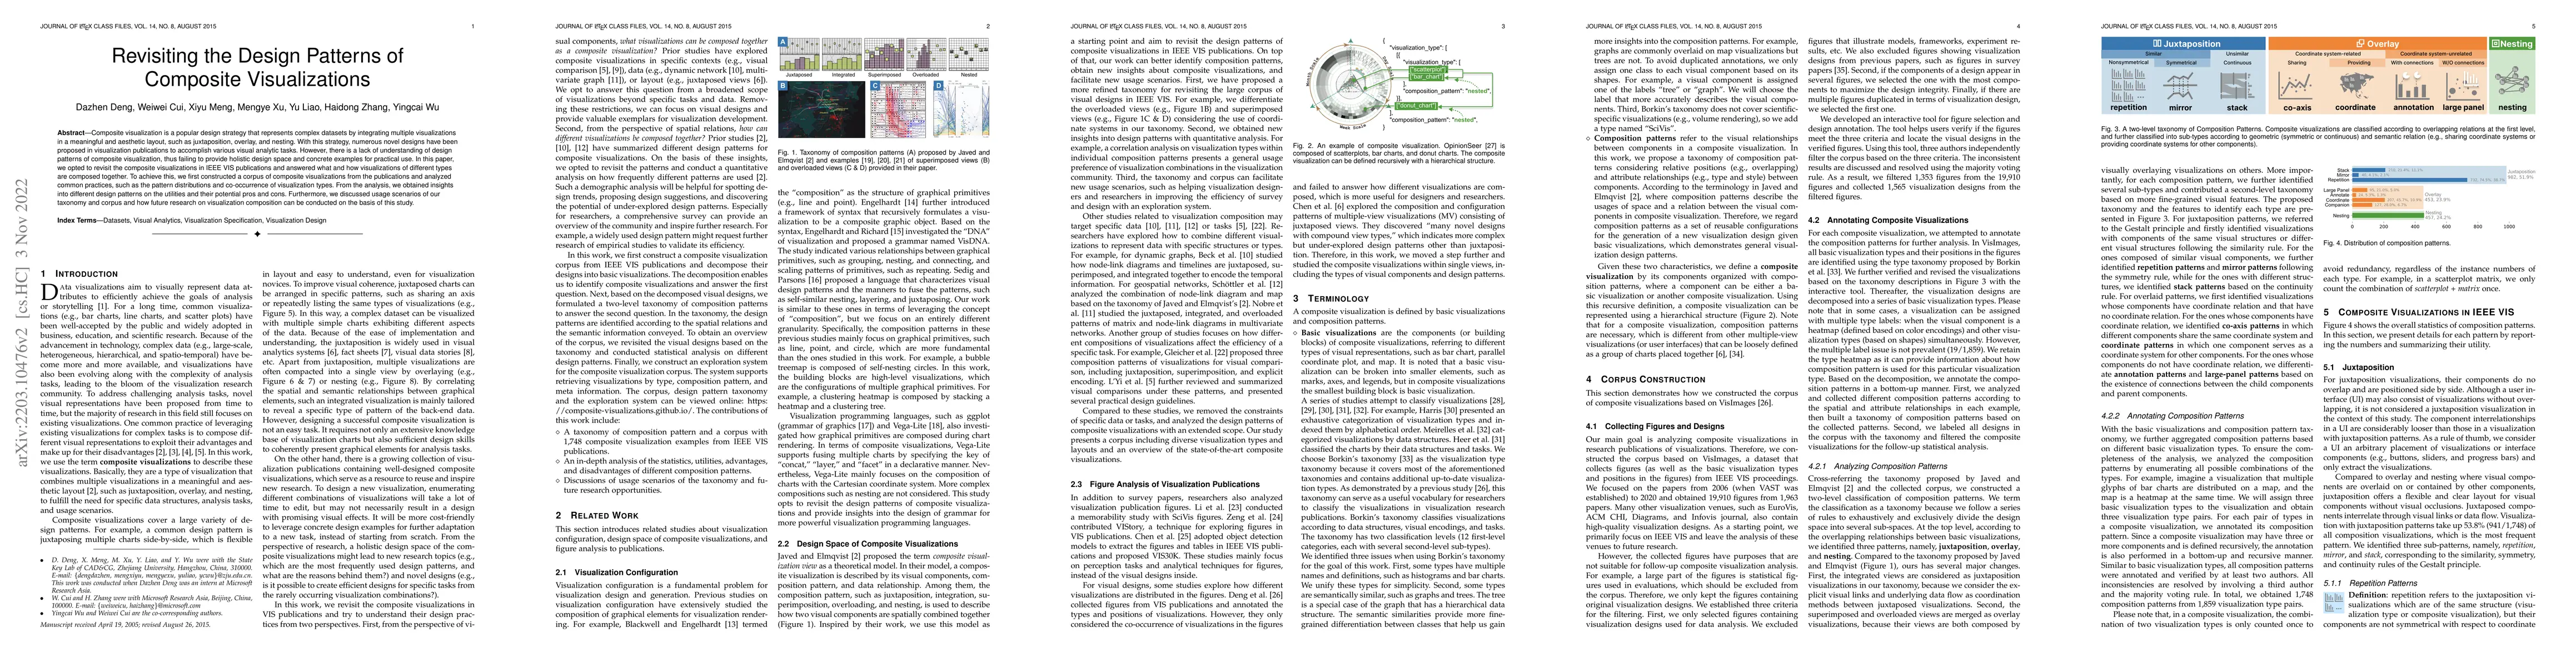
Composite visualization is a popular design strategy that represents complex datasets by integrating multiple visualizations in a meaningful and aesthetic layout, such as juxtaposition, overlay, and...
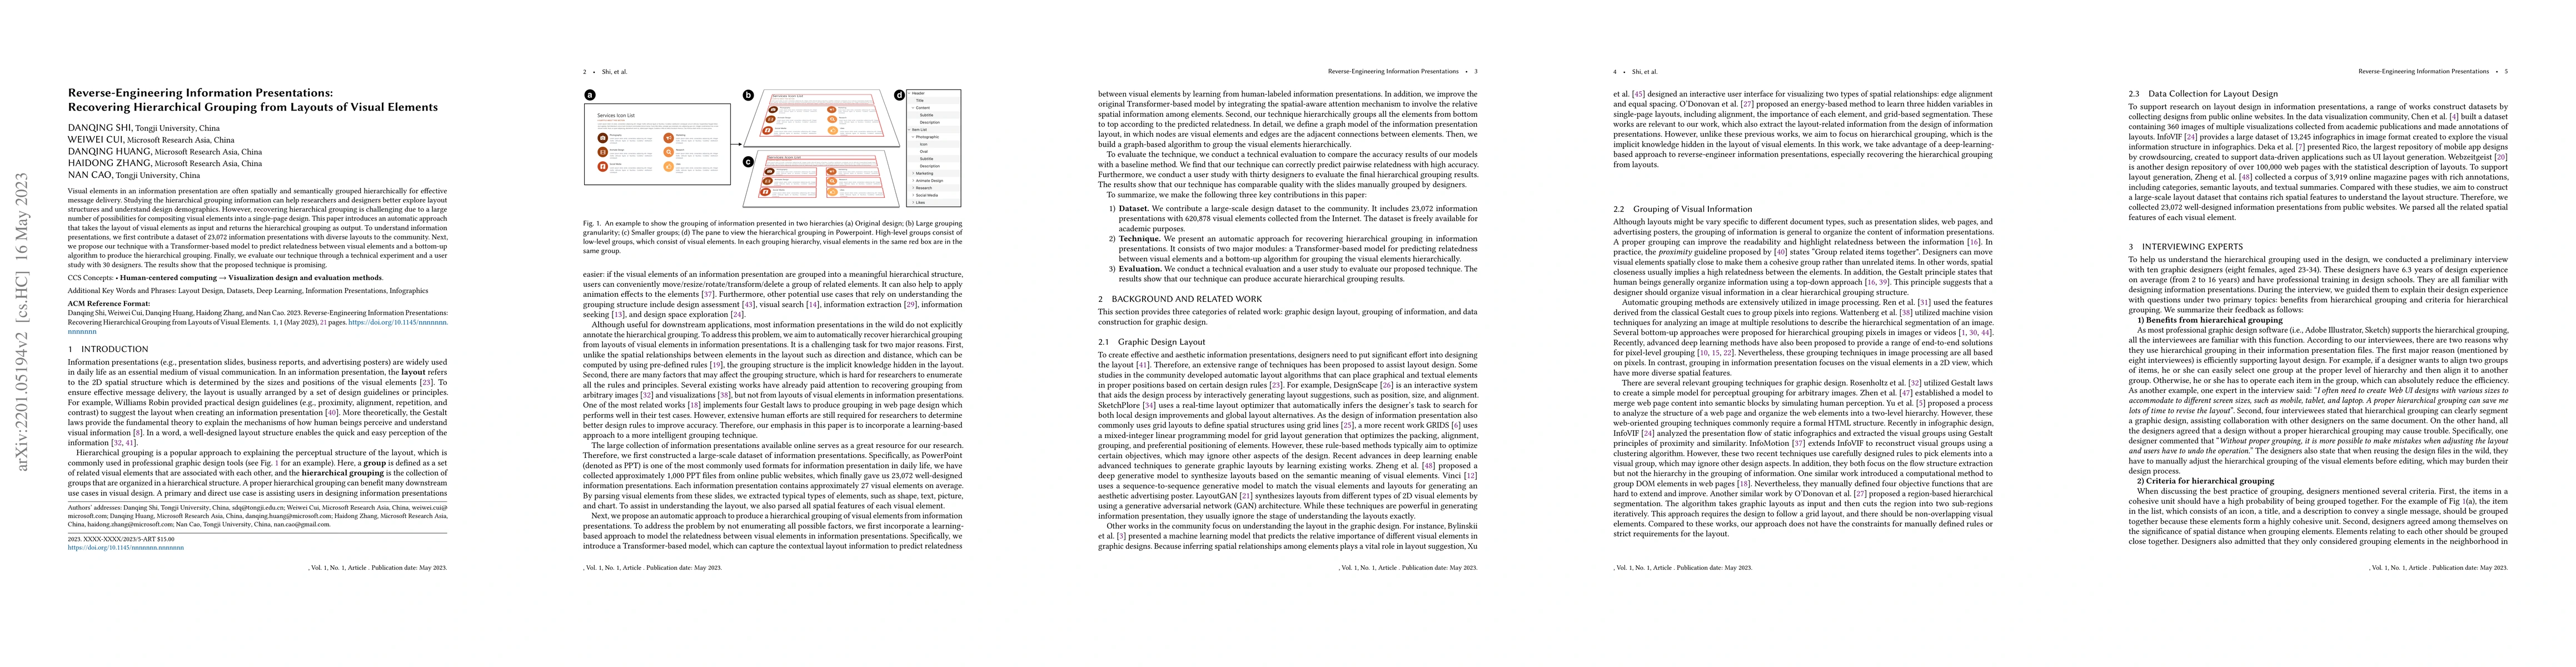
Visual elements in an information presentation are often spatially and semantically grouped hierarchically for effective message delivery. Studying the hierarchical grouping information can help res...
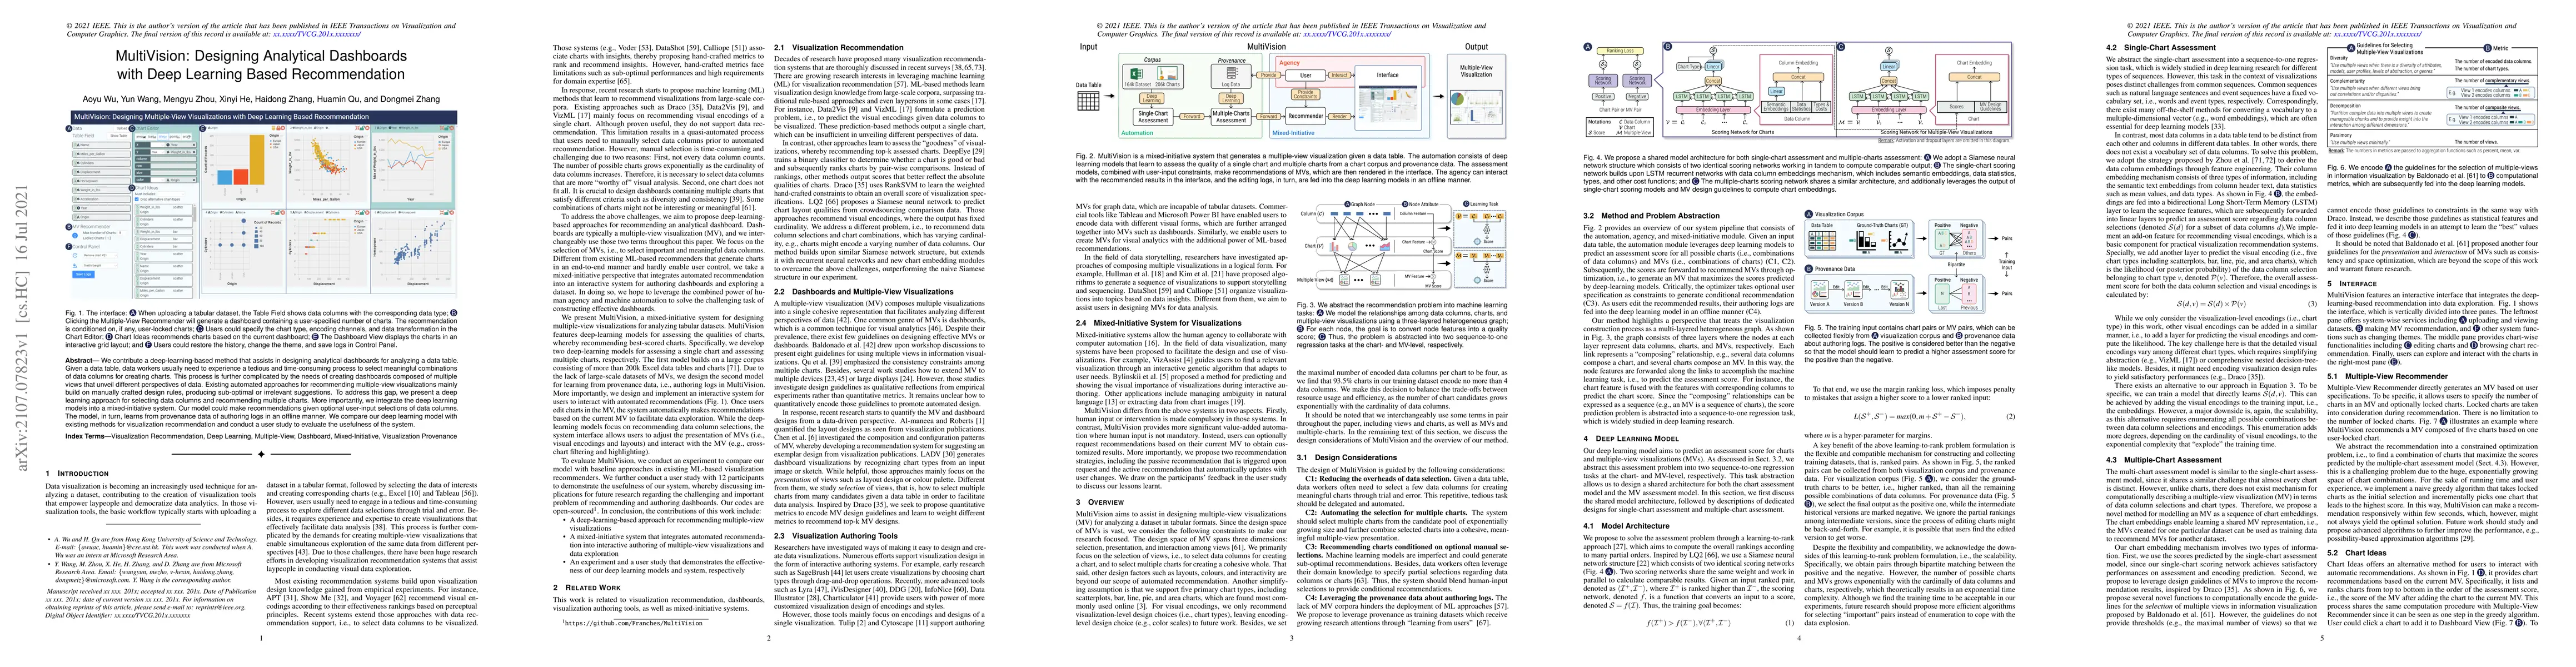
We contribute a deep-learning-based method that assists in designing analytical dashboards for analyzing a data table. Given a data table, data workers usually need to experience a tedious and time-...
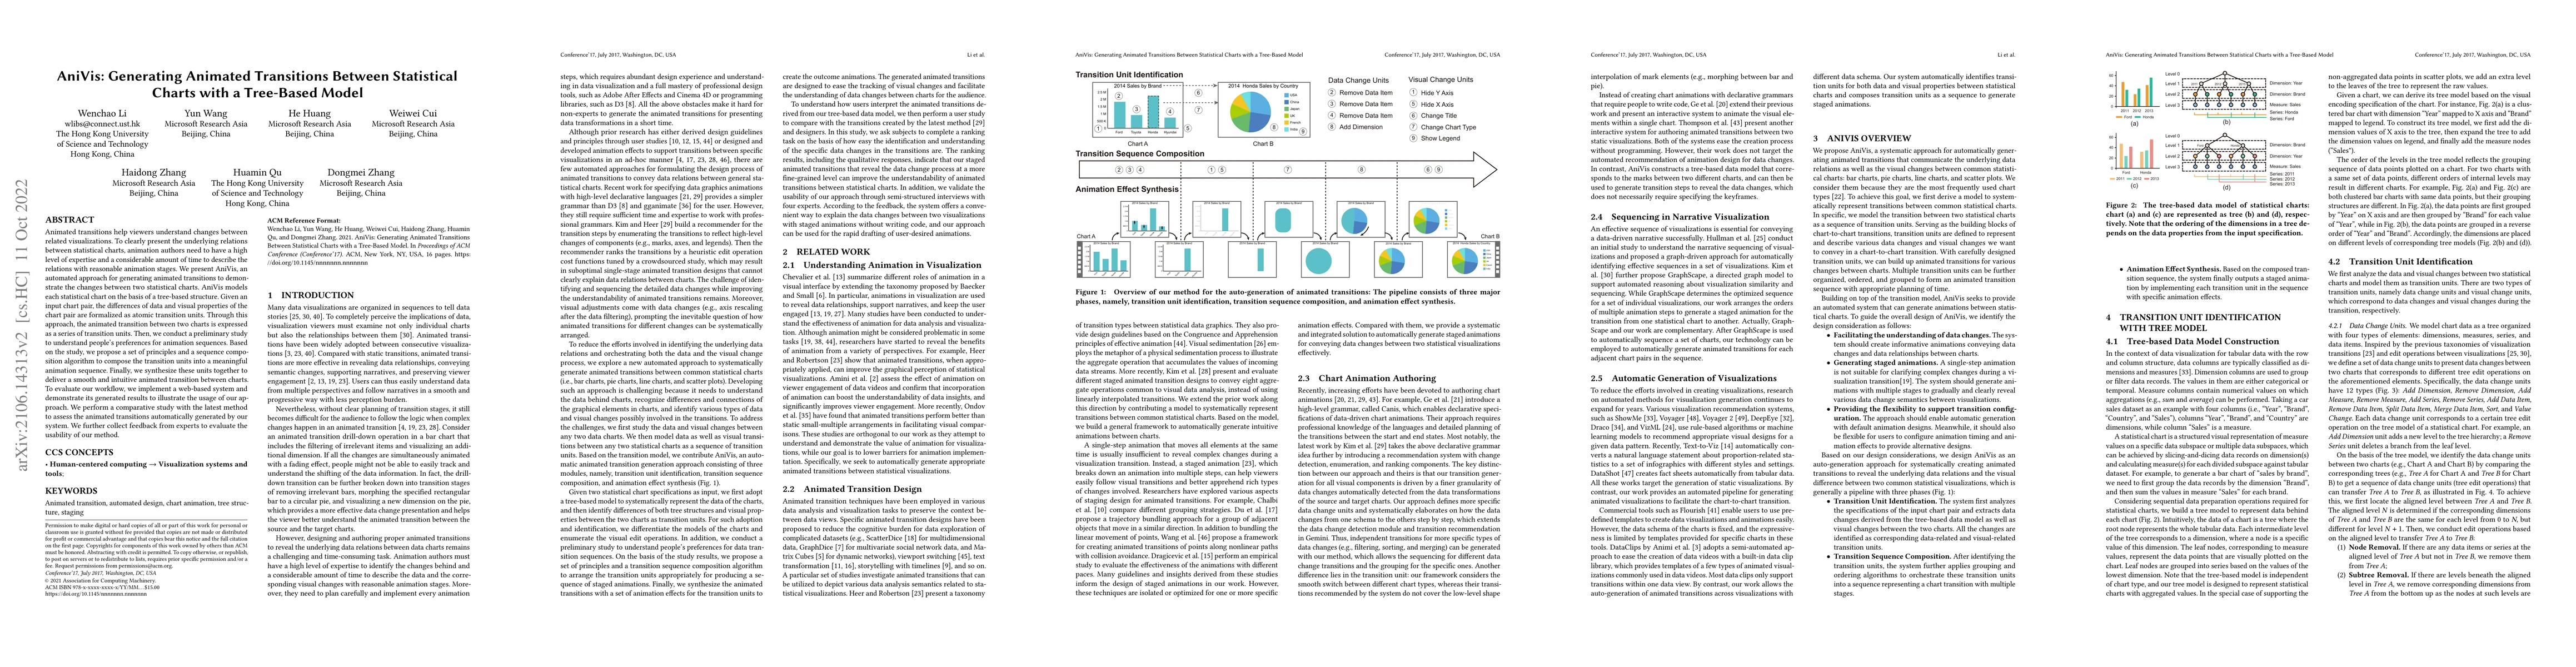
Animated transitions help viewers understand changes between related visualizations. To clearly present the underlying relations between statistical charts, animation authors need to have a high lev...
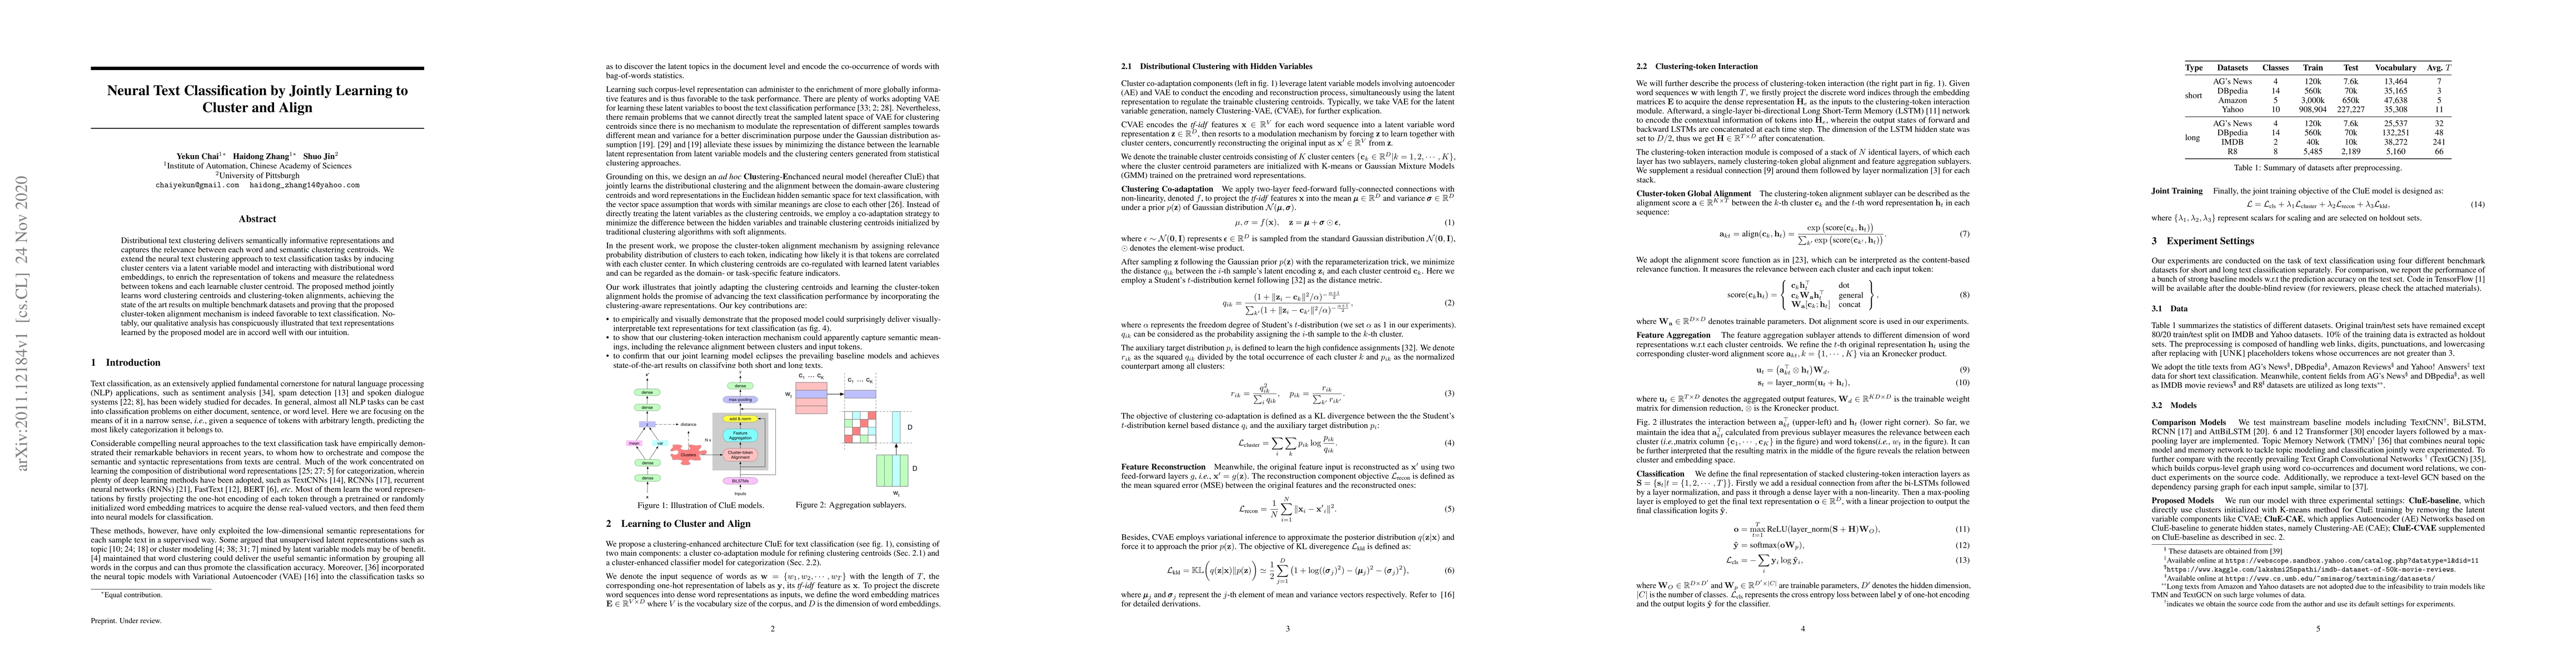
Distributional text clustering delivers semantically informative representations and captures the relevance between each word and semantic clustering centroids. We extend the neural text clustering ...
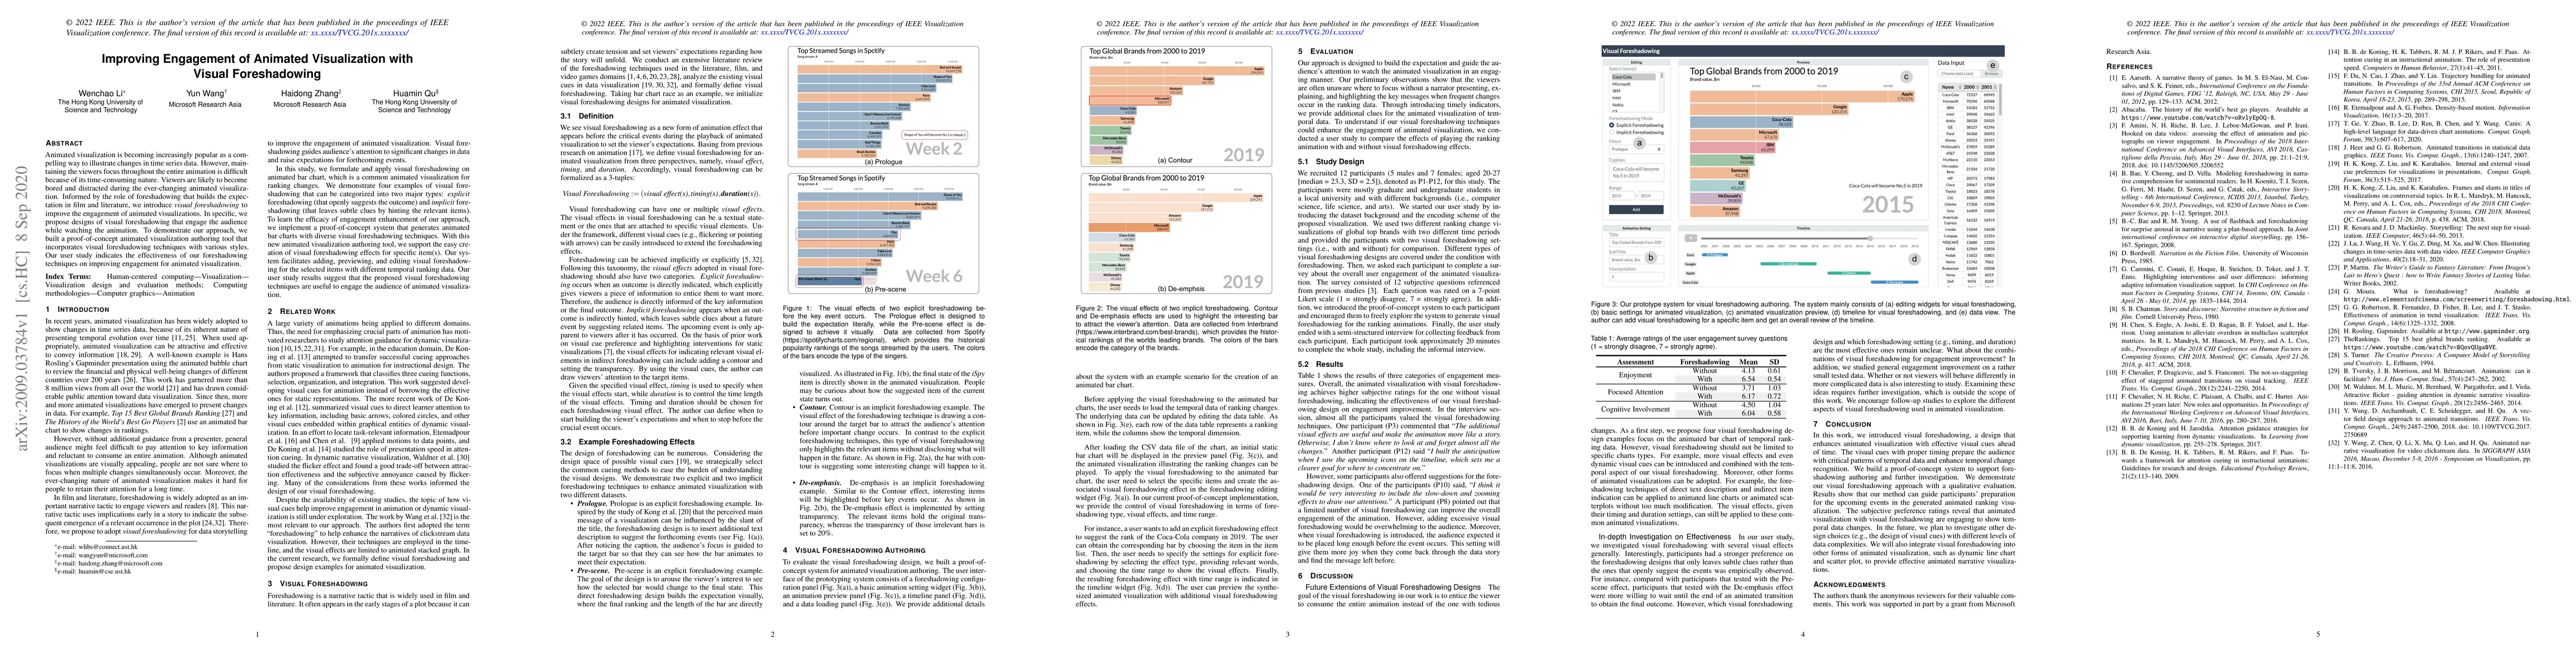
Animated visualization is becoming increasingly popular as a compelling way to illustrate changes in time series data. However, maintaining the viewer's focus throughout the entire animation is diff...
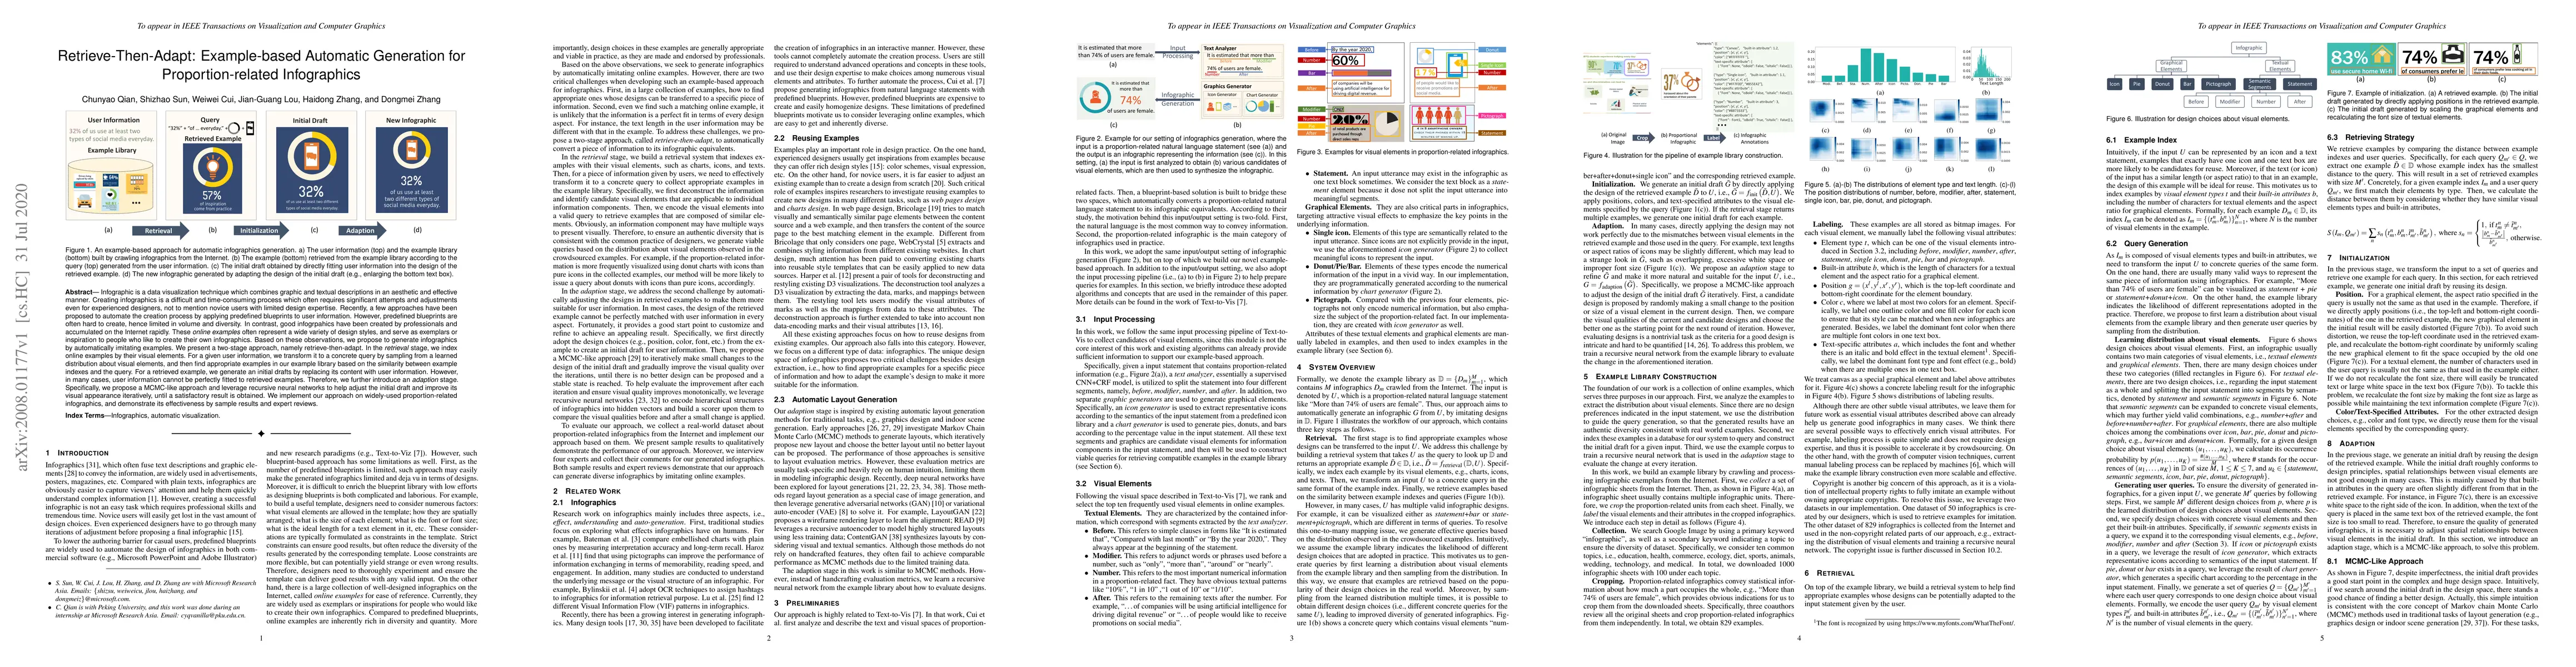
Infographic is a data visualization technique which combines graphic and textual descriptions in an aesthetic and effective manner. Creating infographics is a difficult and time-consuming process wh...
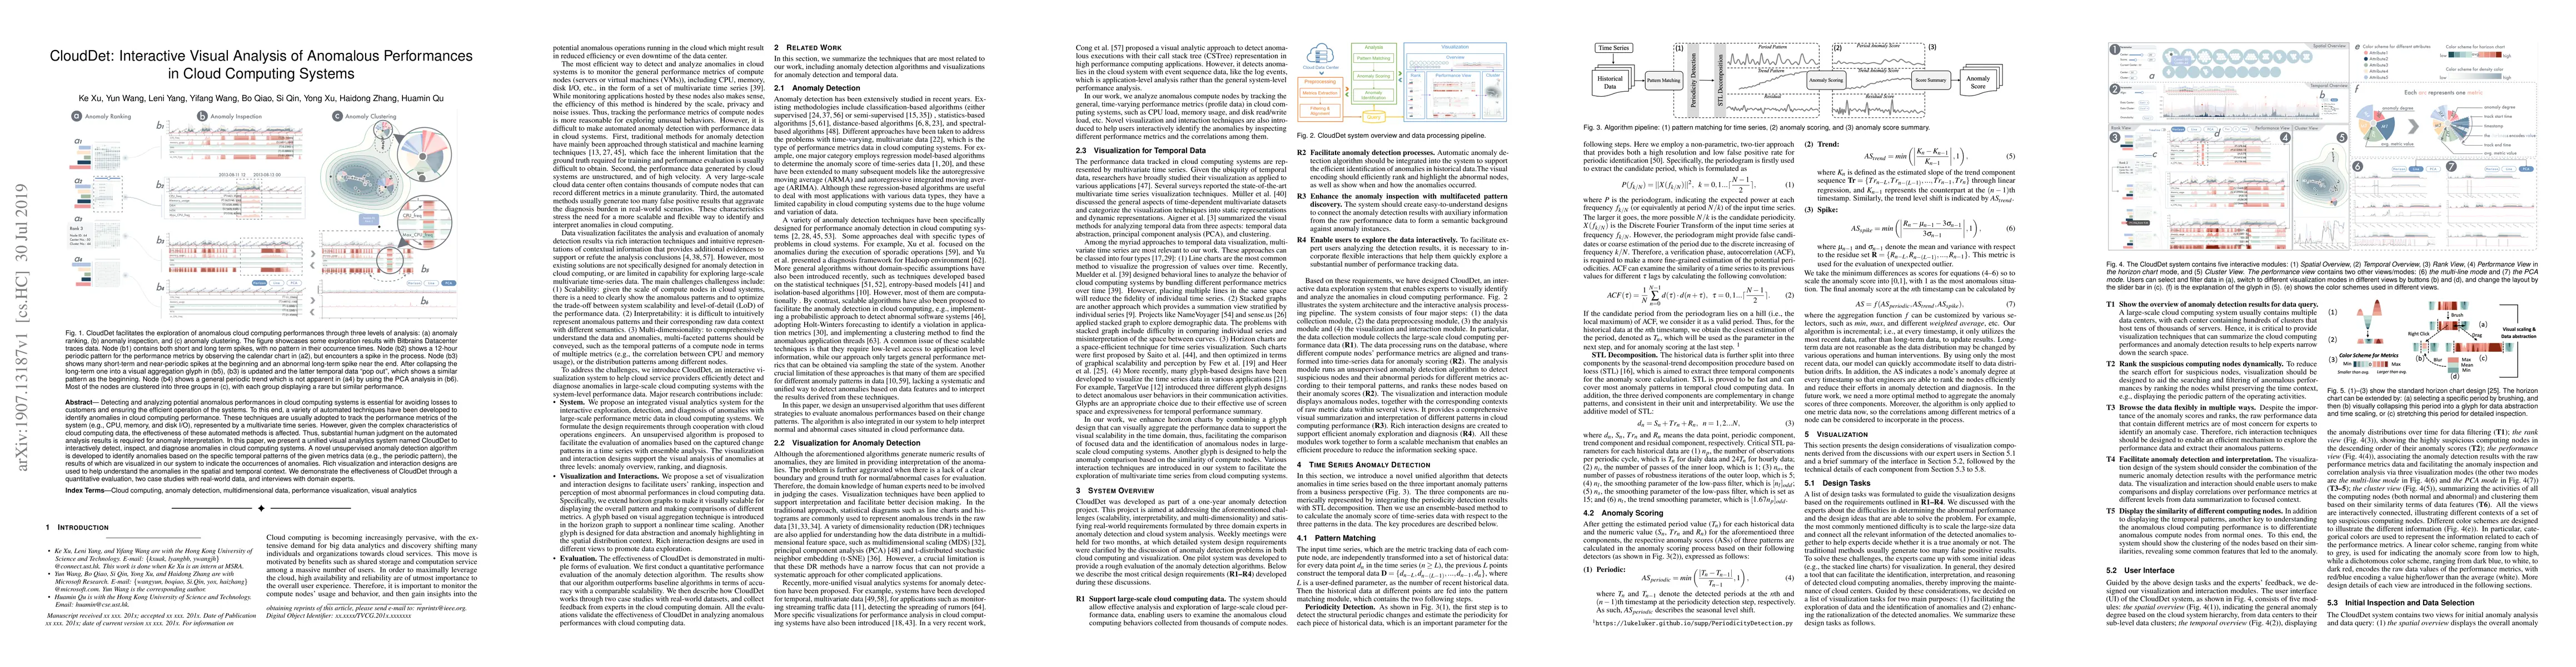
Detecting and analyzing potential anomalous performances in cloud computing systems is essential for avoiding losses to customers and ensuring the efficient operation of the systems. To this end, a ...
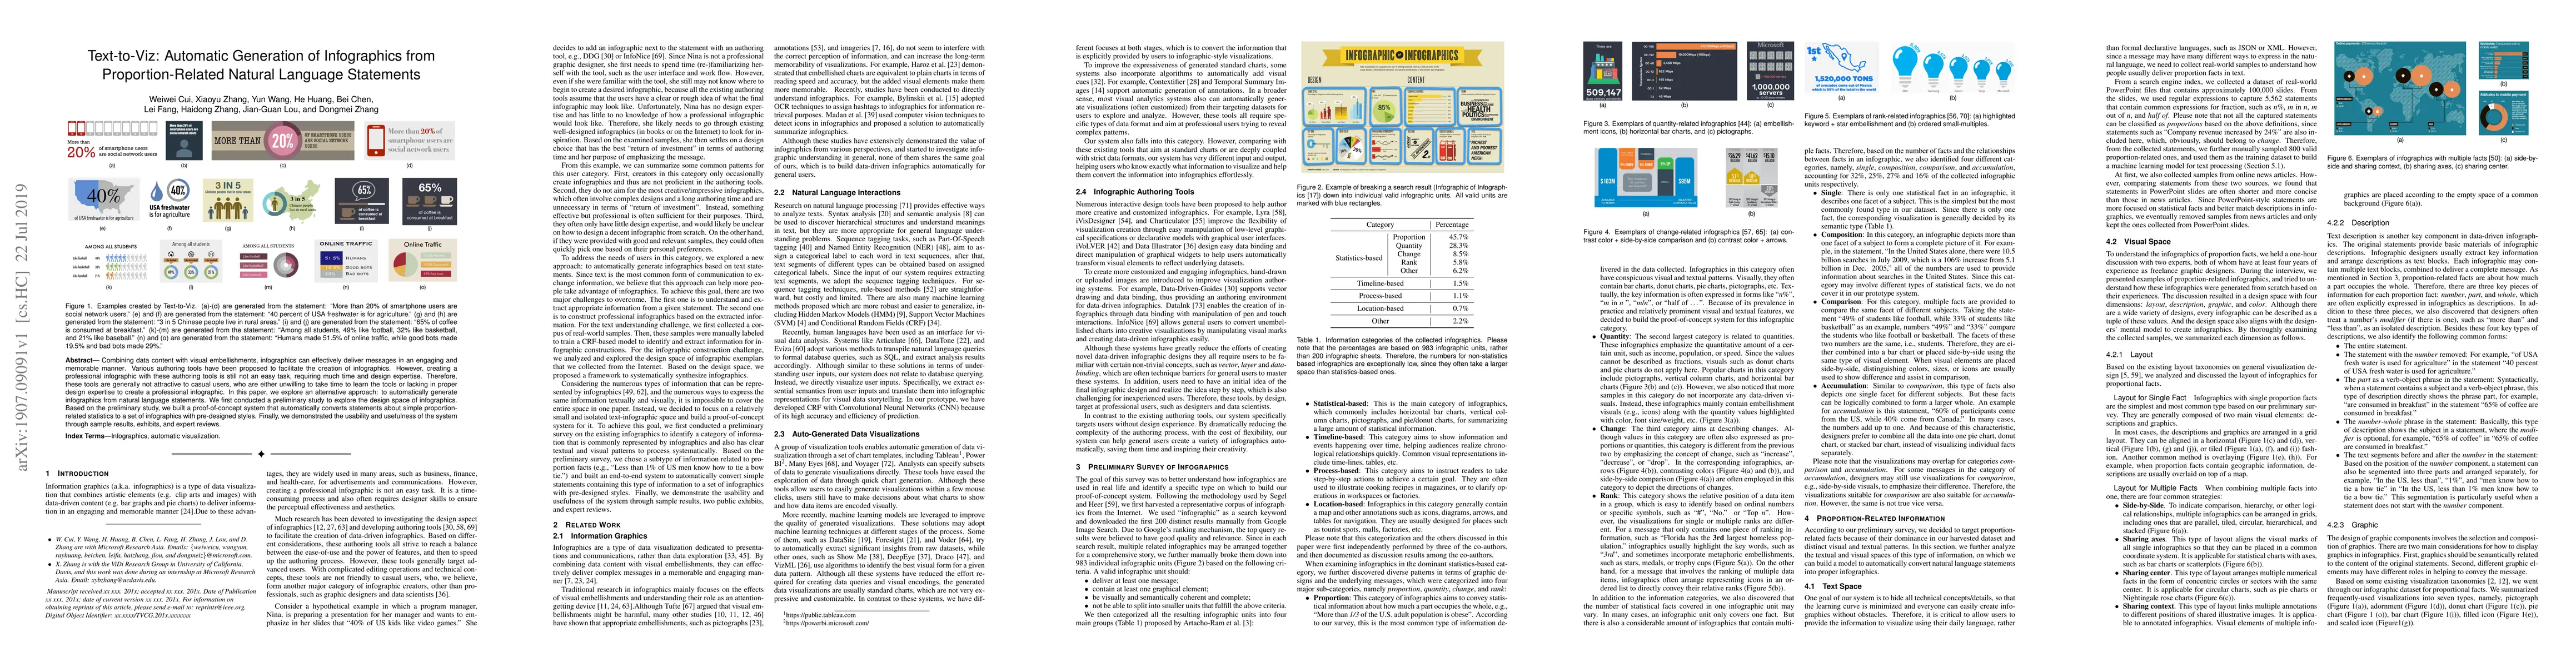
Combining data content with visual embellishments, infographics can effectively deliver messages in an engaging and memorable manner. Various authoring tools have been proposed to facilitate the cre...
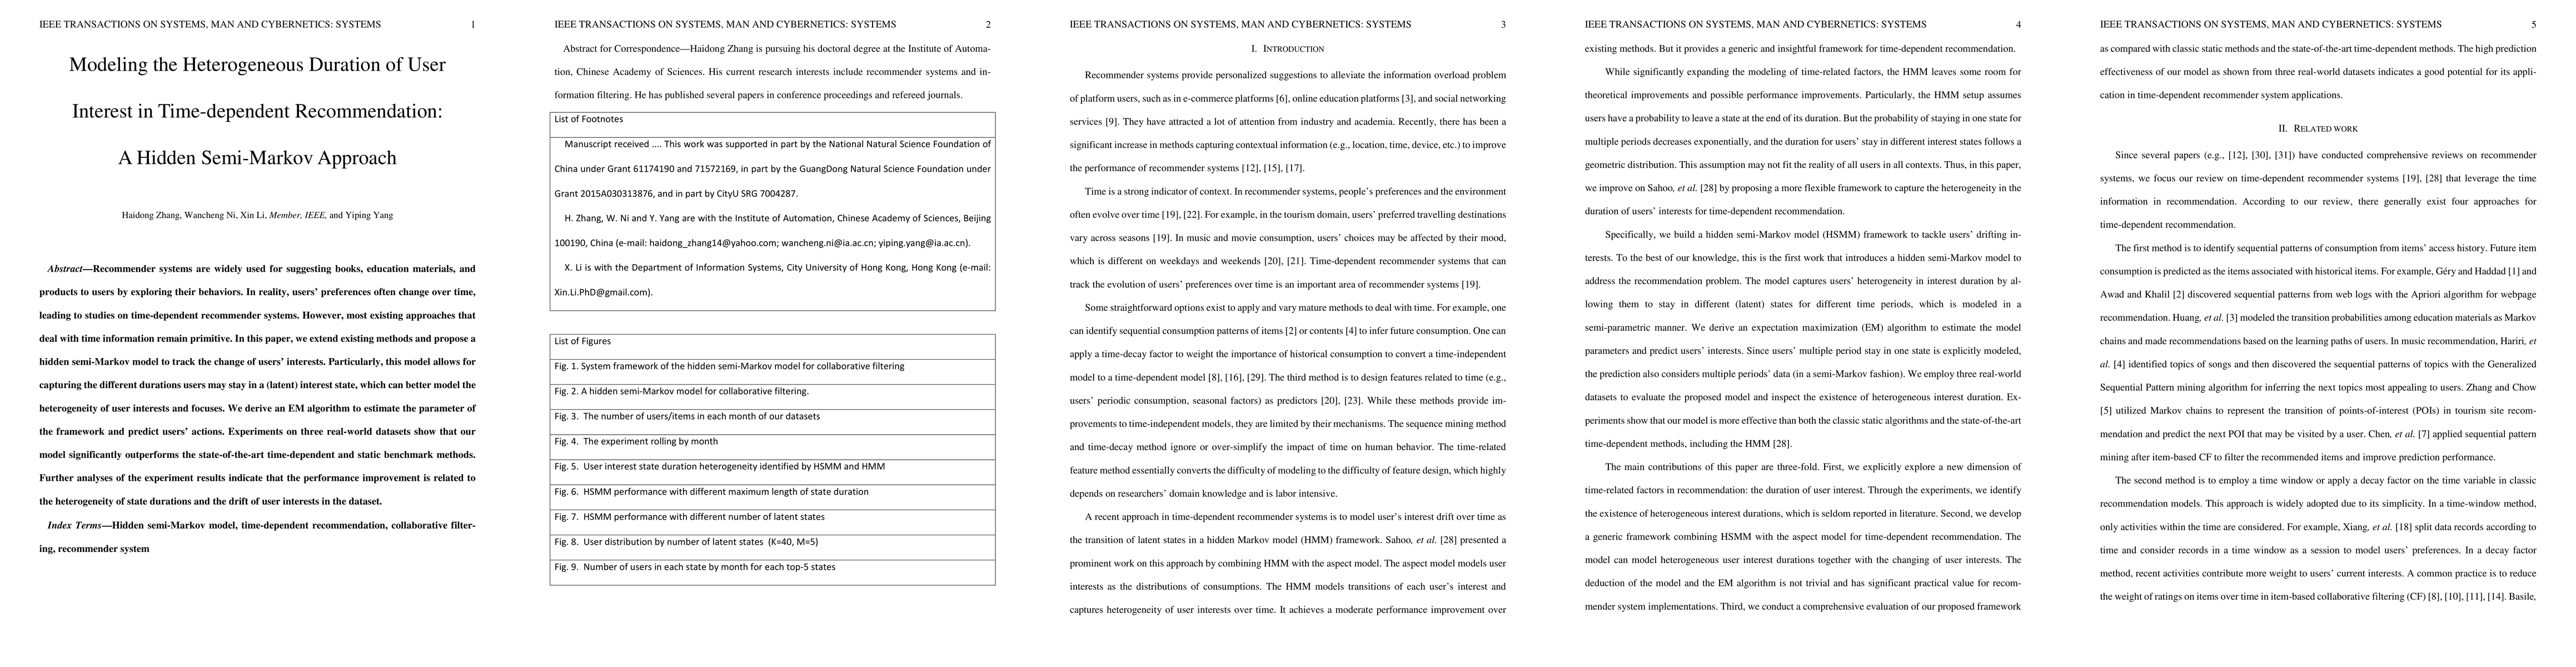
Recommender systems are widely used for suggesting books, education materials, and products to users by exploring their behaviors. In reality, users' preferences often change over time, leading to stu...
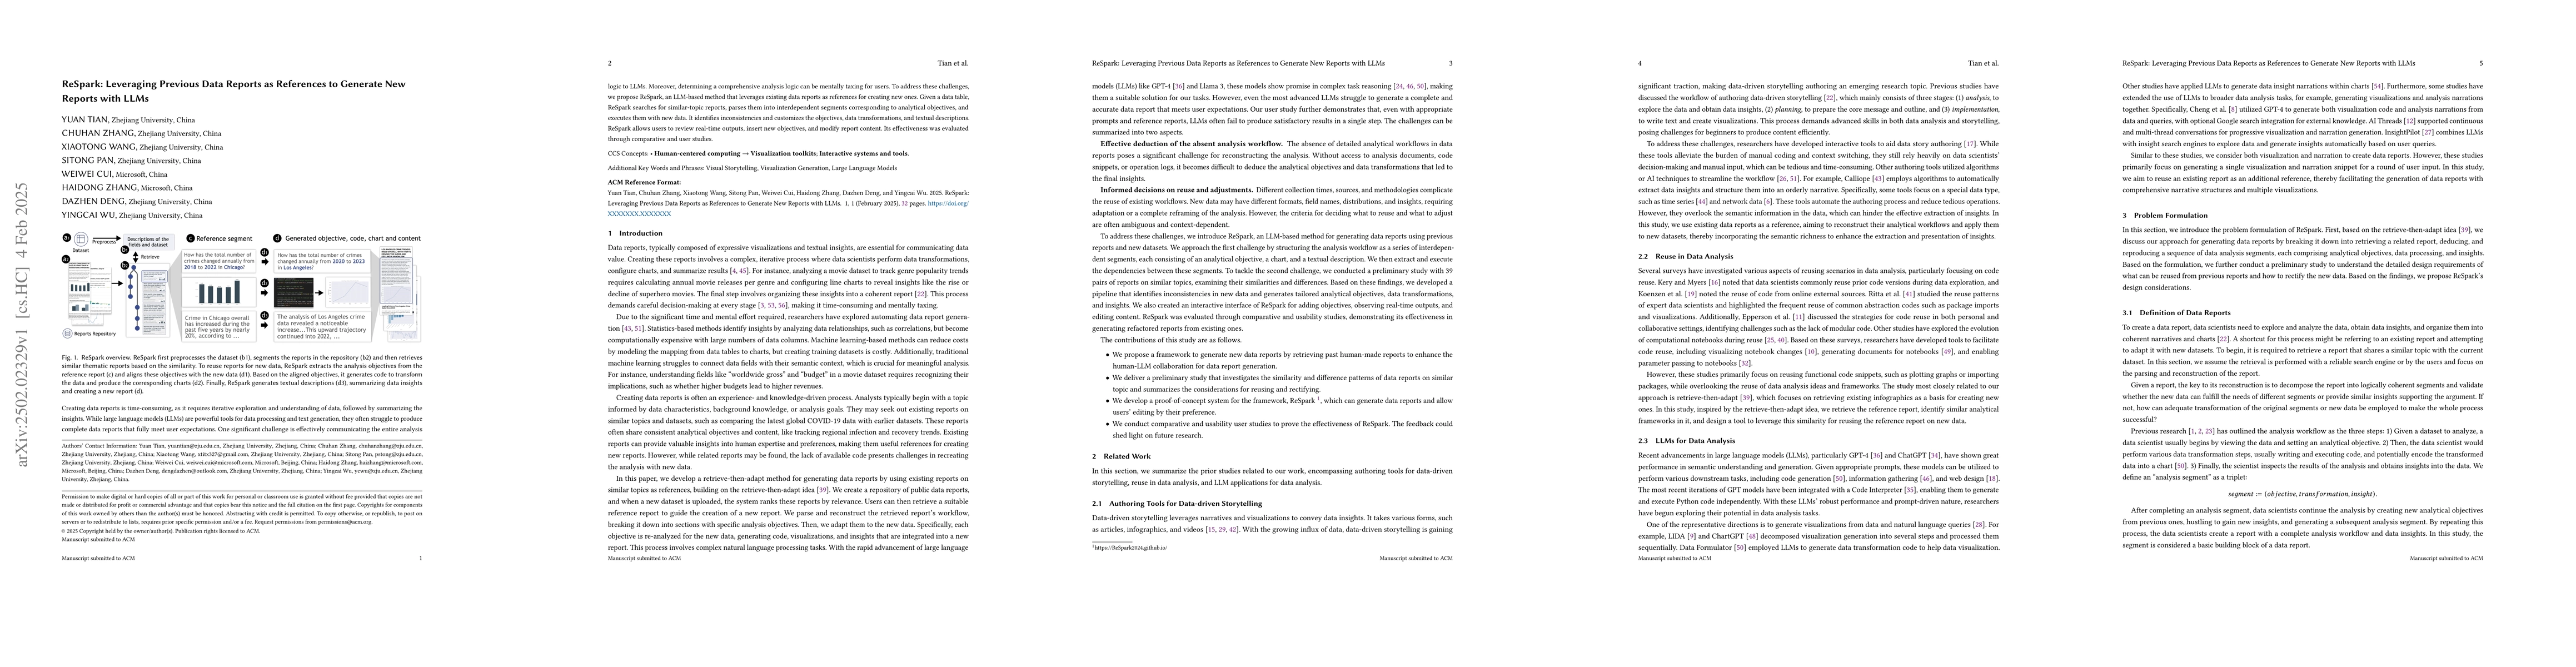
Creating data reports is time-consuming, as it requires iterative exploration and understanding of data, followed by summarizing the insights. While large language models (LLMs) are powerful tools for...
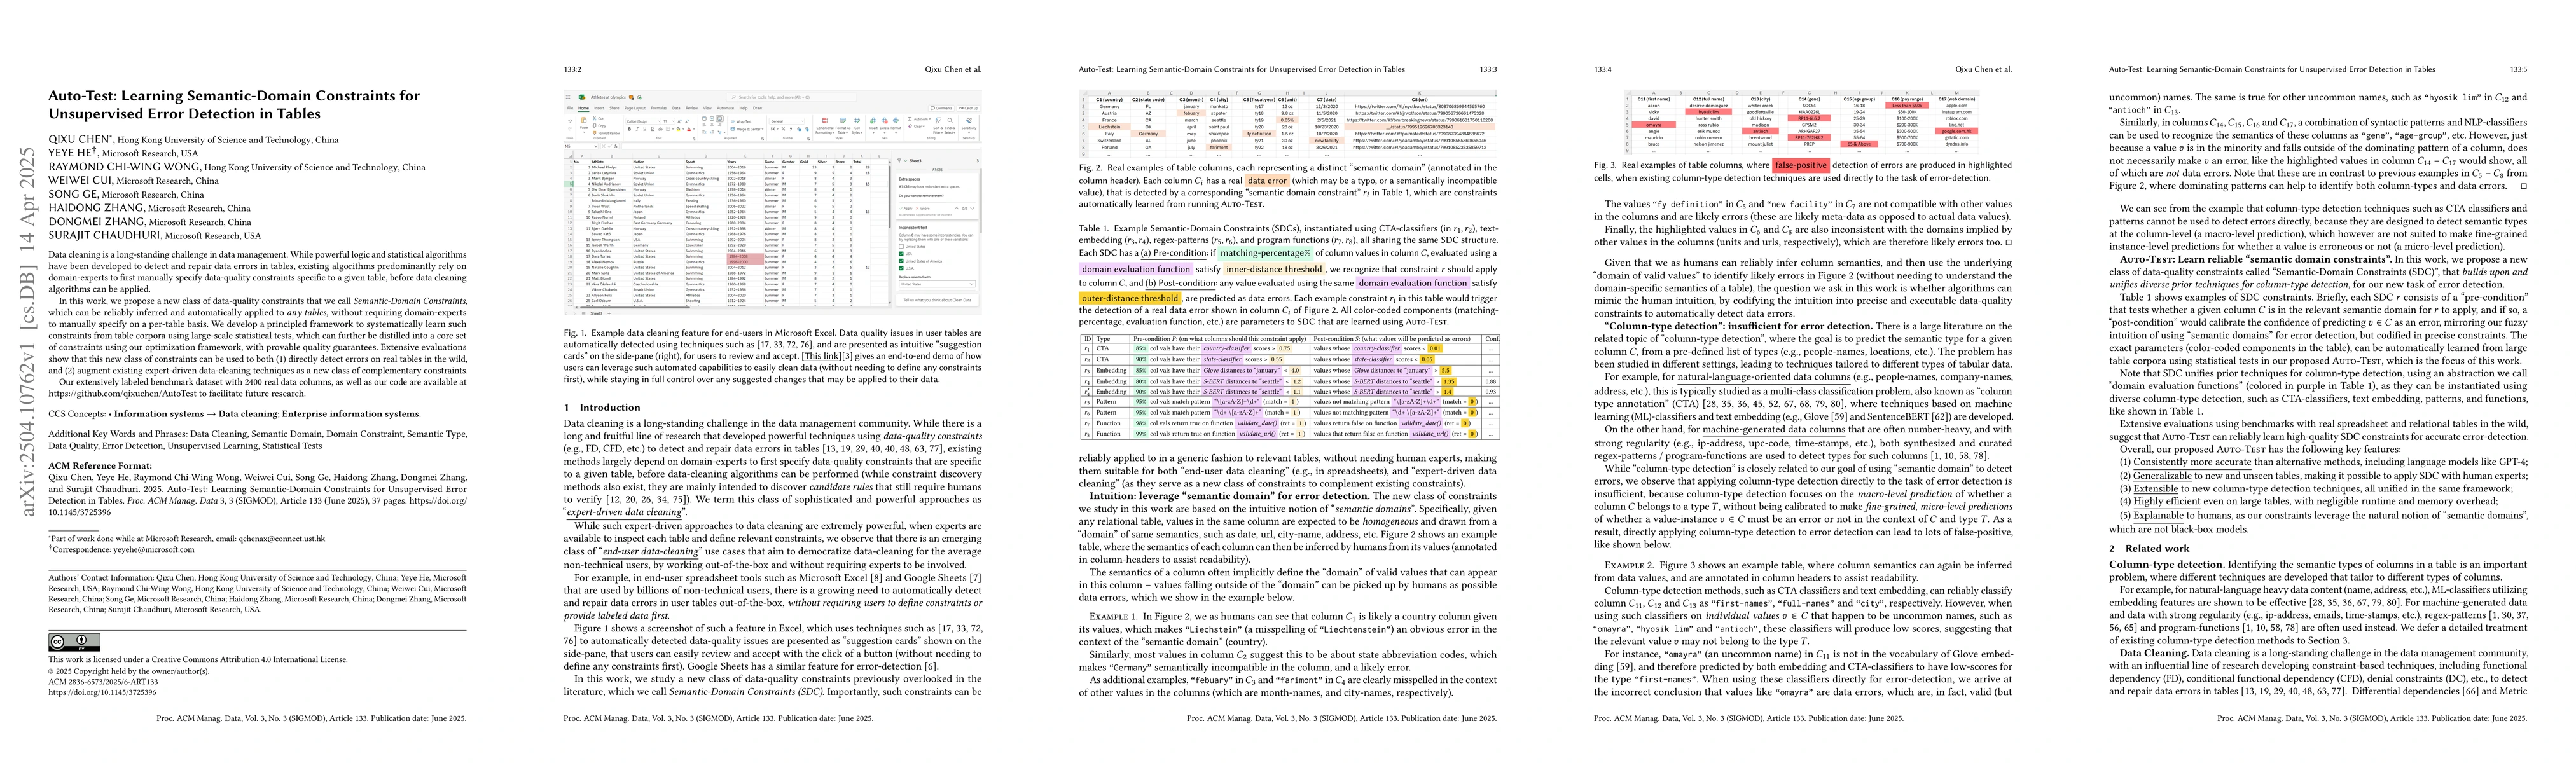
Data cleaning is a long-standing challenge in data management. While powerful logic and statistical algorithms have been developed to detect and repair data errors in tables, existing algorithms predo...
The phenomenon of group cooperation constitutes a fundamental mechanism underlying various social and biological systems. Complex networks provide a structural framework for group interactions, where ...
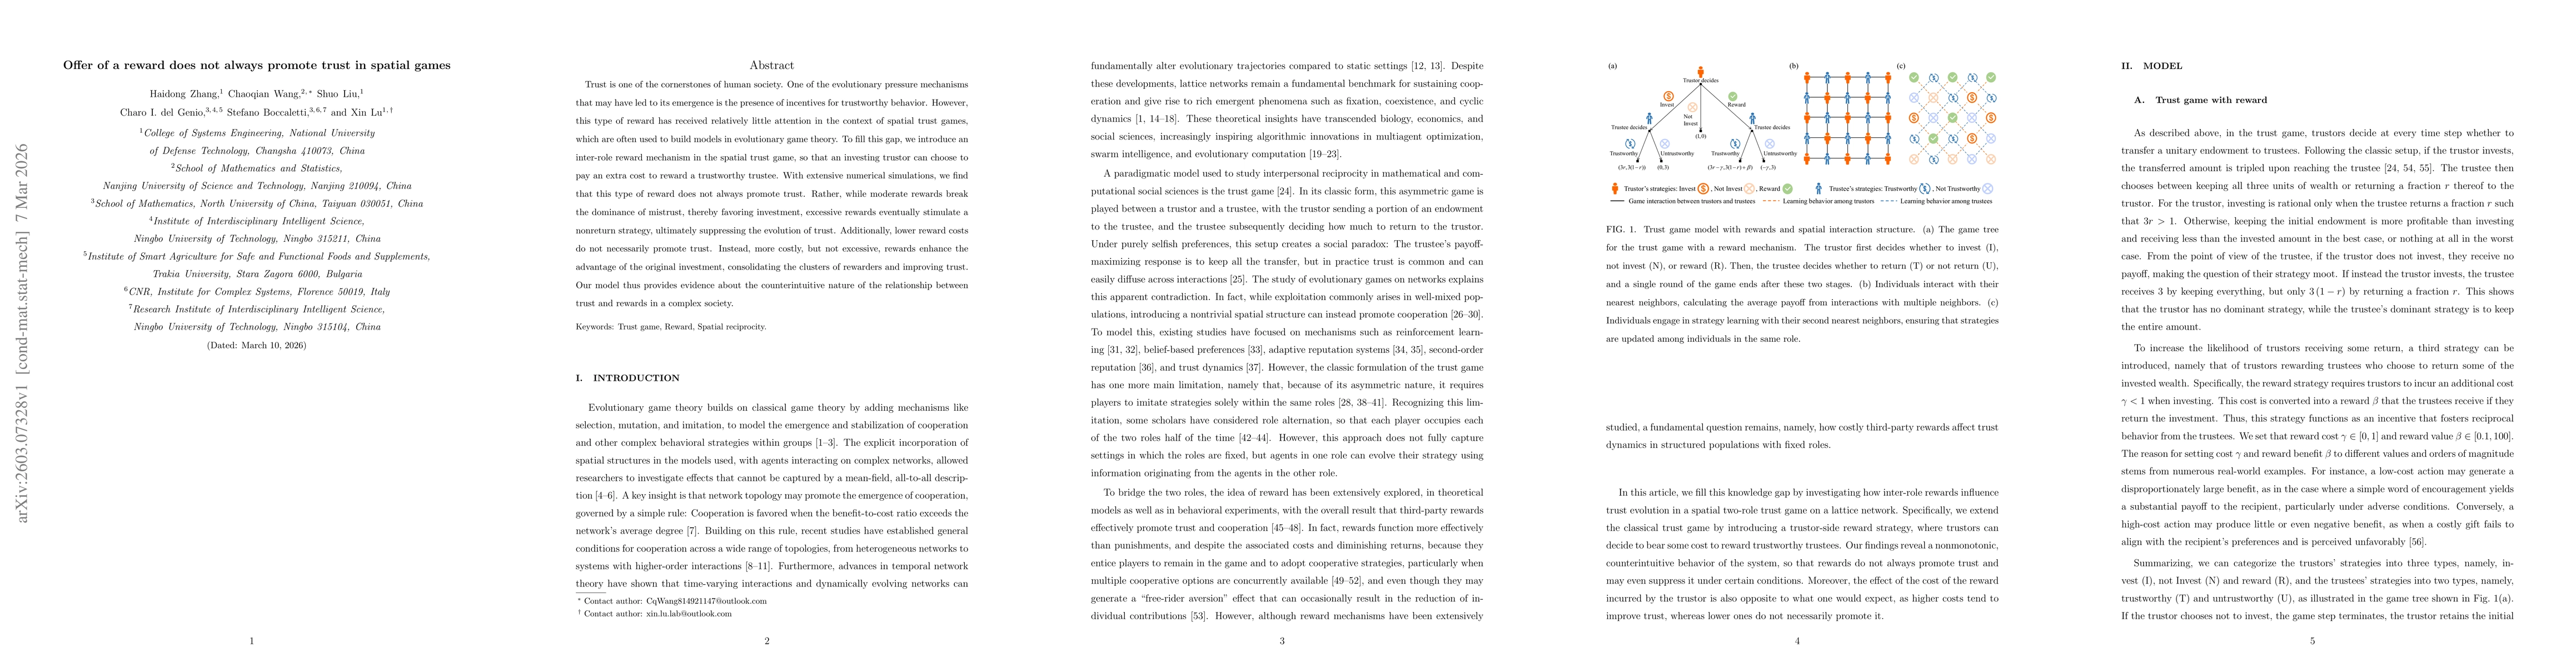
Trust is one of the cornerstones of human society. One of the evolutionary pressure mechanisms that may have led to its emergence is the presence of incentives for trustworthy behavior. However, this ...
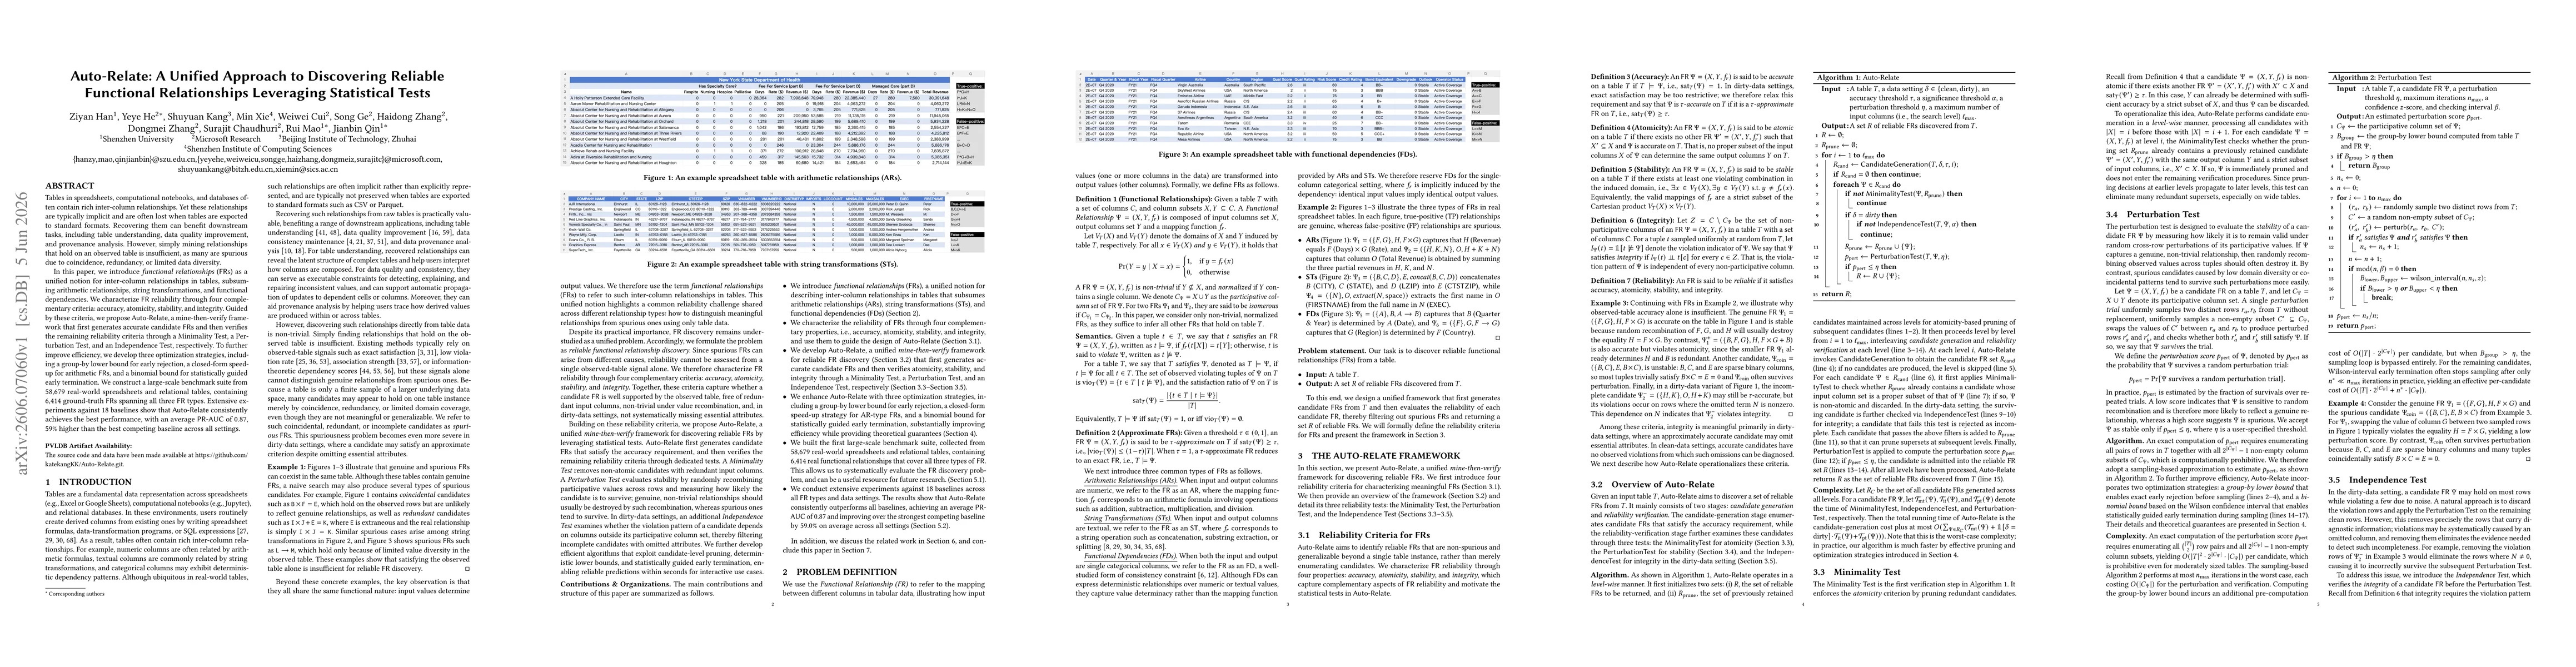
Tables in spreadsheets, computational notebooks, and databases often contain rich inter-column relationships. Yet these relationships are typically implicit and are often lost when tables are exported...