RelaQ is an interactive system designed to facilitate querying multiple time series based on specified relations, addressing pain points in current extraction methods. It supports intuitive relation specification, scalable visualization, and relation exploration, demonstrated effective in user studies.
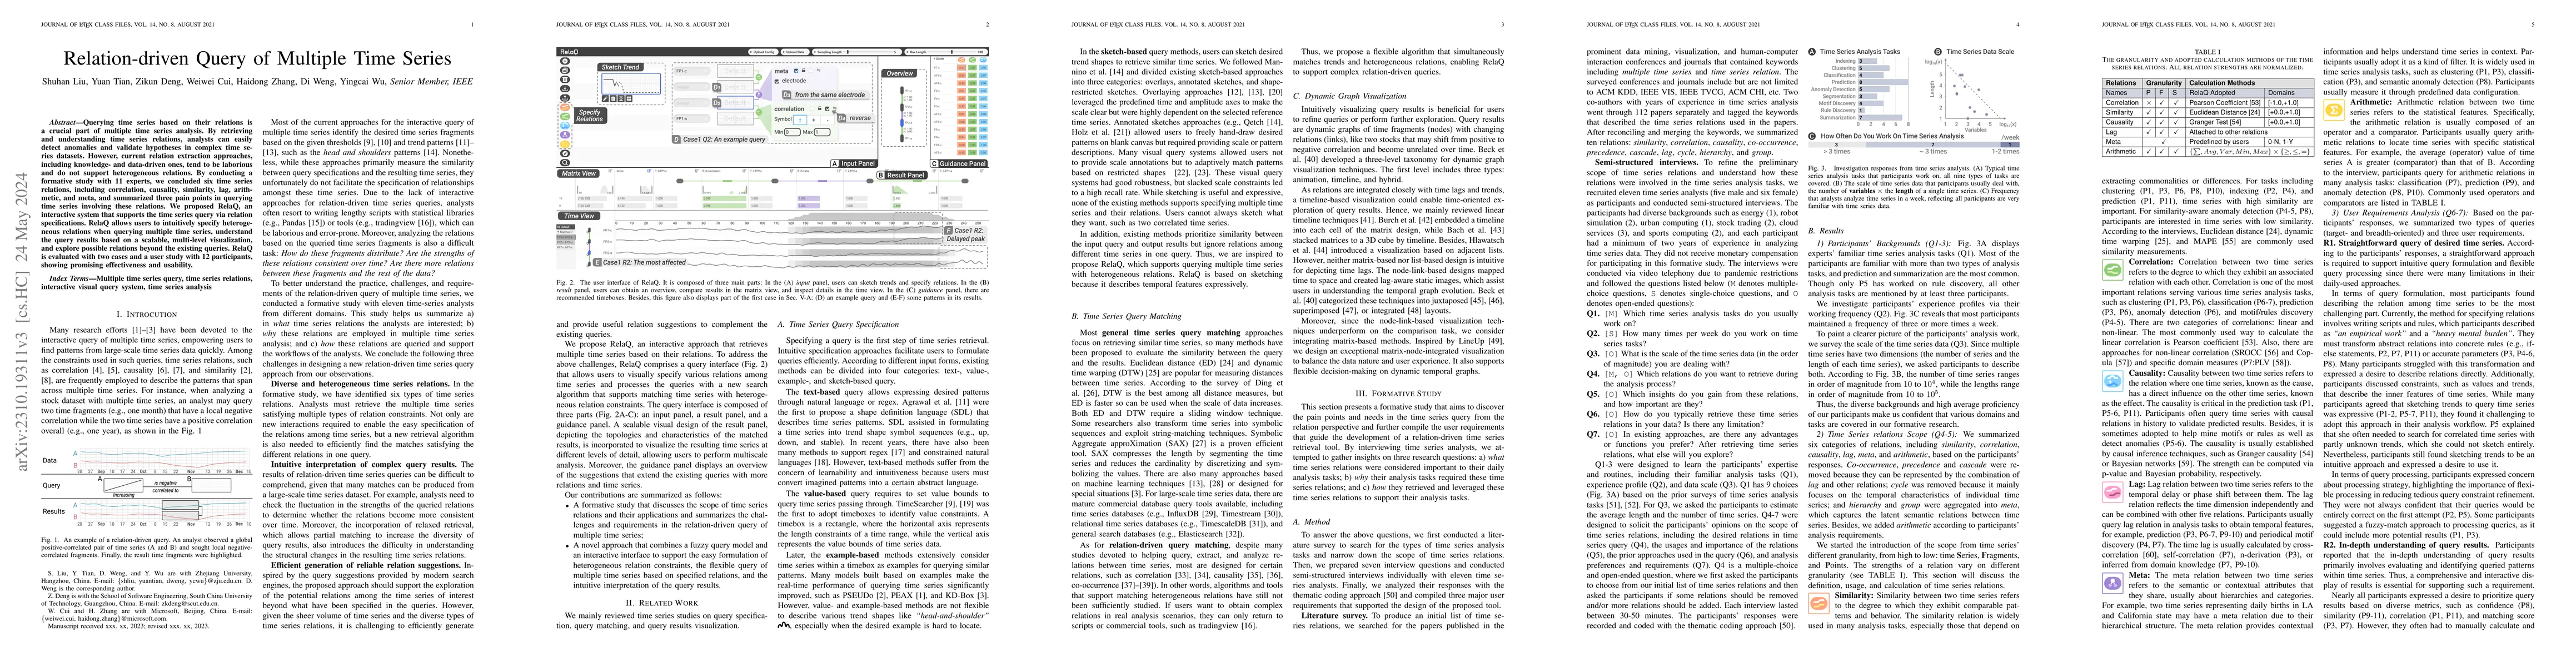
Querying time series based on their relations is a crucial part of multiple time series analysis. By retrieving and understanding time series relations, analysts can easily detect anomalies and validate hypotheses in complex time series datasets. However, current relation extraction approaches, including knowledge- and data-driven ones, tend to be laborious and do not support heterogeneous relations. By conducting a formative study with 11 experts, we concluded 6 time series relations, including correlation, causality, similarity, lag, arithmetic, and meta, and summarized three pain points in querying time series involving these relations. We proposed RelaQ, an interactive system that supports the time series query via relation specifications. RelaQ allows users to intuitively specify heterogeneous relations when querying multiple time series, understand the query results based on a scalable, multi-level visualization, and explore possible relations beyond the existing queries. RelaQ is evaluated with two use cases and a user study with 12 participants, showing promising effectiveness and usability.
Get AI-generated insights about this paper's methodology, results, and significance.
Current paper (gray), citations (green), references (blue)
No similar papers found for this research.
Title | Authors | Year | Actions |
---|---|---|---|
VIGMA: An Open-Access Framework for Visual Gait and Motion Analytics.
|
Kazi Shahrukh Omar, Shuaijie Wang, Ridhuparan Kungumaraju, T. Bhatt, Fabio Miranda
|
2025
|
View Paper |
Title | Authors | Year | Actions |
---|---|---|---|
Exploring and visualizing temporal relations in multivariate time series
|
Gota Shirato, N. Andrienko, G. Andrienko
|
2023
|
View Paper |
On Network Structural and Temporal Encodings: A Space and Time Odyssey
|
V. Filipov, Alessio Arleo, M. Bögl, S. Miksch
|
2023
|
View Paper |
Identifying, exploring, and interpreting time series shapes in multivariate time intervals
|
Gota Shirato, N. Andrienko, G. Andrienko
|
2023
|
View Paper |
Representation and analysis of time-series data via deep embedding and visual exploration
|
Yixuan Zhou, Runfeng Jiang, Hongxing Qin, Haibo Hu
|
2022
|
View Paper |
ECoalVis: Visual Analysis of Control Strategies in Coal-fired Power Plants
|
Shuhan Liu, Di Weng, Yuan Tian, Zikun Deng, Haoran Xu, Xiangyu Zhu, Honglei Yin, Xianyuan Zhan, Yingnian Wu
|
2022
|
View Paper |
DOMINO: Visual Causal Reasoning With Time-Dependent Phenomena
|
Jun Wang, Klaus Mueller
|
2022
|
View Paper |
LargeNetVis: Visual Exploration of Large Temporal Networks Based on Community Taxonomies
|
Claudio D. G. Linhares, Jean R. Ponciano, D. S. Pedro, Luis E C Rocha, A. J. Traina, Jorge Poco
|
2022
|
View Paper |
TypeScript
|
Sufyan bin Uzayr
|
2022
|
View Paper |
Compass: Towards Better Causal Analysis of Urban Time Series
|
Zikun Deng, Di Weng, Xiao Xie, Jie Bao, Yu Zheng, Mingliang Xu, Wei Chen, Yingcai Wu
|
2021
|
View Paper |
IRVINE: A Design Study on Analyzing Correlation Patterns of Electrical Engines
|
Joscha Eirich, Jakob Bonart, Dominik Jackle, M. Sedlmair, Ute Schmid, K. Fischbach, Tobias Schreck, J. Bernard
|
2021
|
View Paper |
KD-Box: Line-segment-based KD-tree for Interactive Exploration of Large-scale Time-Series Data
|
Yueling Zhao, Jian Zhang, Chi-Wing Fu, Mingliang Xu, Dominik Moritz, Yunhai Wang
|
2021
|
View Paper |
Redux
|
Konstantine Pinteris
|
2021
|
View Paper |
PSEUDo: Interactive Pattern Search in Multivariate Time Series with Locality-Sensitive Hashing and Relevance Feedback
|
Yuncong Yu, Dylan Kruyff, Jiao Jiao, Tim Becker, M. Behrisch
|
2021
|
View Paper |
Qute: Query by Text Search for Time Series Data
|
Shima Imani, S. Alaee, Eamonn J. Keogh
|
2020
|
View Paper |
REACT
|
Li Xiong, Cyrus Shahabi, Yanan Da, Ritesh Ahuja, Vicki Hertzberg, Lance Waller, Xiaoqian Jiang, Amy Franklin
|
2020
|
View Paper |
Visual Causality Analysis of Event Sequence Data
|
Zhuochen Jin, Shunan Guo, Nan Chen, D. Weiskopf, D. Gotz, Nan Cao
|
2020
|
View Paper |
Multiscale Snapshots: Visual Analysis of Temporal Summaries in Dynamic Graphs
|
E. Cakmak, U. Schlegel, Dominik Jäckle, D. Keim, Tobias Schreck
|
2020
|
View Paper |
Sketch-Based Fast and Accurate Querying of Time Series Using Parameter-Sharing LSTM Networks
|
Chaoran Fan, K. Matkovič, H. Hauser
|
2020
|
View Paper |
A Comparison of Visualizations for Identifying Correlation over Space and Time
|
Vanessa Peña Araya, Emmanuel Pietriga, A. Bezerianos
|
2019
|
View Paper |
Peax: Interactive Visual Pattern Search in Sequential Data Using Unsupervised Deep Representation Learning
|
Fritz Lekschas, Brant Peterson, D. Haehn, Eric J. Ma, Nils Gehlenborg, H. Pfister
|
2019
|
View Paper |
A Visual Analytics Framework for Spatiotemporal Trade Network Analysis
|
Hong Wang, Yafeng Lu, S. Shutters, Michael Steptoe, Feng Wang, Steven T. Landis, Ross Maciejewski
|
2019
|
View Paper |
Comparing Similarity Perception in Time Series Visualizations
|
Anna Gogolou, Theophanis Tsandilas, Themis Palpanas, A. Bezerianos
|
2019
|
View Paper |
ShapeSearch: A Flexible and Efficient System for Shape-based Exploration of Trendlines
|
Tarique Siddiqui, Zesheng Wang, Paul Luh, Karrie Karahalios, Aditya G. Parameswaran
|
2018
|
View Paper |
A Visual Analytics Framework for Identifying Topic Drivers in Media Events
|
Yafeng Lu, Hong Wang, Steven T. Landis, Ross Maciejewski
|
2018
|
View Paper |
Expressive Time Series Querying with Hand-Drawn Scale-Free Sketches
|
M. Mannino, A. Abouzeid
|
2018
|
View Paper |
A survey on time series data mining
|
Amin Fakhrazari, H. Vakilzadian
|
2017
|
View Paper |
A Taxonomy and Survey of Dynamic Graph Visualization
|
Fabian Beck, Michael Burch, S. Diehl, D. Weiskopf
|
2017
|
View Paper |
Shape grammar extraction for efficient query-by-sketch pattern matching in long time series
|
P. Muthumanickam, K. Vrotsou, M. Cooper, J. Johansson
|
2016
|
View Paper |
The semantics of sketch: Flexibility in visual query systems for time series data
|
M. Correll, Michael Gleicher
|
2016
|
View Paper |
Voyager: Exploratory Analysis via Faceted Browsing of Visualization Recommendations
|
Kanit Wongsuphasawat, Dominik Moritz, Anushka Anand, J. Mackinlay, Bill Howe, Jeffrey Heer
|
2016
|
View Paper |
1.5D Egocentric Dynamic Network Visualization
|
Lei Shi, Chen Wang, Zhen Wen, Huamin Qu, Chuang Lin, Qi Liao
|
2015
|
View Paper |
Visual Adjacency Lists for Dynamic Graphs
|
Marcel Hlawatsch, Michael Burch, D. Weiskopf
|
2014
|
View Paper |
Visualizing dynamic networks with matrix cubes
|
Benjamin Bach, Emmanuel Pietriga, Jean-Daniel Fekete
|
2014
|
View Paper |
LineUp: Visual Analysis of Multi-Attribute Rankings
|
S. Gratzl, A. Lex, Nils Gehlenborg, H. Pfister, M. Streit
|
2013
|
View Paper |
StoryFlow: Tracking the Evolution of Stories
|
Shixia Liu, Yingcai Wu, Enxun Wei, Mengchen Liu, Yang Liu
|
2013
|
View Paper |
A Matrix-Based Visualization for Exploring Dynamic Compound Digraphs
|
Michael Burch, Benjamin Schmidt, D. Weiskopf
|
2013
|
View Paper |
Parallel Edge Splatting for Scalable Dynamic Graph Visualization
|
Michael Burch, Corinna Vehlow, Fabian Beck, S. Diehl, D. Weiskopf
|
2011
|
View Paper |
A review of EEG, ERP, and neuroimaging studies of creativity and insight.
|
Arne Dietrich, Riam Kanso
|
2010
|
View Paper |
Visualization and Exploration of Temporal Trend Relationships in Multivariate Time-Varying Data
|
Teng-Yok Lee, Han-Wei Shen
|
2009
|
View Paper |
PANDAS
|
Donald L. Gilbert, Roger Kurlan
|
2009
|
View Paper |
Relaxed selection techniques for querying time-series graphs
|
Christian Holz, Steven K. Feiner
|
2009
|
View Paper |
The Factor Structure of the System Usability Scale
|
James R. Lewis, Jeff Sauro
|
2009
|
View Paper |
Visualizing the Evolution of Compound Digraphs with TimeArcTrees
|
Martin Greilich, Michael Burch, S. Diehl
|
2009
|
View Paper |
Querying and mining of time series data: experimental comparison of representations and distance measures
|
Hui Ding, Goce Trajcevski, P. Scheuermann, Xiaoyue Wang, Eamonn J. Keogh
|
2008
|
View Paper |
Intelligent Visual Analytics Queries
|
U. Dayal, D. Keim, D. Morent, Jörn Schneidewind, H. Packard
|
2007
|
View Paper |
Another look at measures of forecast accuracy
|
Rob J Hyndman, A. Koehler
|
2006
|
View Paper |
Interactive pattern search in time series
|
P. Buono, Aleks Aris, C. Plaisant, Amir Khella, B. Shneiderman
|
2005
|
View Paper |
A symbolic representation of time series, with implications for streaming algorithms
|
Jessica Lin, Eamonn J. Keogh, S. Lonardi, B. Chiu
|
2003
|
View Paper |
Visual unrolling of network evolution and the analysis of dynamic discourse
|
U. Brandes, Steven R. Corman
|
2002
|
View Paper |
Interactive querying of time series data
|
H. Hochheiser
|
2002
|
View Paper |
Dimensionality Reduction for Fast Similarity Search in Large Time Series Databases
|
Eamonn J. Keogh, K. Chakrabarti, M. Pazzani, S. Mehrotra
|
2001
|
View Paper |
Sketching a graph to query a time-series database
|
M. Wattenberg
|
2001
|
View Paper |
On Default Correlation: A Copula Function Approach
|
David X. Li
|
1999
|
View Paper |
A Probabilistic Approach to Fast Pattern Matching in Time Series Databases
|
Eamonn J. Keogh, Padhraic Smyth
|
1997
|
View Paper |
SUS: A 'Quick and Dirty' Usability Scale
|
J. Brooke
|
1996
|
View Paper |
Querying Shapes of Histories
|
R. Agrawal, G. Psaila, E. Wimmers, Mohamed Zaït
|
1995
|
View Paper |
A Description of Think Aloud Method and Protocol Analysis
|
M. Fonteyn, B. Kuipers, S. Grobe
|
1993
|
View Paper |
Finding Connected Components and Connected Ones on a Mesh-Connected Parallel Computer
|
David Nassimi, S. Sahni
|
1980
|
View Paper |
Euclidean distance mapping
|
P. Danielsson
|
1980
|
View Paper |
Depth-First Search and Linear Graph Algorithms
|
R. Tarjan
|
1972
|
View Paper |
Investigating causal relations by econometric models and cross-spectral methods
|
C. Granger
|
1969
|
View Paper |
‘FOOTRULE’ FOR MEASURING CORRELATION
|
C. Spearman
|
1906
|
View Paper |
LIII. On lines and planes of closest fit to systems of points in space
|
Karl Pearson F.R.S.
|
1901
|
View Paper |
received her B.S. degree in computer science from Zhejiang University in
|
2021
|
||
researcher at Microsoft Research Asia from 2012
|
2015
|
||
TIME SERIES DATA MINING
|
Nuno Castro
|
2010
|
View Paper |
“Flask,”
|
2010
|
||
Thematic Coding and Categorizing
|
G. Gibbs
|
2007
|
View Paper |
Measuring phase synchrony in brain signals
|
J. Lachaux, E. Rodriguez, J. Martinerie, F. Varela
|
1999
|
View Paper |
Propagating uncertainty in bayesian networks by probabilistic logic sampling
|
M. Henrion
|
1986
|
View Paper |
Dynamic Time Warping
|
A. Bundy, L. Wallen
|
1984
|
View Paper |
On a Method of Investigating Periodicities in Disturbed Series, with Special Reference to Wolfer's Sunspot Numbers
|
G. Yule
|
1927
|
View Paper |
TimescaleDB
|
|||
is with the School of Software Engineering, South China University of Technology, Guangzhou, China
|
|||
are with Microsoft, Beijing, China
|
|||
“Elasticsearch,”
|
|||
“Tradingview,”
|
|||
interests include
|
|||
“Amazon timestream,”
|
|||
InfluxDB
|
|||
His main research interests are information visualization and visual analytics, with focuses on urban computing, sports science, immersive visualization, and social media analysis
|
Showing first page preview. Click "Open Full PDF" to view the complete paper.
Your comment contains inappropriate language and has been rejected.
Are you sure you want to remove this tag? This action cannot be undone.
Someone just favorited a paper!
Comments (0)