RCInvestigator: Towards Better Investigation of Anomaly Root Causes in Cloud Computing Systems
Publication
Metrics
AI Quick Summary
RCInvestigator is a visual analytics system designed to facilitate the investigation of anomaly root causes in cloud computing systems by addressing challenges in modeling databases, inferring causes from large-scale time series, and presenting comprehensible results. The system received positive feedback from experts during evaluations based on real-world data.
Paper Preview
Abstract
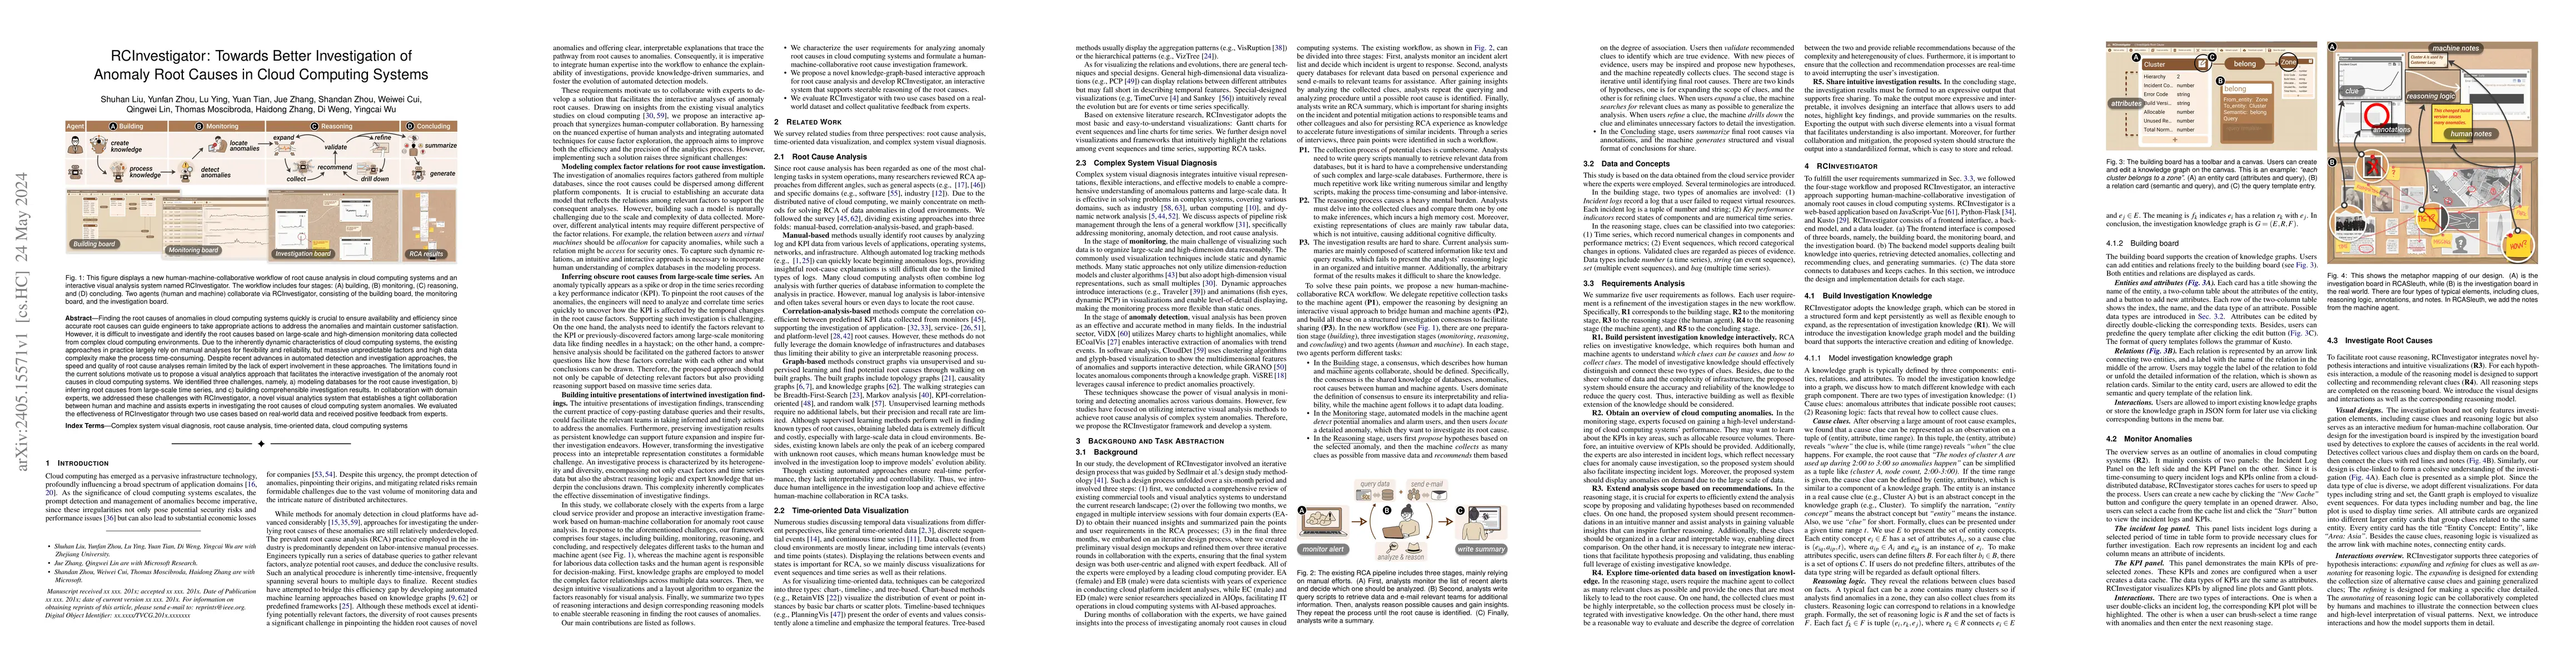
Finding the root causes of anomalies in cloud computing systems quickly is crucial to ensure availability and efficiency since accurate root causes can guide engineers to take appropriate actions to address the anomalies and maintain customer satisfaction. However, it is difficult to investigate and identify the root causes based on large-scale and high-dimension monitoring data collected from complex cloud computing environments. Due to the inherently dynamic characteristics of cloud computing systems, the existing approaches in practice largely rely on manual analyses for flexibility and reliability, but massive unpredictable factors and high data complexity make the process time-consuming. Despite recent advances in automated detection and investigation approaches, the speed and quality of root cause analyses remain limited by the lack of expert involvement in these approaches. The limitations found in the current solutions motivate us to propose a visual analytics approach that facilitates the interactive investigation of the anomaly root causes in cloud computing systems. We identified three challenges, namely, a) modeling databases for the root cause investigation, b) inferring root causes from large-scale time series, and c) building comprehensible investigation results. In collaboration with domain experts, we addressed these challenges with RCInvestigator, a novel visual analytics system that establishes a tight collaboration between human and machine and assists experts in investigating the root causes of cloud computing system anomalies. We evaluated the effectiveness of RCInvestigator through two use cases based on real-world data and received positive feedback from experts.
AI Key Findings
Get AI-generated insights about this paper's methodology, results, significance, and more — seven facets brought into focus.
Impact
Paper Details
Authors
PDF Preview
Key Terms
Citation Network
Current paper (gray), citations (green), references (blue)
Display is limited for performance on very large graphs.
Discussion 0