This paper introduces "Live Charts," an innovative format that transforms static charts into dynamic presentations through animated visuals and audio narration to enhance data understanding. The proposed method uses GNN and large language models to automate the conversion process, showing improved comprehension in evaluations.
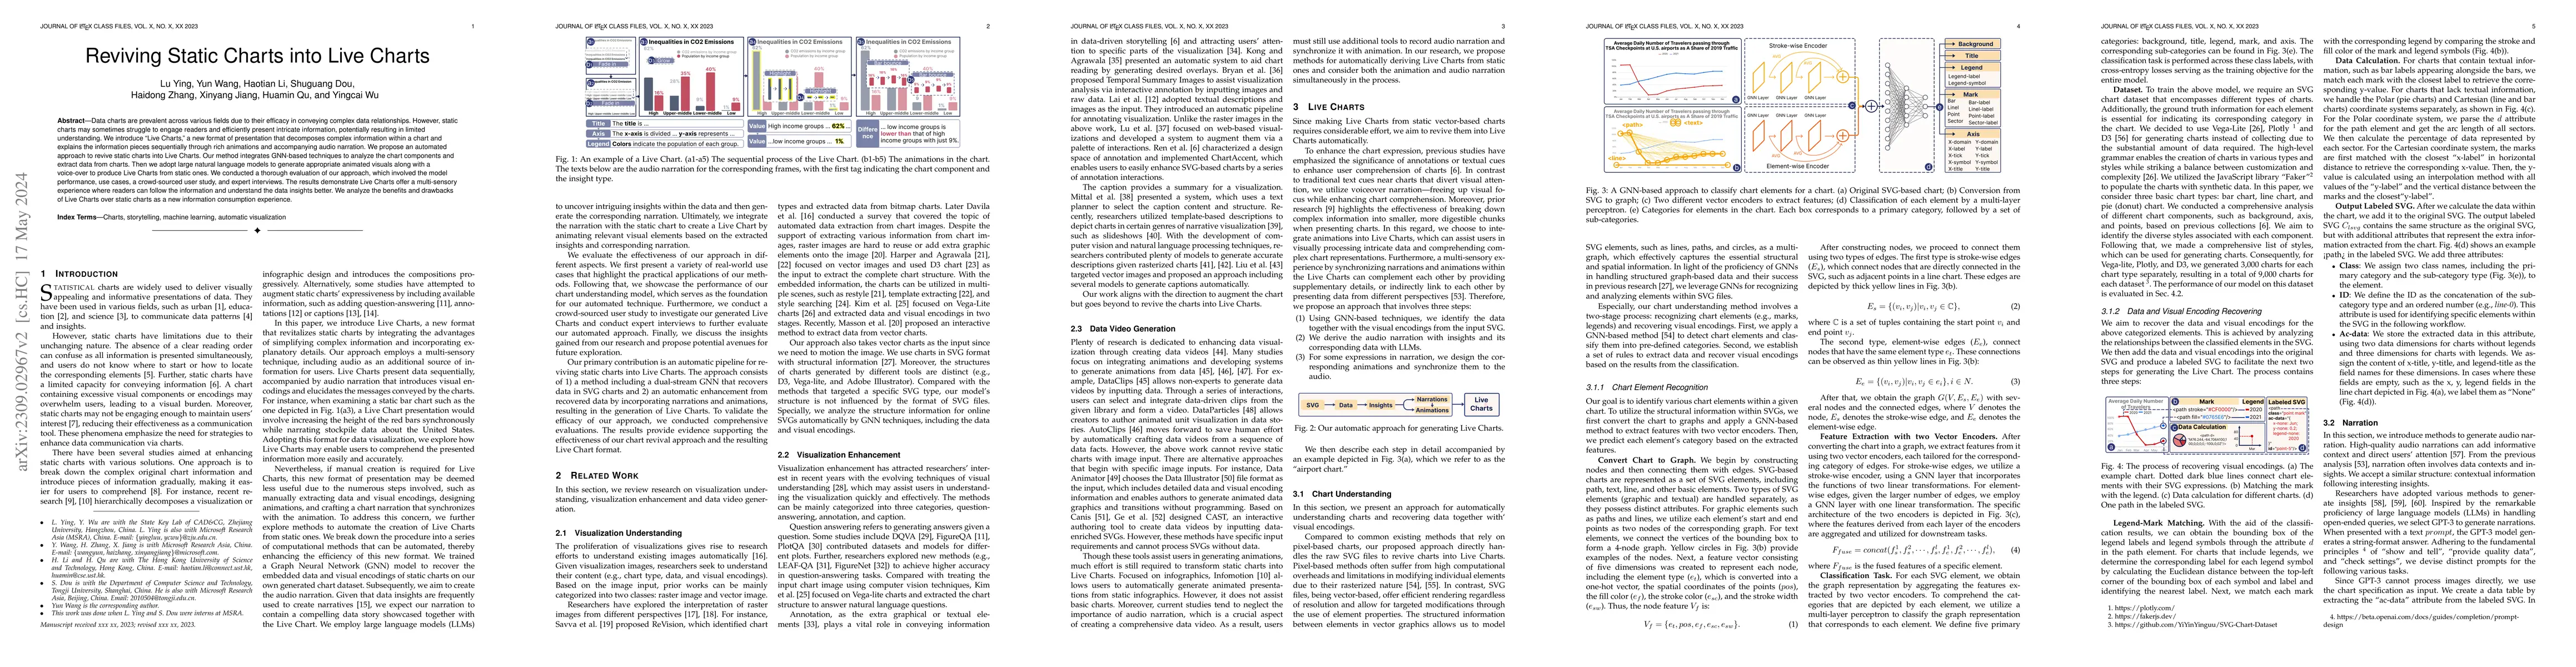
Data charts are prevalent across various fields due to their efficacy in conveying complex data relationships. However, static charts may sometimes struggle to engage readers and efficiently present intricate information, potentially resulting in limited understanding. We introduce "Live Charts," a new format of presentation that decomposes complex information within a chart and explains the information pieces sequentially through rich animations and accompanying audio narration. We propose an automated approach to revive static charts into Live Charts. Our method integrates GNN-based techniques to analyze the chart components and extract data from charts. Then we adopt large natural language models to generate appropriate animated visuals along with a voice-over to produce Live Charts from static ones. We conducted a thorough evaluation of our approach, which involved the model performance, use cases, a crowd-sourced user study, and expert interviews. The results demonstrate Live Charts offer a multi-sensory experience where readers can follow the information and understand the data insights better. We analyze the benefits and drawbacks of Live Charts over static charts as a new information consumption experience.
This graph shows how this paper is connected to other research. The current paper is shown in dark gray, papers that cite it are in green, and papers it references are in blue. You can:
• Hover over any node to see the paper title
• Click a node to view that paper's details
• Drag nodes to rearrange the graph
• Use the zoom controls (bottom right) to zoom in/out
Title | Authors | Year | Actions |
---|---|---|---|
Plume: Scaffolding Text Composition in Dashboards
|
Maxim Lisnic, V. Setlur, N. Sultanum
|
2025
|
View Paper |
InterChat: Enhancing Generative Visual Analytics using Multimodal Interactions
|
Juntong Chen, Jiang Wu, Jiajing Guo, Vikram Mohanty, Xueming Li, Jorge Piazentin Ono, Wenbin He, Liu Ren, Dongyu Liu
|
2025
|
View Paper |
Reflection on Data Storytelling Tools in the Generative AI Era from the Human-AI Collaboration Perspective
|
Haotian Li, Yun Wang, Huamin Qu
|
2025
|
View Paper |
SportsBuddy: Designing and Evaluating an AI-Powered Sports Video Storytelling Tool Through Real-World Deployment
|
Tica Lin, Ruxun Xiang, Gardenia Liu, Divyanshu Tiwari, Meng-Chia Chiang, Chenjiayi Ye, Hanspeter Pfister, Zhu-Tian Chen
|
2025
|
View Paper |
Animating the Narrative: A Review of Animation Styles in Narrative Visualization
|
Vyri Yang, Mahmood Jasim
|
2024
|
View Paper |
Narrative Player: Reviving Data Narratives with Visuals
|
Zekai Shao, Leixian Shen, Haotian Li, Yi Shan, Huamin Qu, Yun Wang, Siming Chen
|
2024
|
View Paper |
Data Playwright: Authoring Data Videos with Annotated Narration
|
Leixian Shen, Haotian Li, Yun Wang, Tianqi Luo, Yuyu Luo, Huamin Qu
|
2024
|
View Paper |
From Data to Story: Towards Automatic Animated Data Video Creation with LLM-Based Multi-Agent Systems
|
Leixian Shen, Haotian Li, Yun Wang, Huamin Qu
|
2024
|
View Paper |
Hierarchically Recognizing Vector Graphics and A New Chart-Based Vector Graphics Dataset
|
Shuguang Dou, Xinyang Jiang, Lu Liu, Lu Ying, Caihua Shan, Yifei Shen, Xuanyi Dong, Yun Wang, Dongsheng Li, Cairong Zhao
|
2024
|
View Paper |
Chart4Blind: An Intelligent Interface for Chart Accessibility Conversion
|
Omar Moured, Morris Baumgarten-Egemole, Karin Müller, Alina Roitberg, Thorsten Schwarz, Rainer Stiefelhagen
|
2024
|
View Paper |
Leveraging Foundation Models for Crafting Narrative Visualization: A Survey.
|
Yi He, Ke Xu, Shixiong Cao, Yang Shi, Qing Chen, Nan Cao
|
2024
|
View Paper |
ChartGPT: Leveraging LLMs to Generate Charts From Abstract Natural Language
|
Yuan Tian, Weiwei Cui, Dazhen Deng, Xinjing Yi, Yurun Yang, Haidong Zhang, Yingcai Wu
|
2023
|
View Paper |
Where Are We So Far? Understanding Data Storytelling Tools from the Perspective of Human-AI Collaboration
|
Haotian Li, Yun Wang, Huamin Qu
|
2023
|
View Paper |
WonderFlow: Narration-Centric Design of Animated Data Videos
|
Yun Wang, Leixian Shen, Zhengxin You, Xinhuan Shu, Bongshin Lee, John Thompson, Haidong Zhang, Dongmei Zhang
|
2023
|
View Paper |
VAID: Indexing View Designs in Visual Analytics System
|
Lu Ying, Aoyu Wu, Haotian Li, Zikun Deng, Ji Lan, Jiang Wu, Yong Wang, Huamin Qu, Dazhen Deng, Yingcai Wu
|
2022
|
View Paper |
Exploring the Reproducibility for Visualization Figures in Climate Change Report
|
Lu Ying, Yingcai Wu, Jean-Daniel Fekete
|
View Paper |
Comments (0)