Publication
Metrics
Paper Preview
Abstract
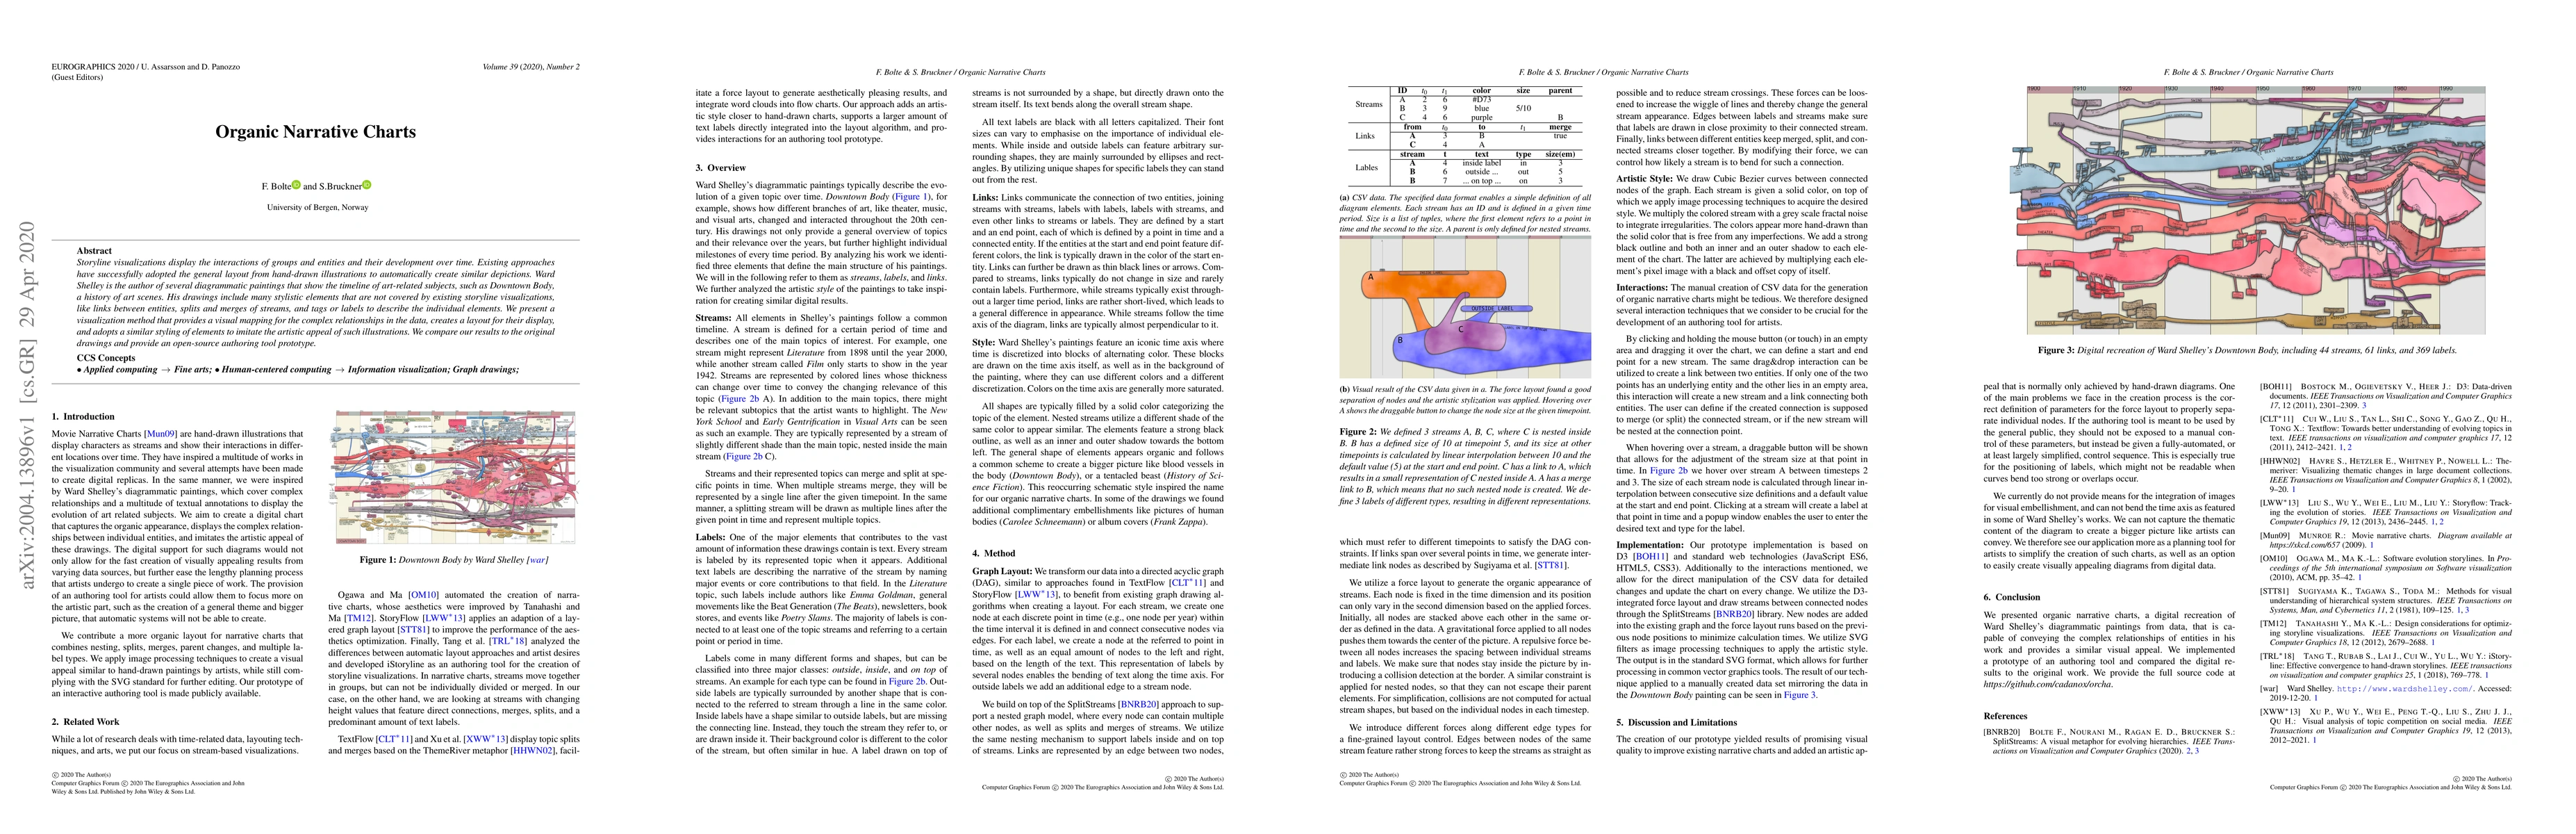
Storyline visualizations display the interactions of groups and entities and their development over time. Existing approaches have successfully adopted the general layout from hand-drawn illustrations to automatically create similar depictions. Ward Shelley is the author of several diagrammatic paintings that show the timeline of art-related subjects, such as Downtown Body, a history of art scenes. His drawings include many stylistic elements that are not covered by existing storyline visualizations, like links between entities, splits and merges of streams, and tags or labels to describe the individual elements. We present a visualization method that provides a visual mapping for the complex relationships in the data, creates a layout for their display, and adopts a similar styling of elements to imitate the artistic appeal of such illustrations. We compare our results to the original drawings and provide an open-source authoring tool prototype.
AI Key Findings
Get AI-generated insights about this paper's methodology, results, significance, and more — seven facets brought into focus.
Impact
Paper Details
Authors
PDF Preview
Key Terms
Citation Network
Current paper (gray), citations (green), references (blue)
Display is limited for performance on very large graphs.
Discussion 0