Academic Profile
Statistics
Similar Authors
Papers on arXiv
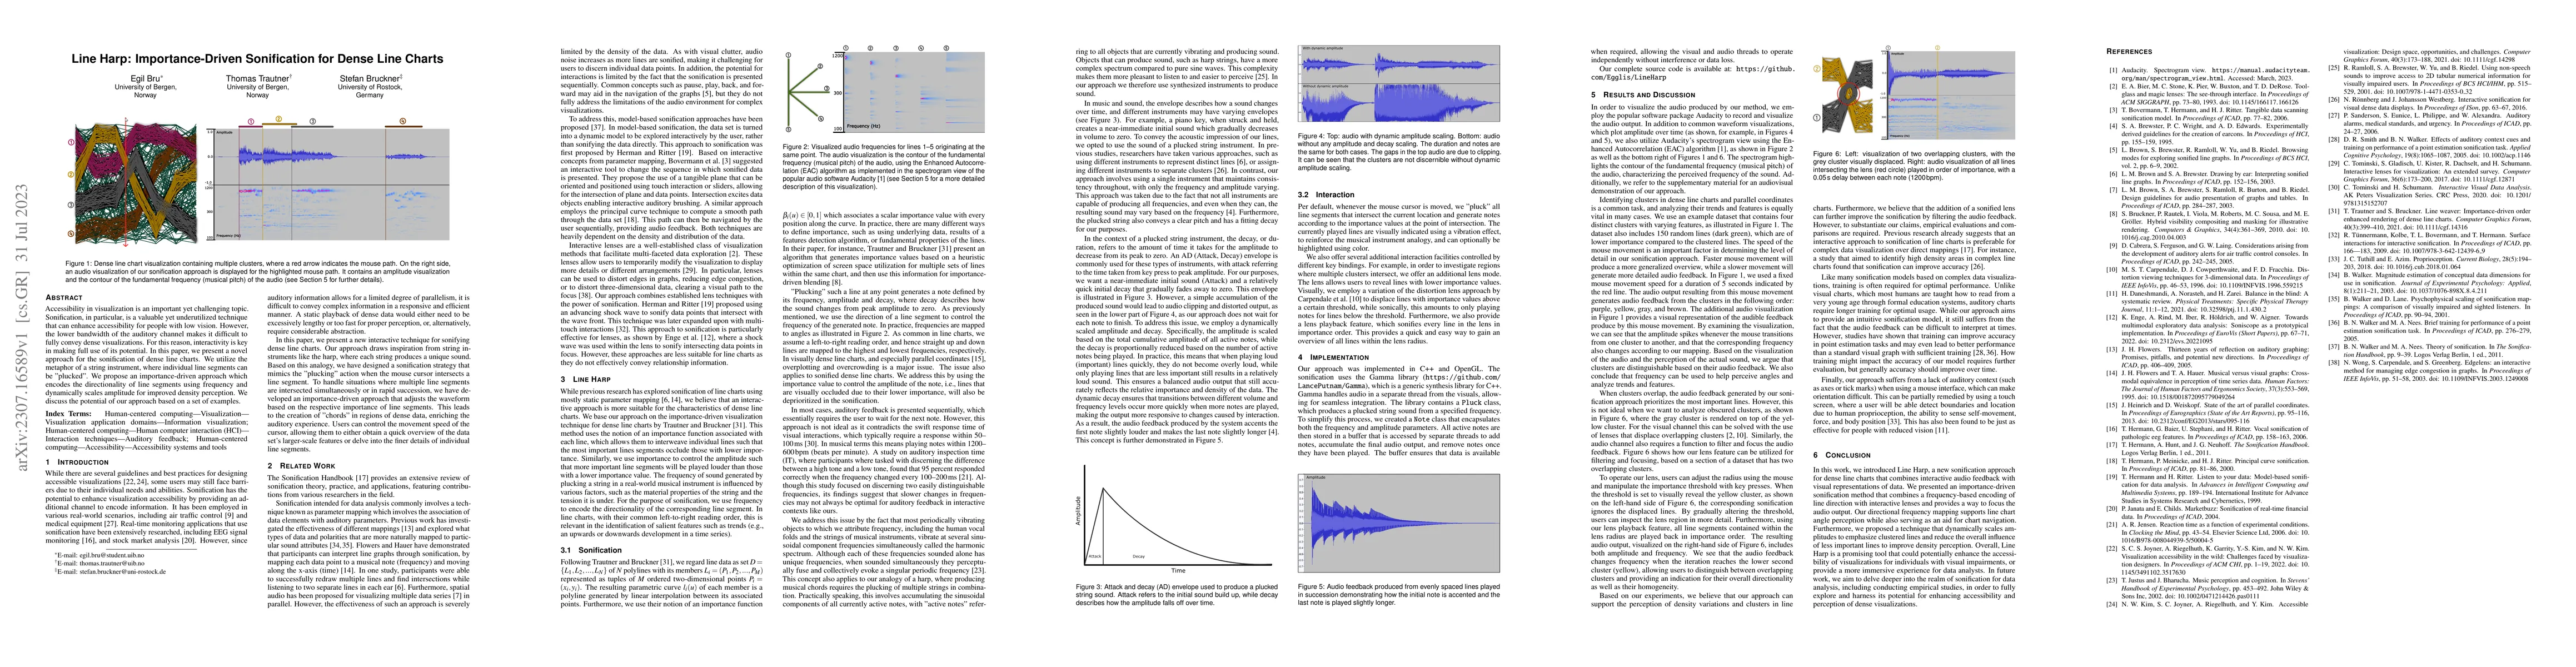
Accessibility in visualization is an important yet challenging topic. Sonification, in particular, is a valuable yet underutilized technique that can enhance accessibility for people with low vision...
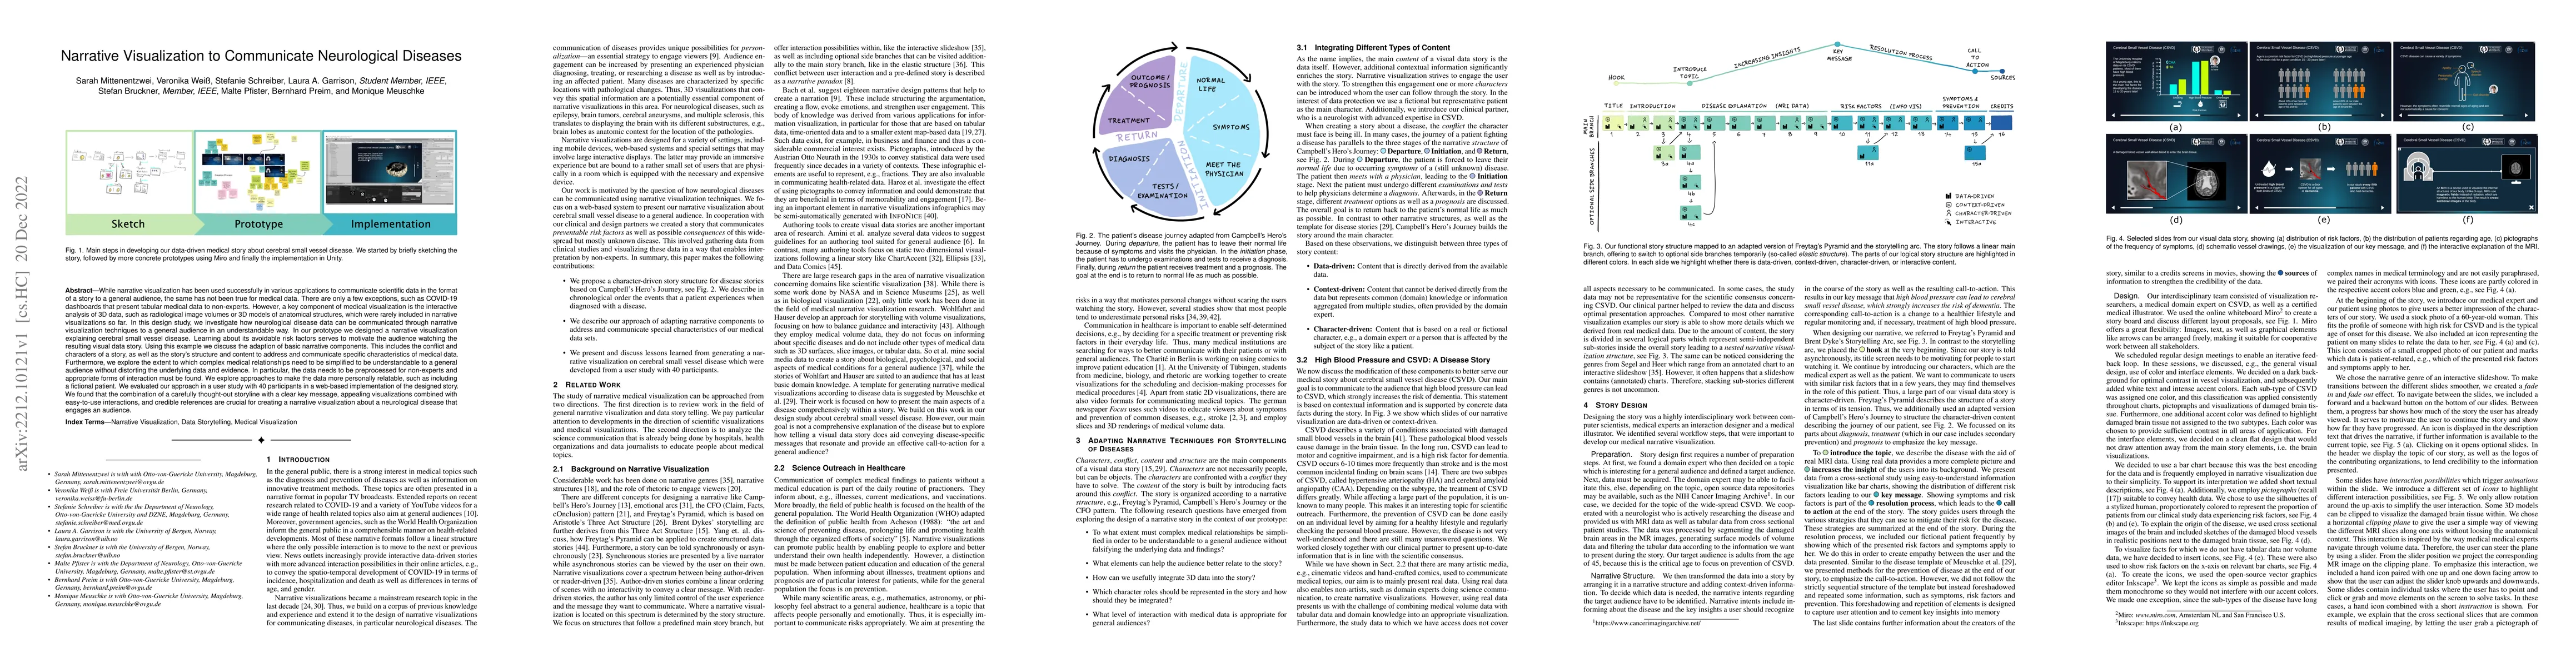
While narrative visualization has been used successfully in various applications to communicate scientific data in the format of a story to a general audience, the same has not been true for medical...
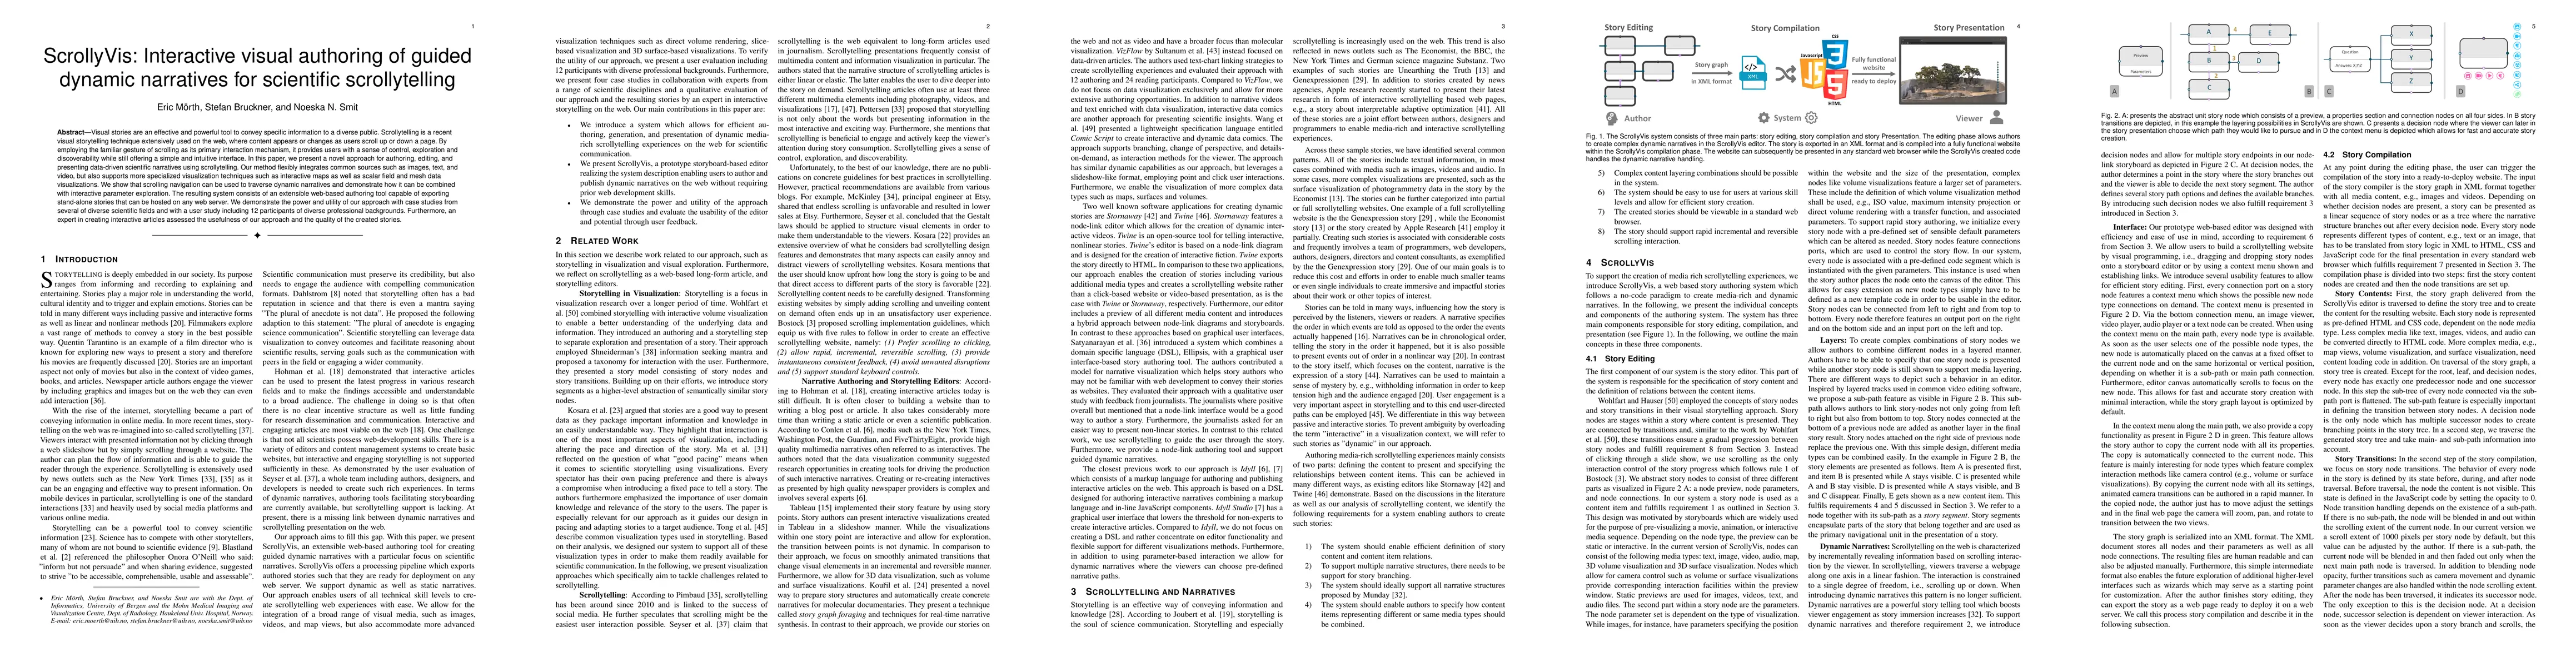
Visual stories are an effective and powerful tool to convey specific information to a diverse public. Scrollytelling is a recent visual storytelling technique extensively used on the web, where cont...
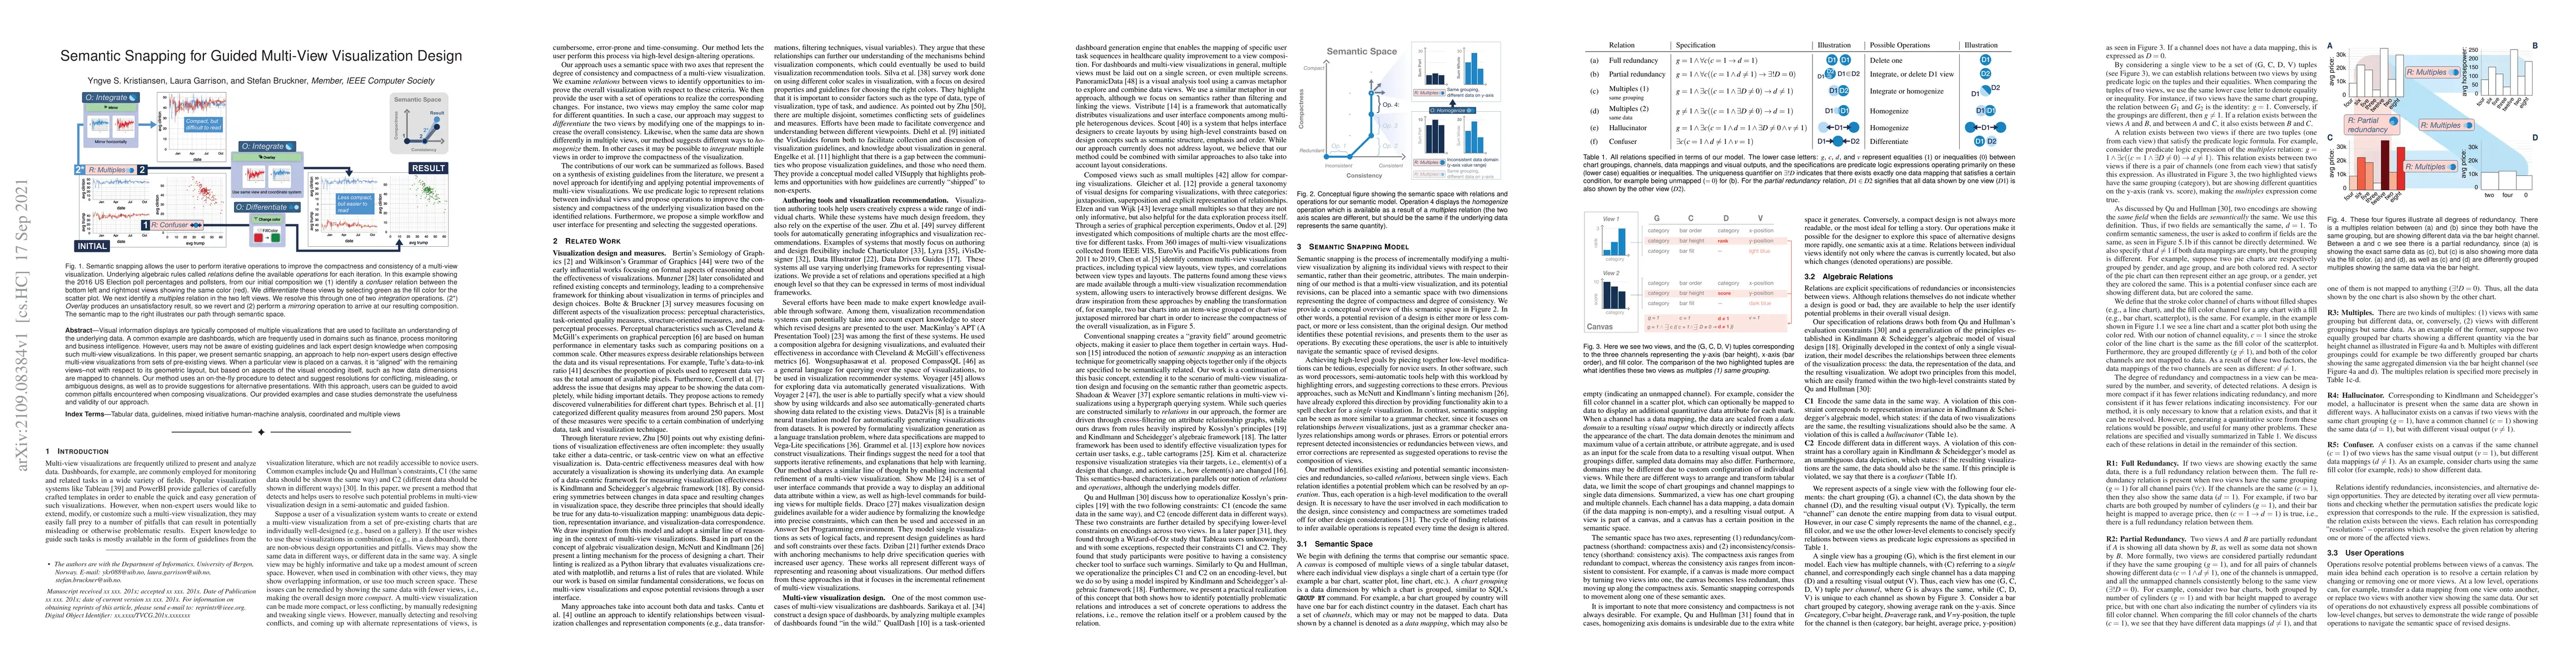
Visual information displays are typically composed of multiple visualizations that are used to facilitate an understanding of the underlying data. A common example are dashboards, which are frequent...
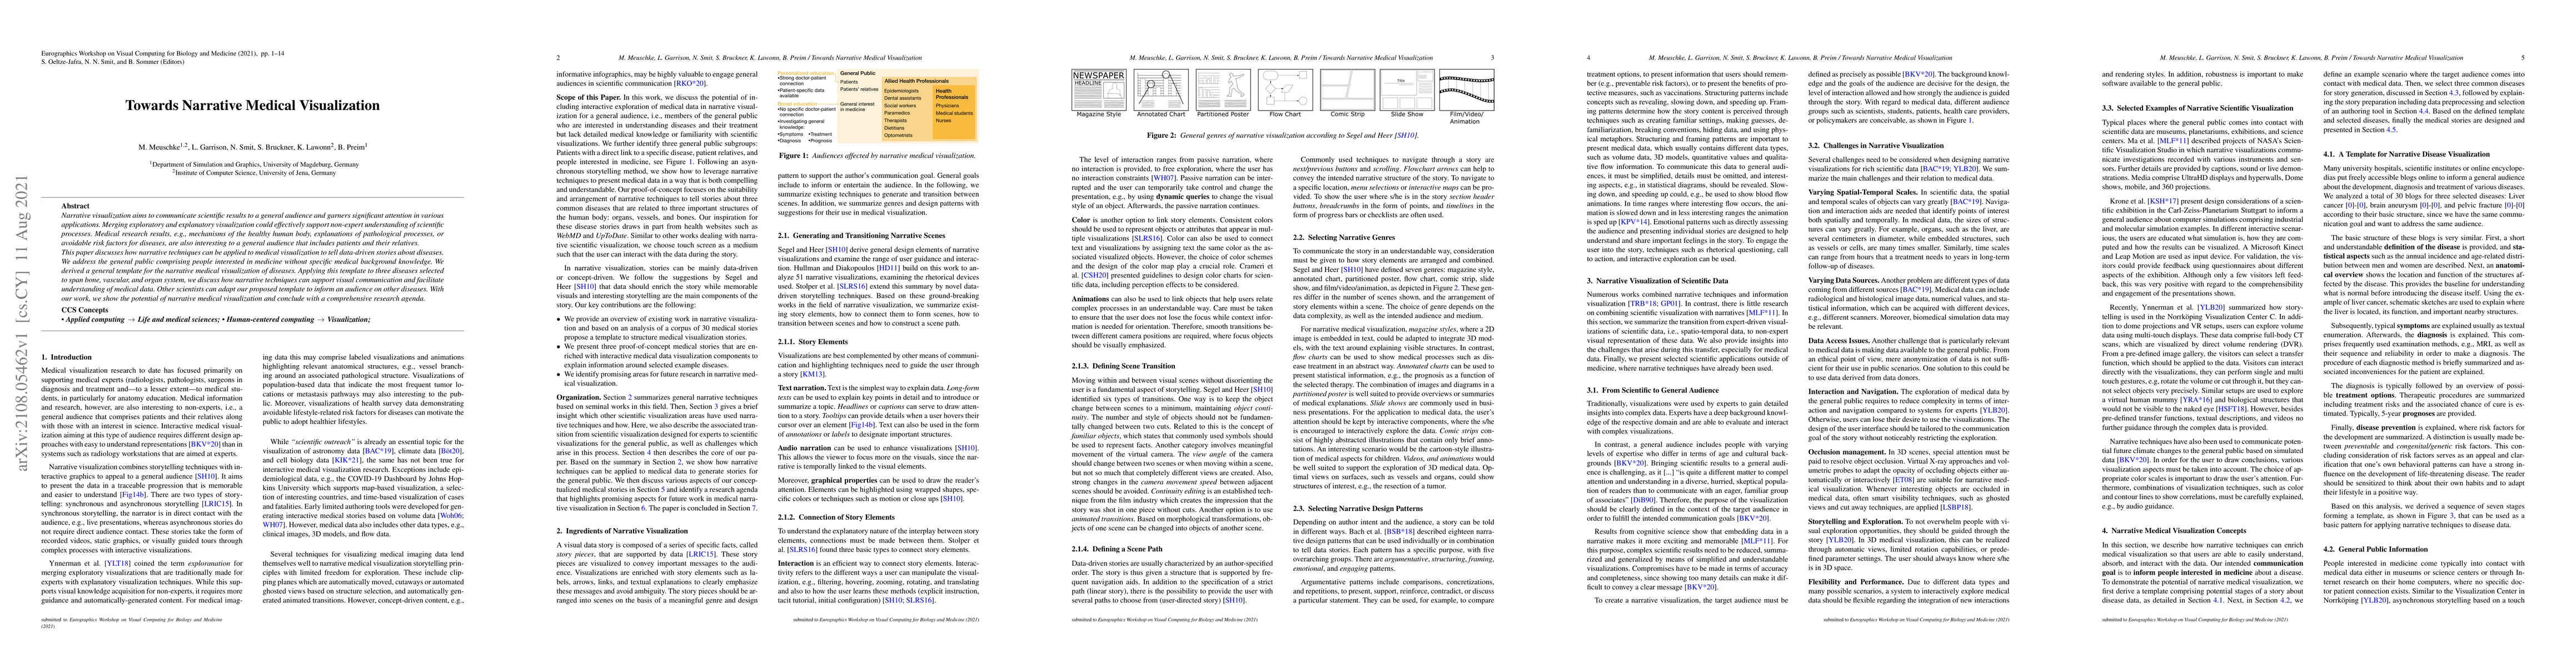
Narrative visualization aims to communicate scientific results to a general audience and garners significant attention in various applications. Merging exploratory and explanatory visualization coul...
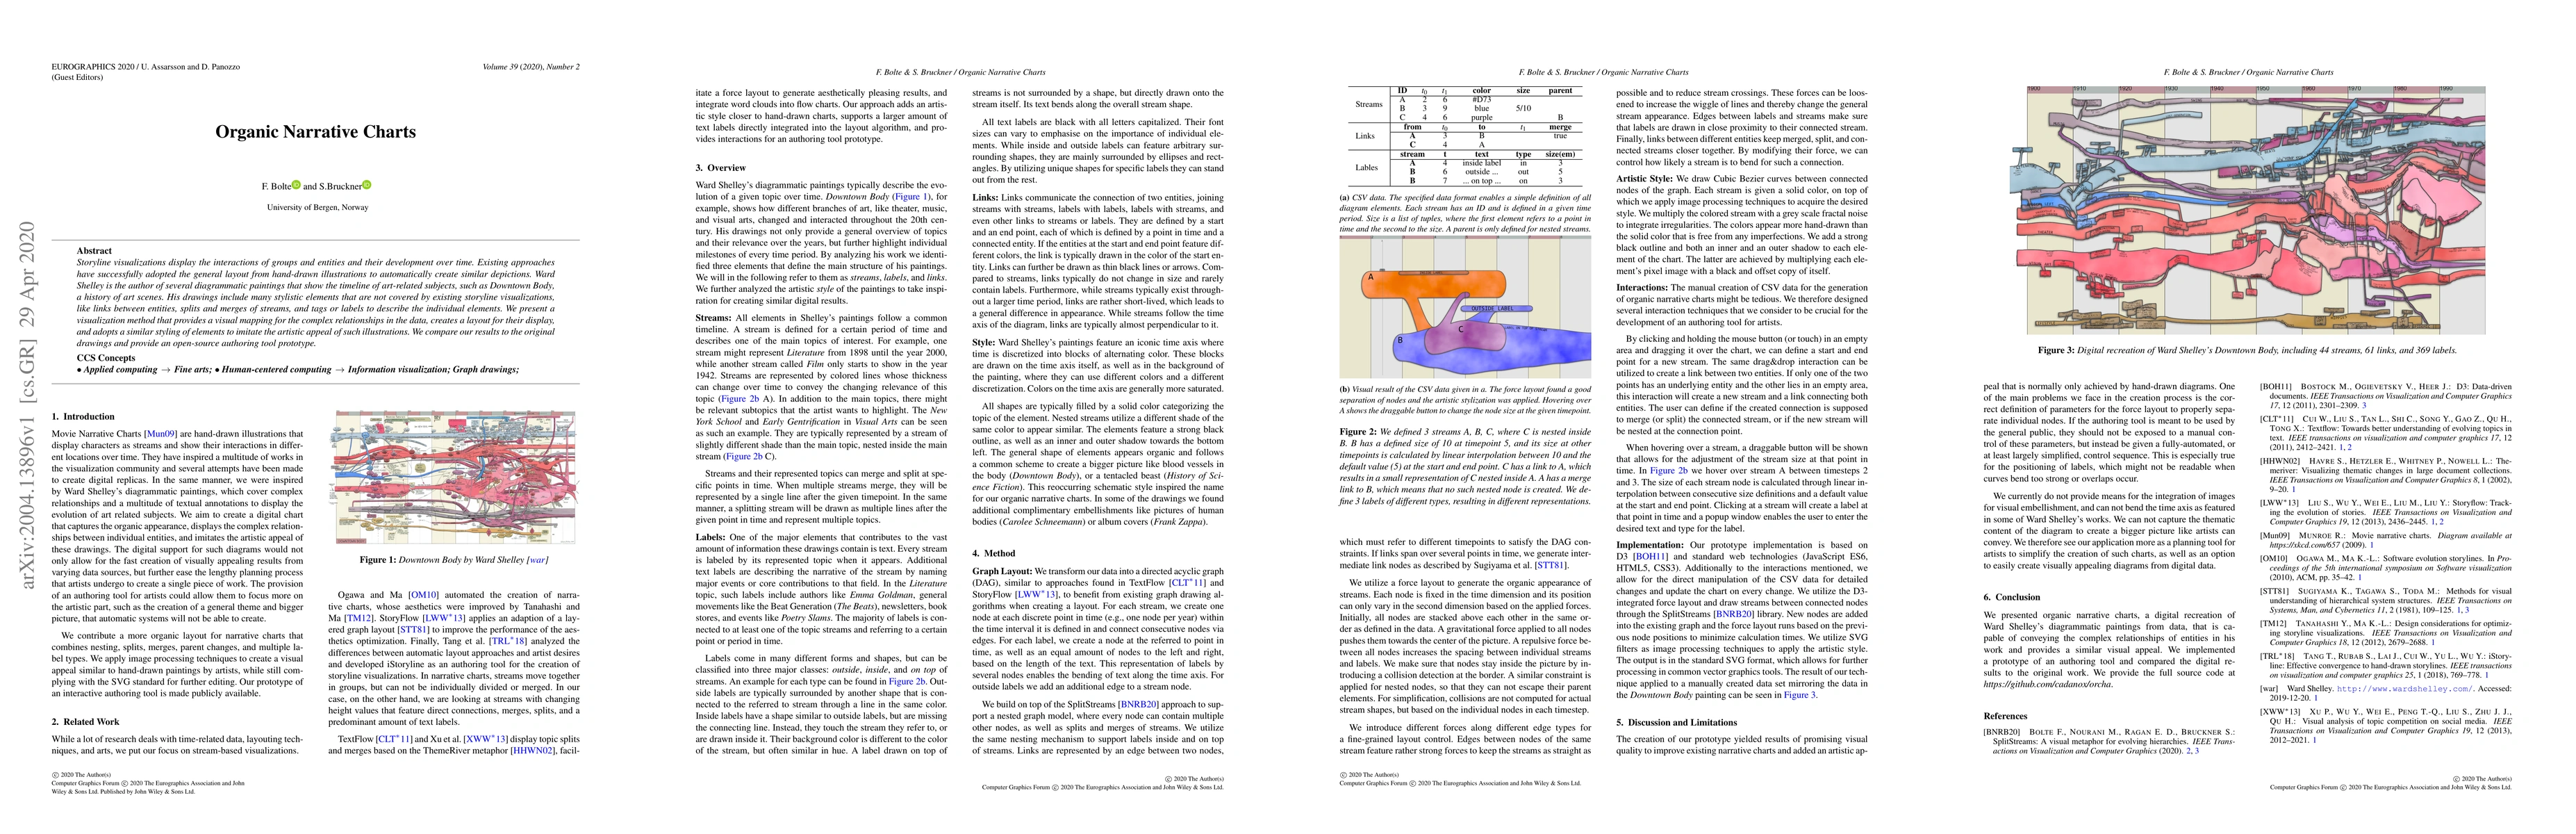
Storyline visualizations display the interactions of groups and entities and their development over time. Existing approaches have successfully adopted the general layout from hand-drawn illustratio...
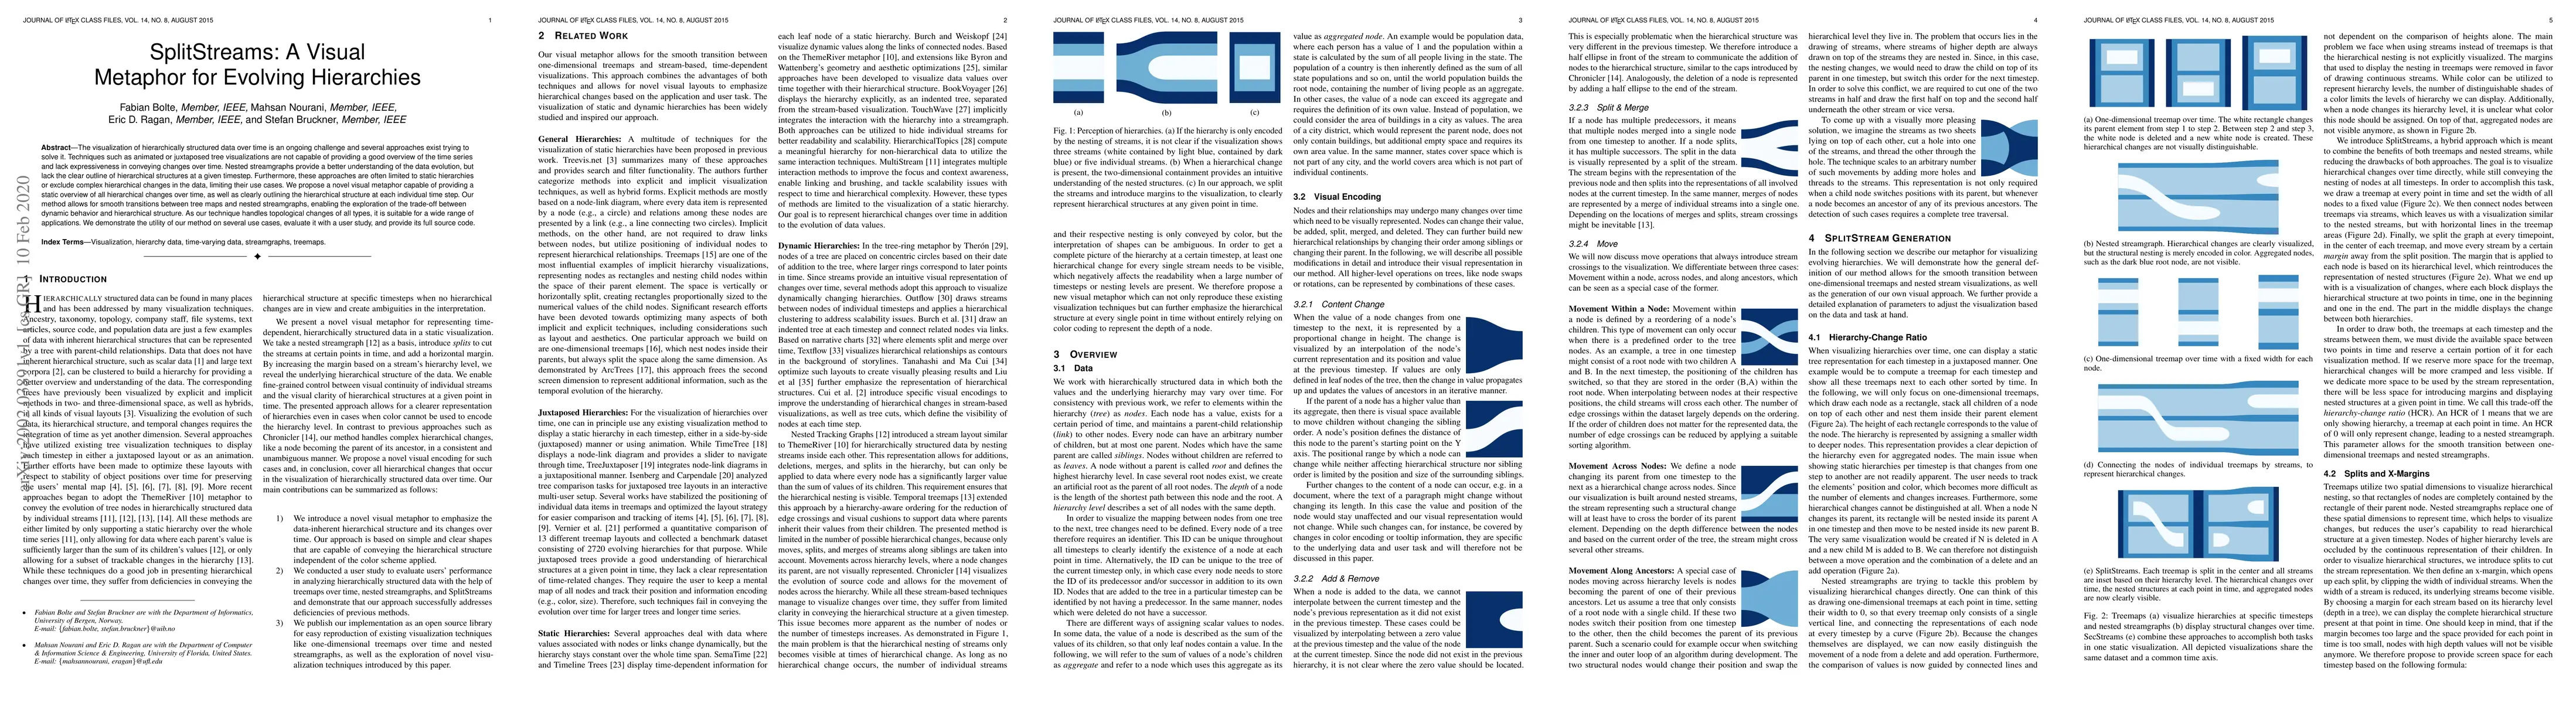
The visualization of hierarchically structured data over time is an ongoing challenge and several approaches exist trying to solve it. Techniques such as animated or juxtaposed tree visualizations a...
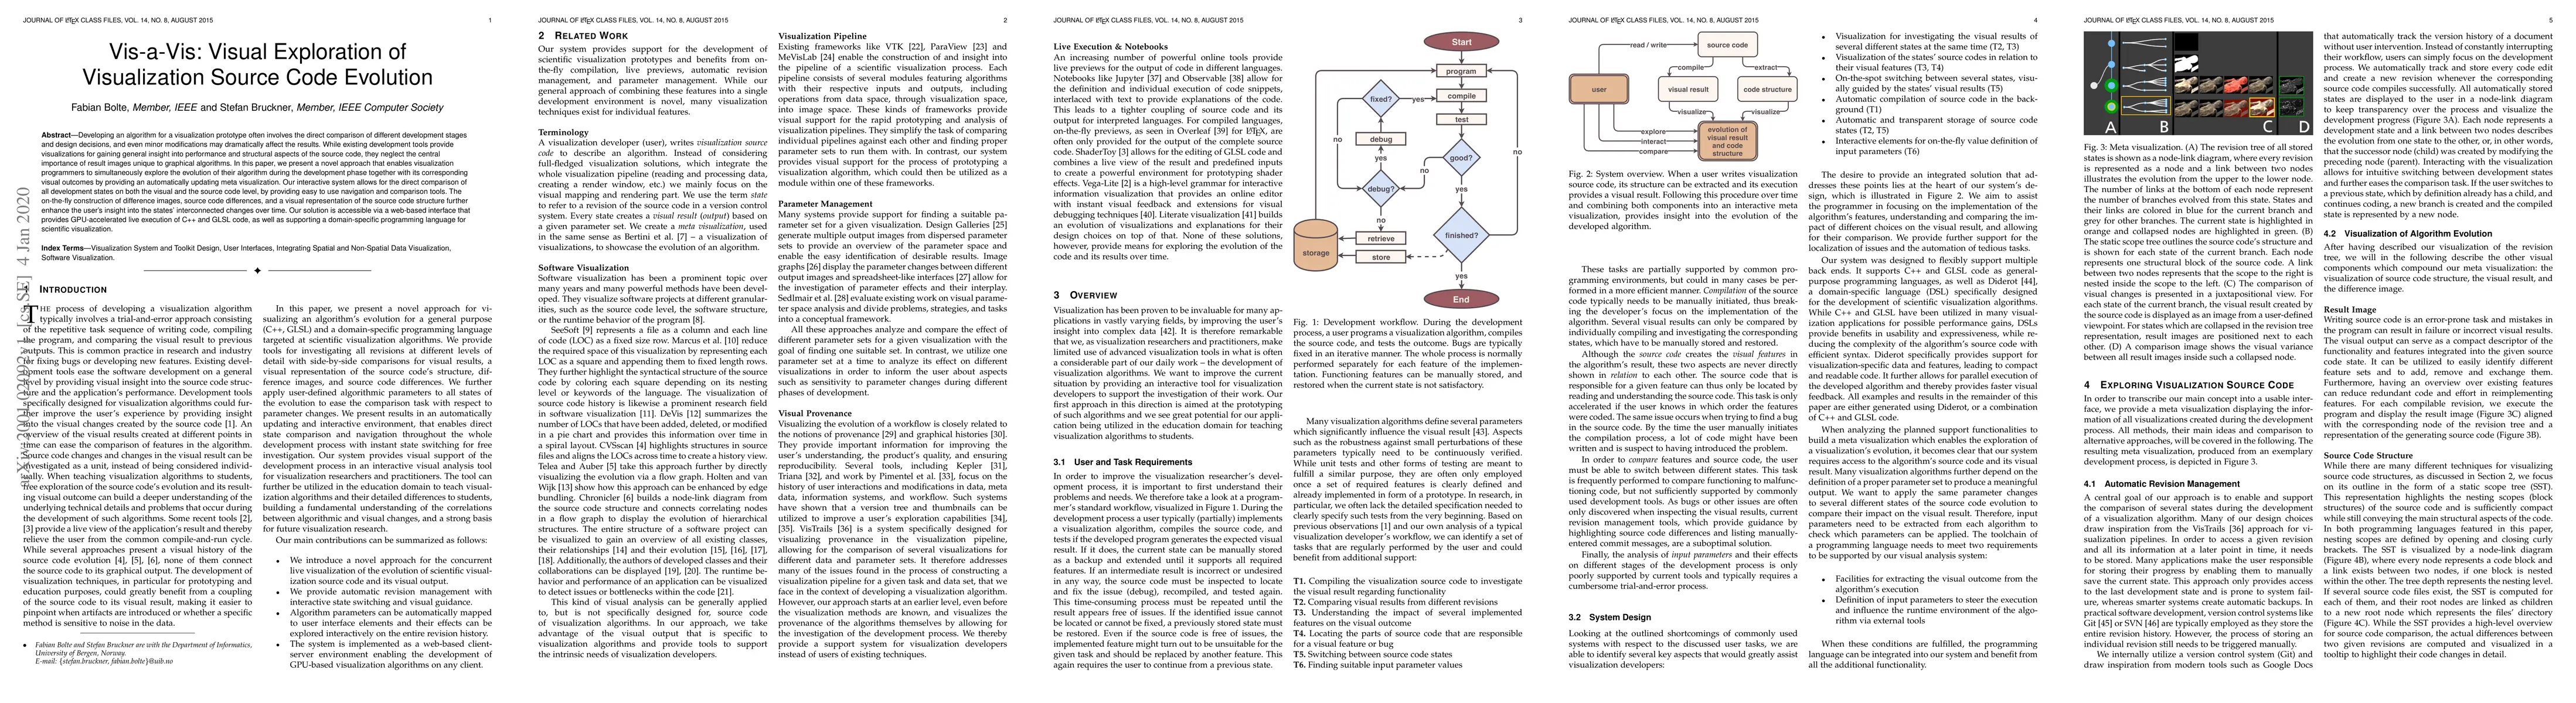
Developing an algorithm for a visualization prototype often involves the direct comparison of different development stages and design decisions, and even minor modifications may dramatically affect ...
Measurement is an integral part of modern science, providing the fundamental means for evaluation, comparison, and prediction. In the context of visualization, several different types of measures ha...
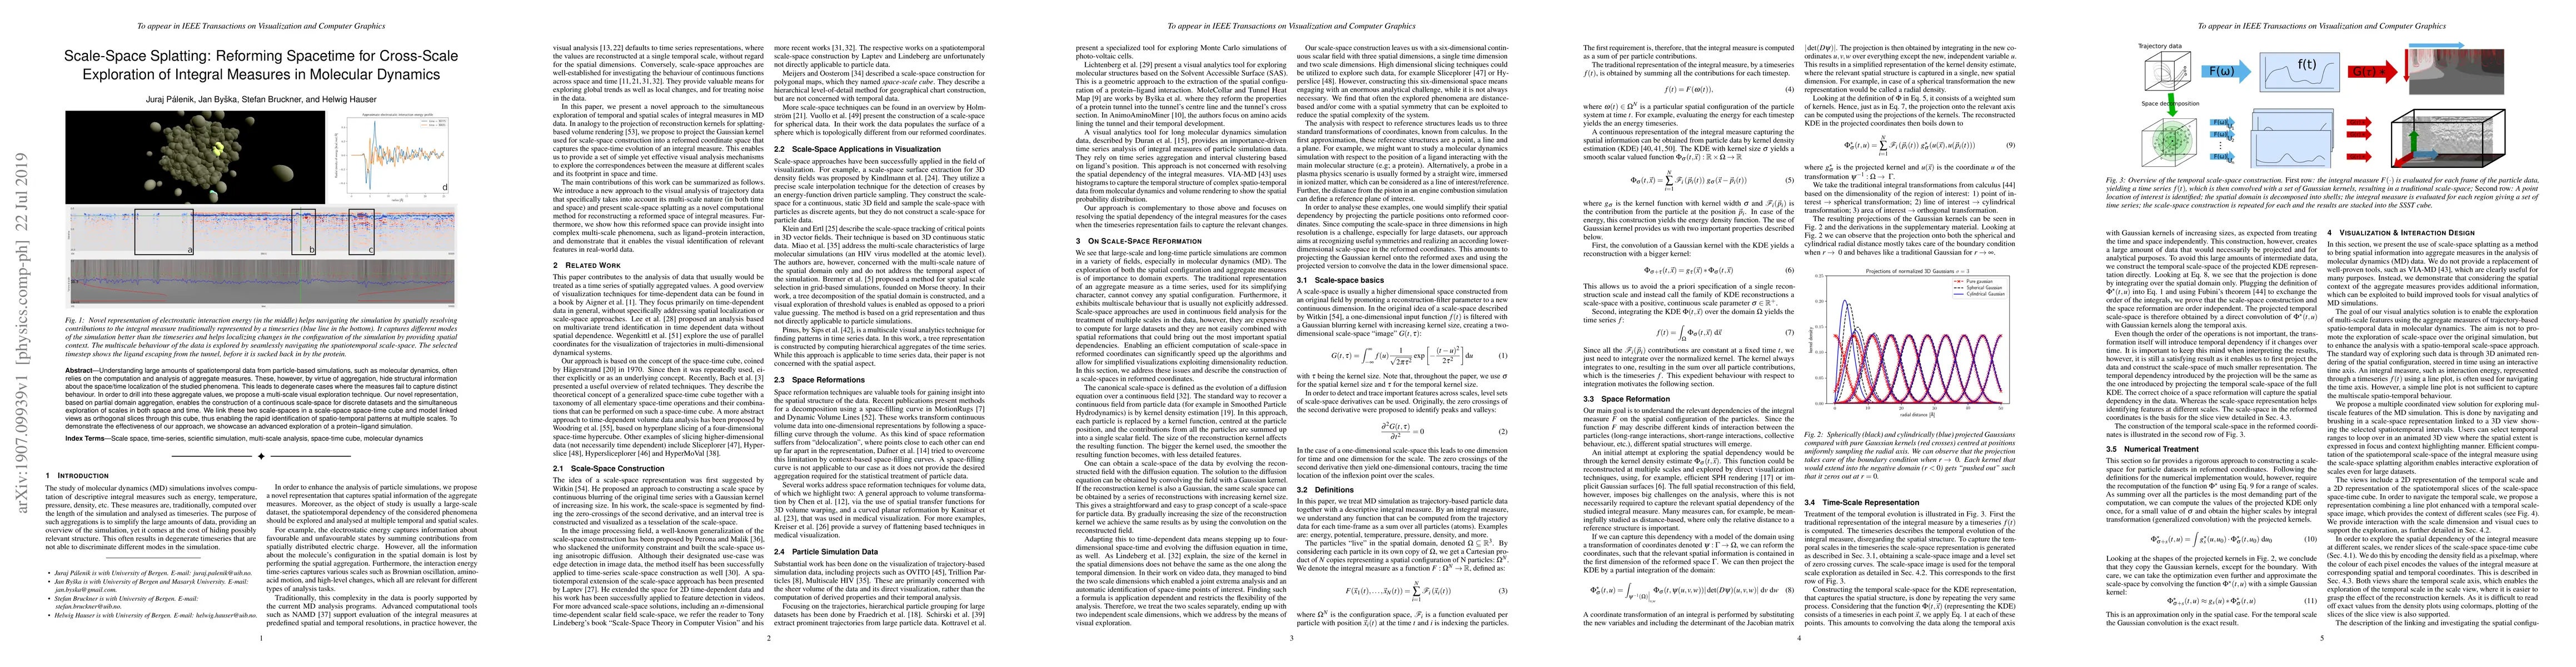
Understanding large amounts of spatiotemporal data from particle-based simulations, such as molecular dynamics, often relies on the computation and analysis of aggregate measures. These, however, by...
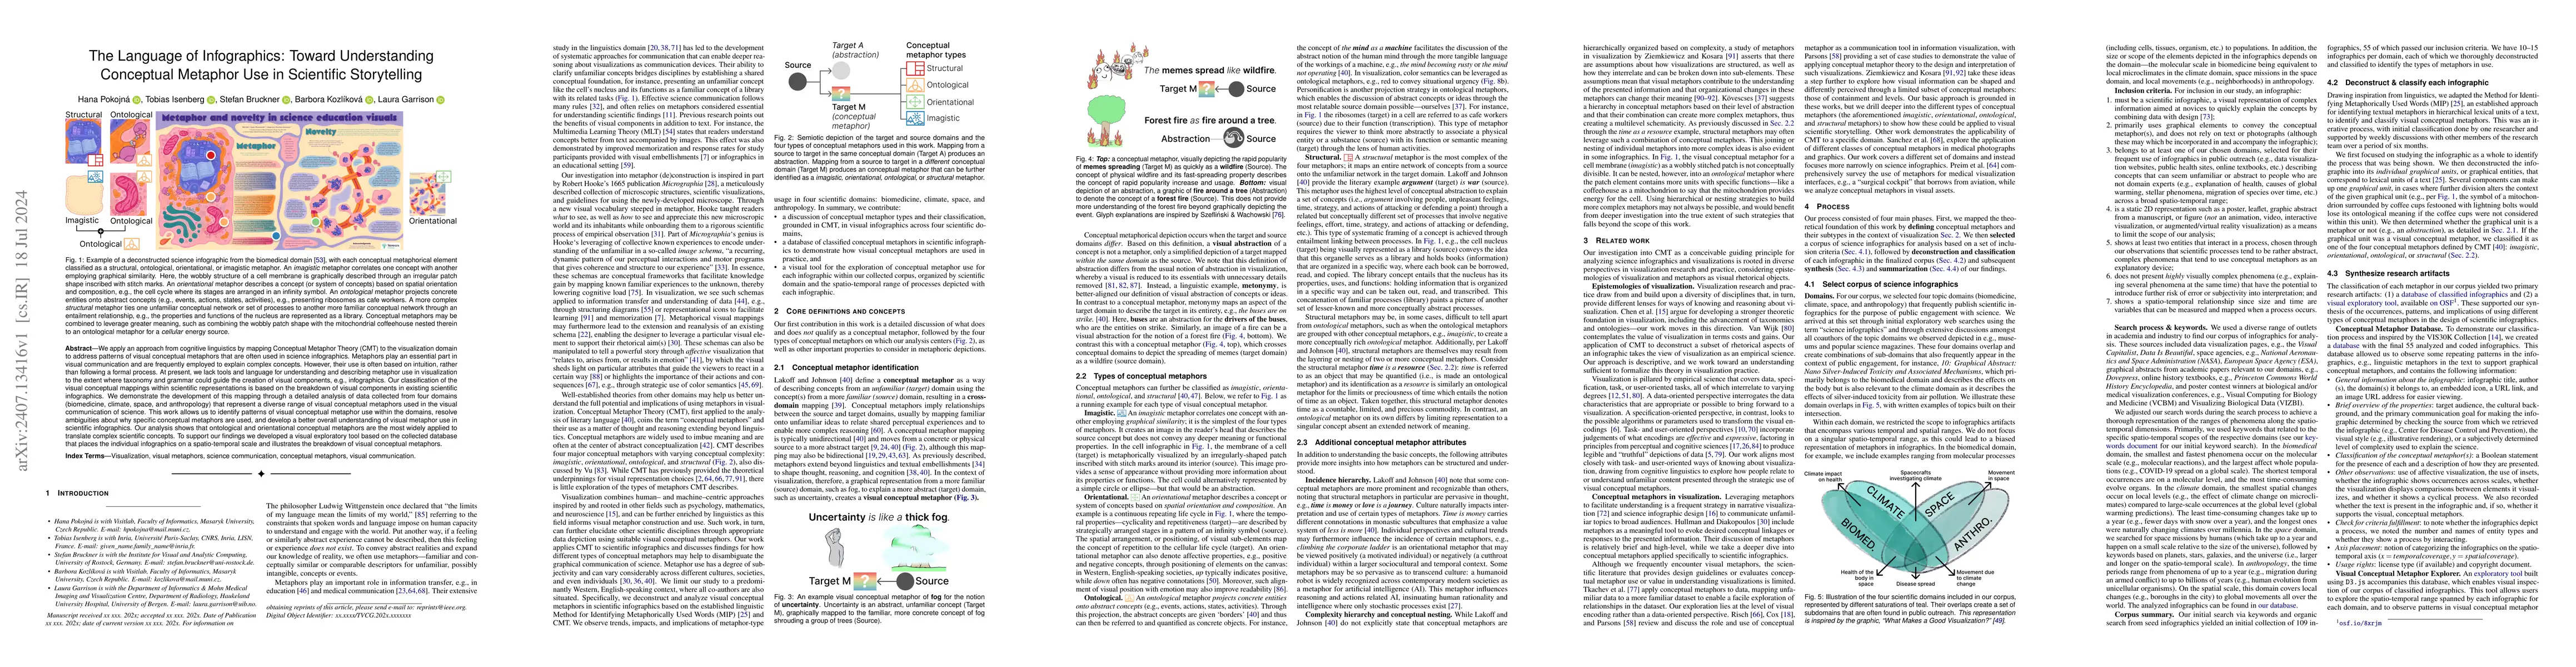
We apply an approach from cognitive linguistics by mapping Conceptual Metaphor Theory (CMT) to the visualization domain to address patterns of visual conceptual metaphors that are often used in scienc...
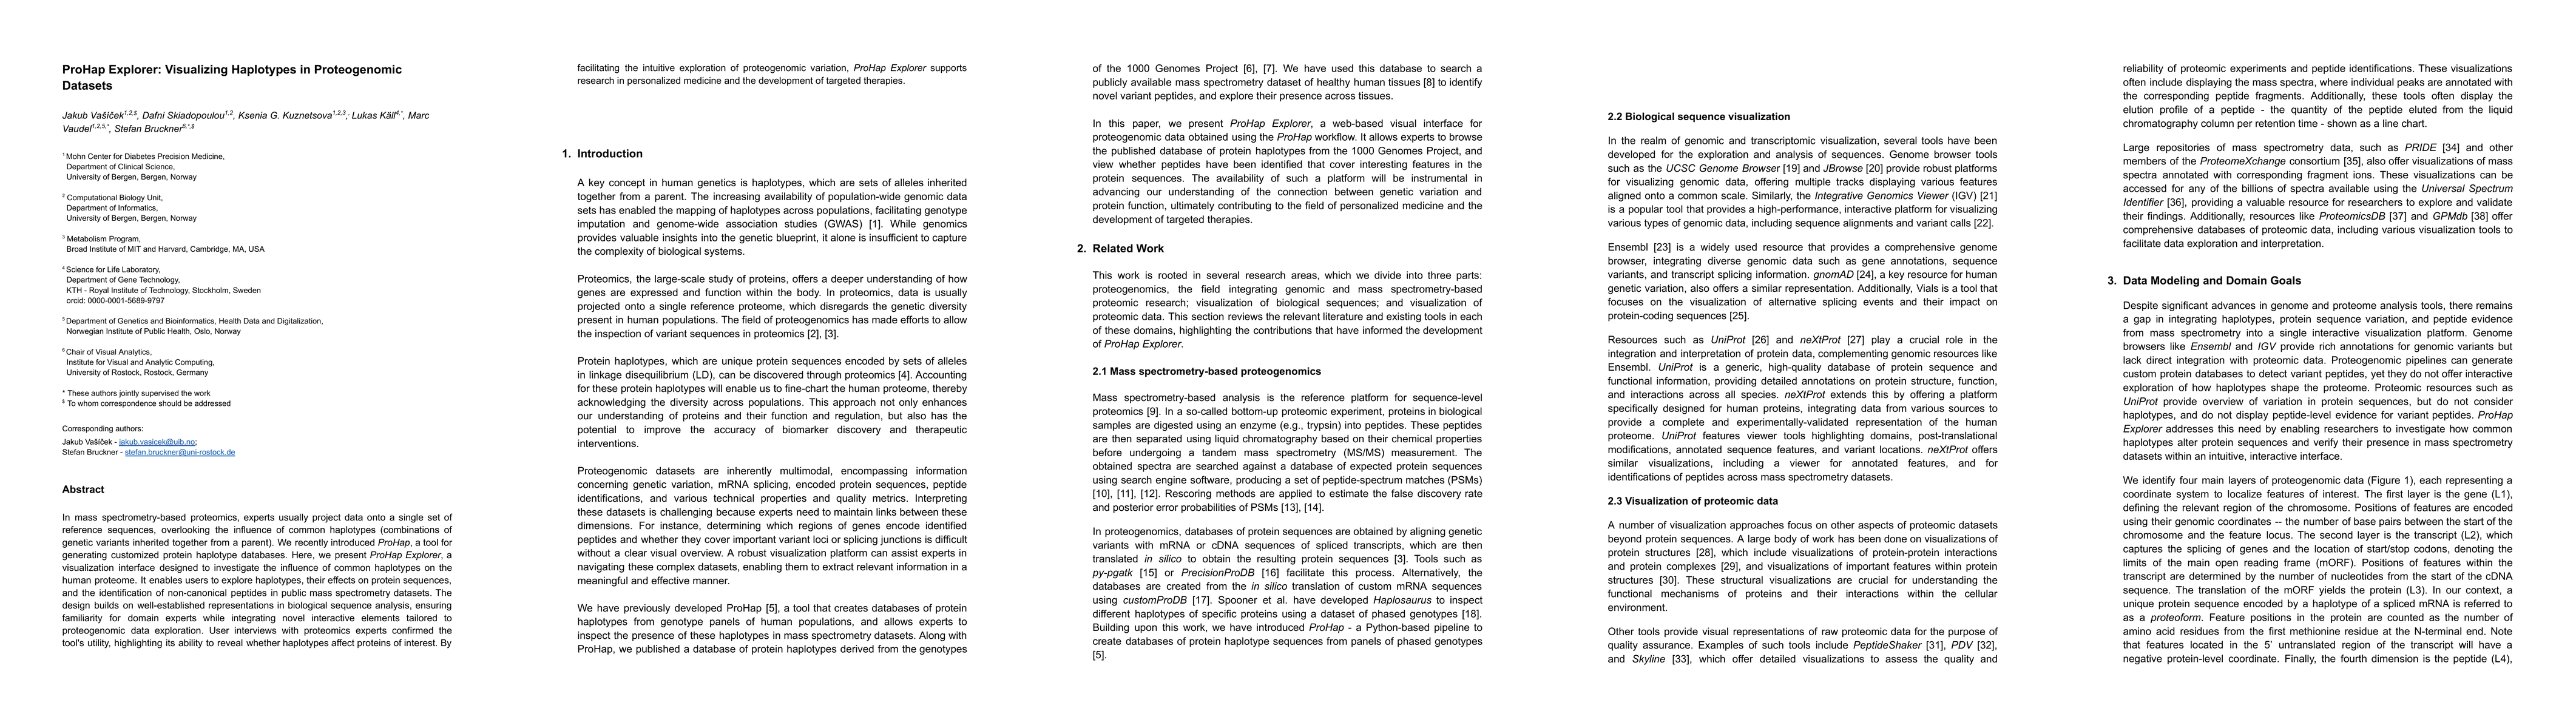
In mass spectrometry-based proteomics, experts usually project data onto a single set of reference sequences, overlooking the influence of common haplotypes (combinations of genetic variants inherited...
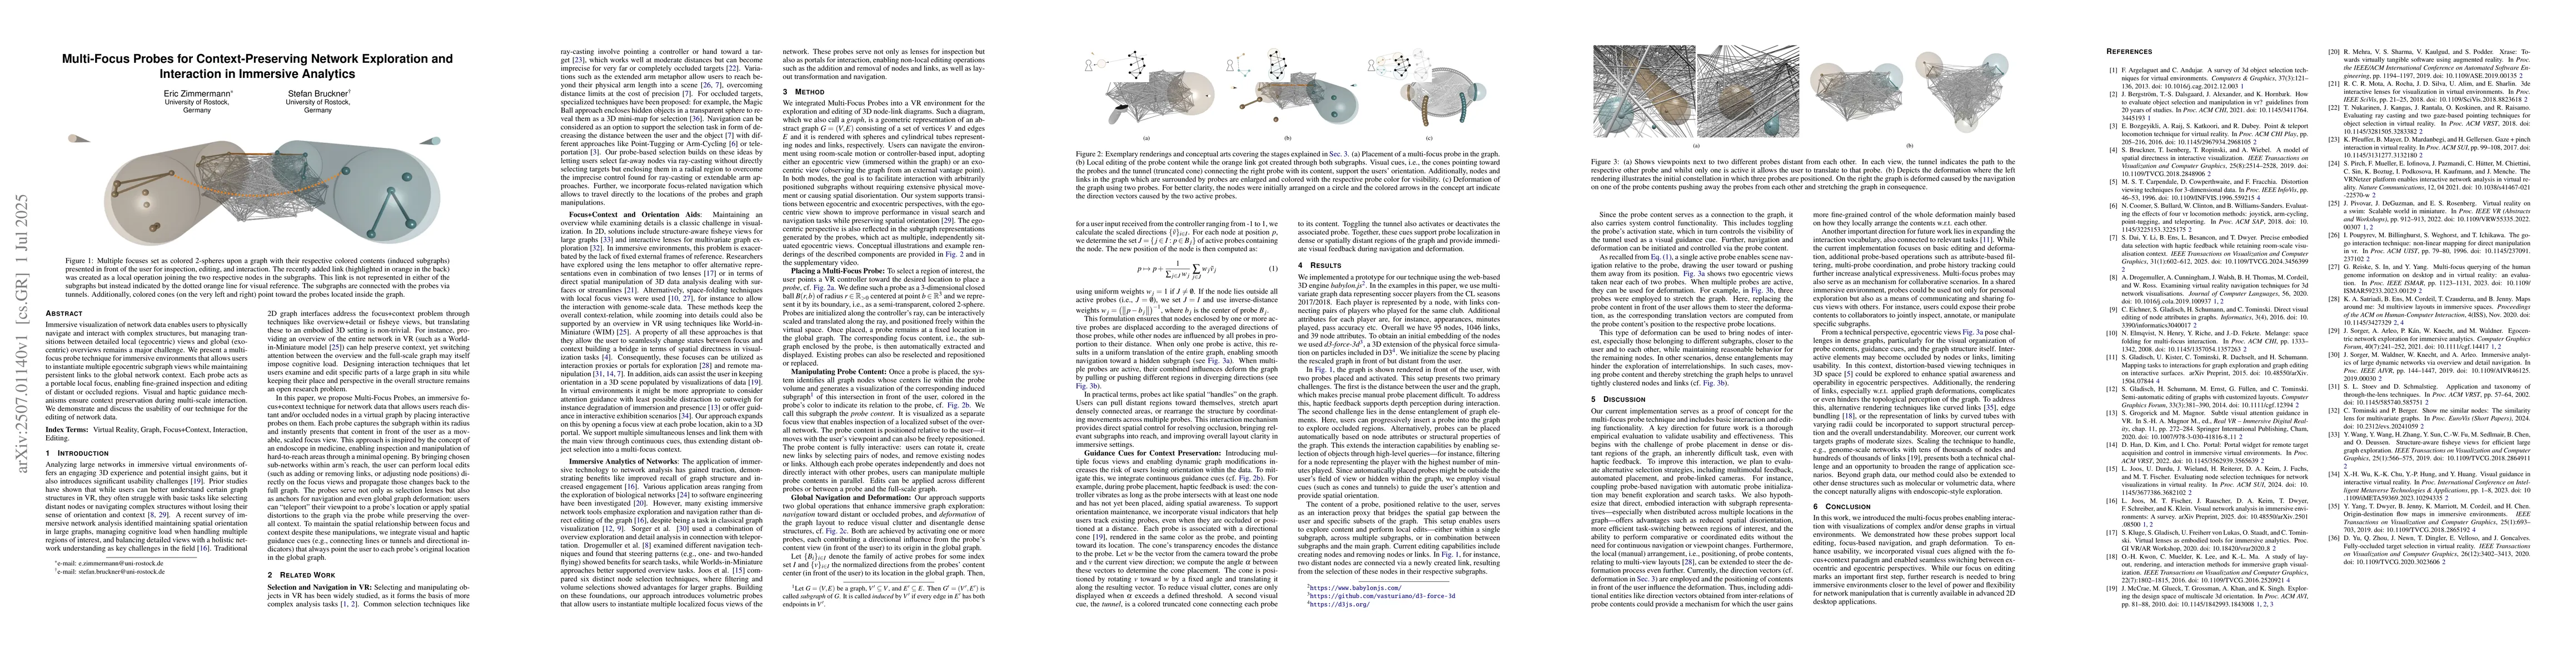
Immersive visualization of network data enables users to physically navigate and interact with complex structures, but managing transitions between detailed local (egocentric) views and global (exocen...
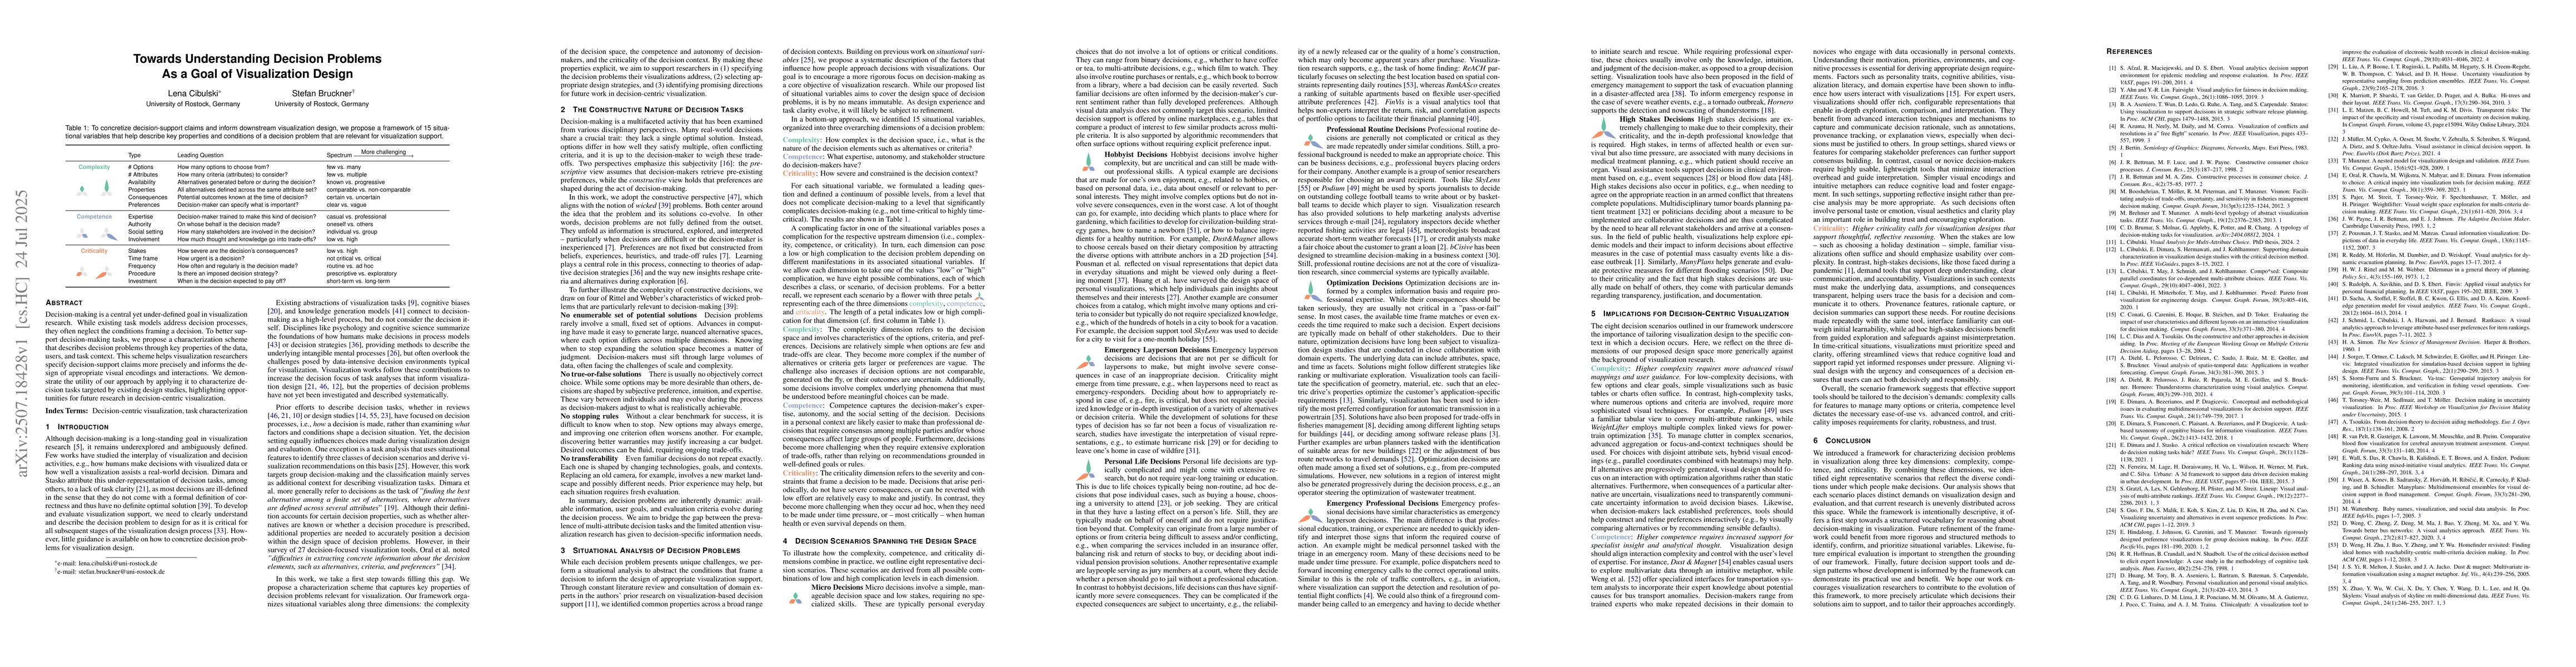
Decision-making is a central yet under-defined goal in visualization research. While existing task models address decision processes, they often neglect the conditions framing a decision. To better su...
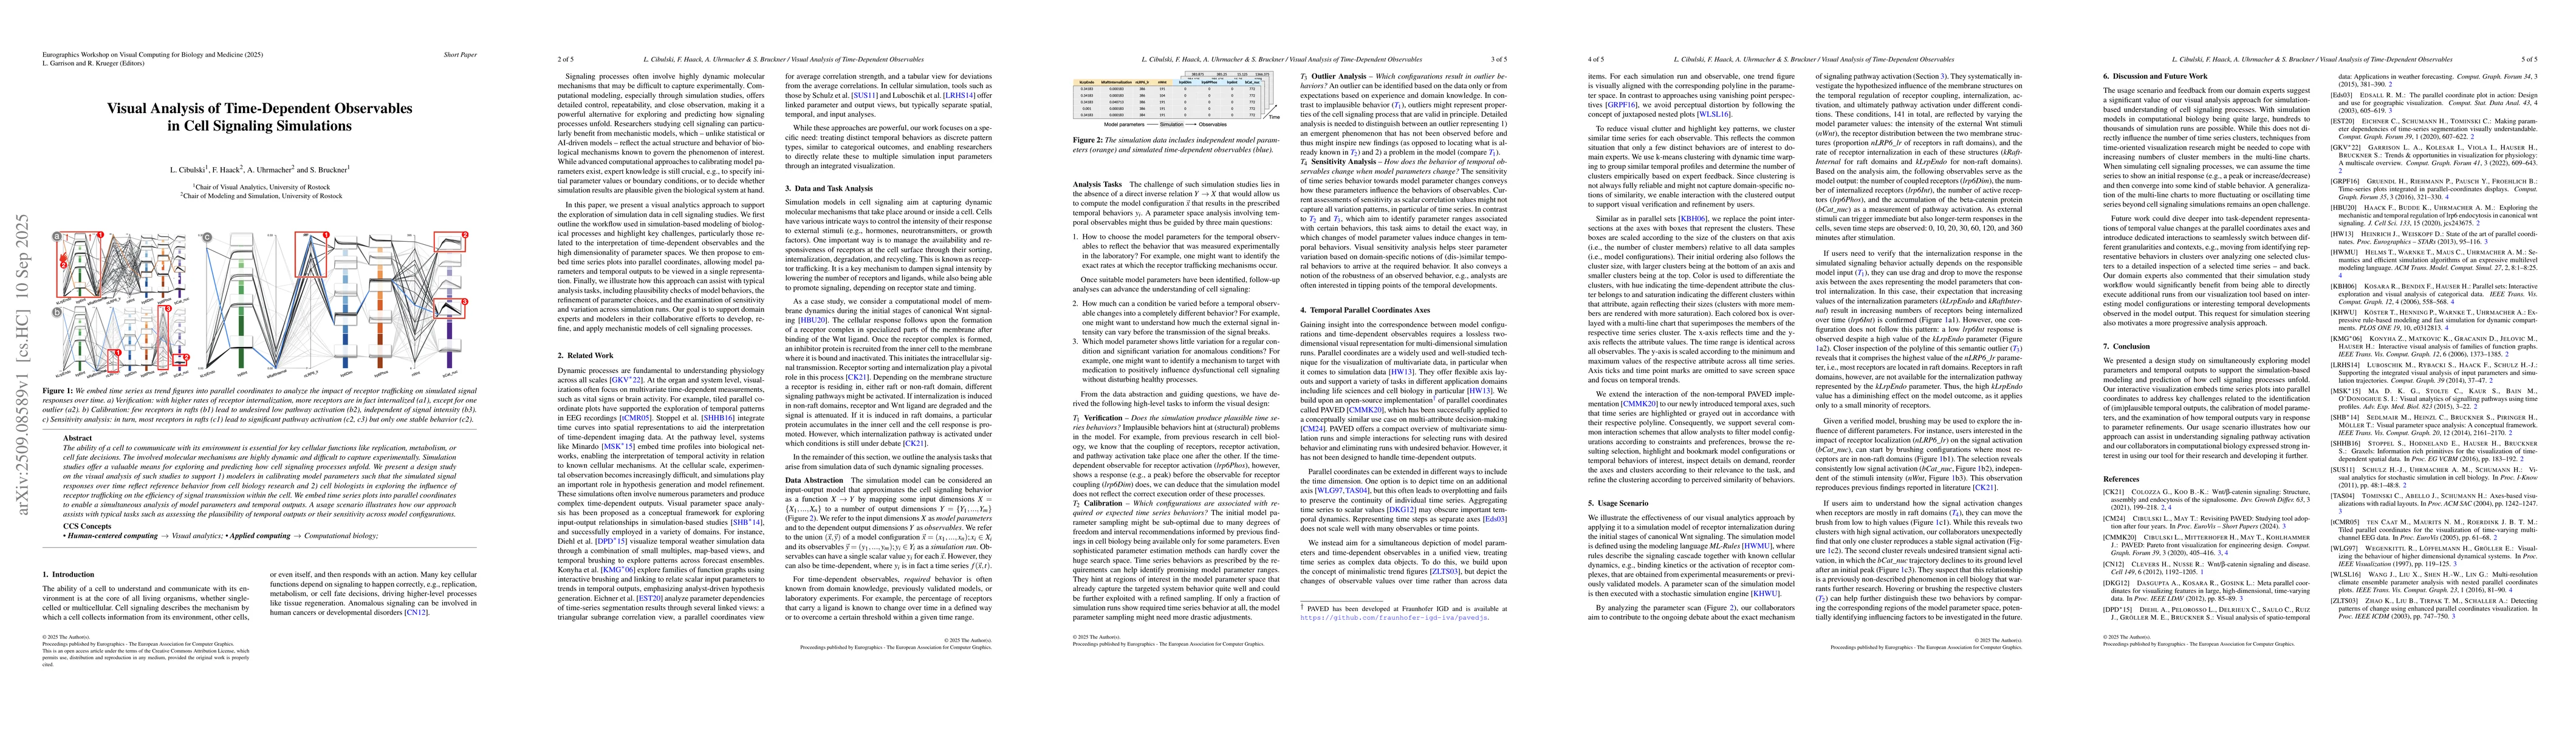
The ability of a cell to communicate with its environment is essential for key cellular functions like replication, metabolism, or cell fate decisions. The involved molecular mechanisms are highly dyn...
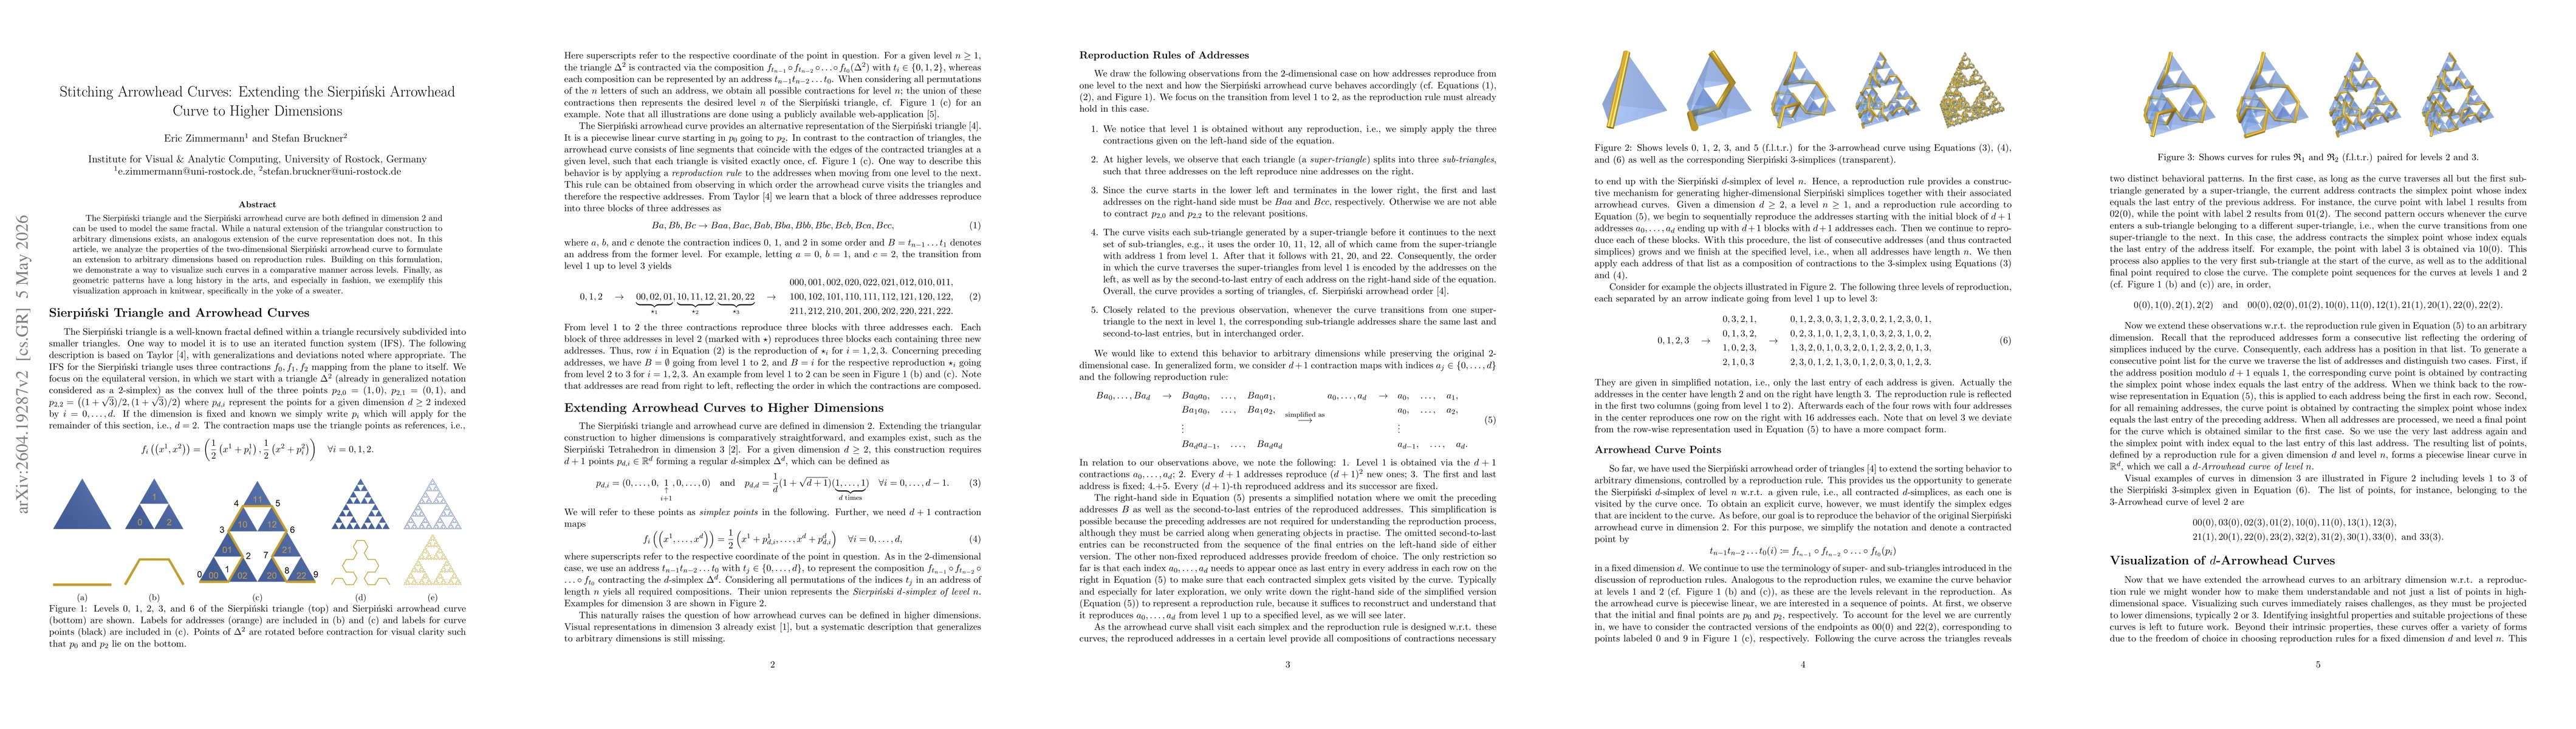
The Sierpinski triangle and the Sierpinski arrowhead curve are both defined in dimension 2 and can be used to model the same fractal. While a natural extension of the triangular construction to arbitr...