This paper explores the application of Conceptual Metaphor Theory (CMT) to scientific infographics, identifying prevalent visual metaphors used to convey complex scientific concepts. It develops a classification system for visual conceptual metaphors across diverse scientific domains and introduces a visual exploratory tool to illustrate these metaphors, highlighting ontological and orientational metaphors as the most common.
No key terms available for this paper.
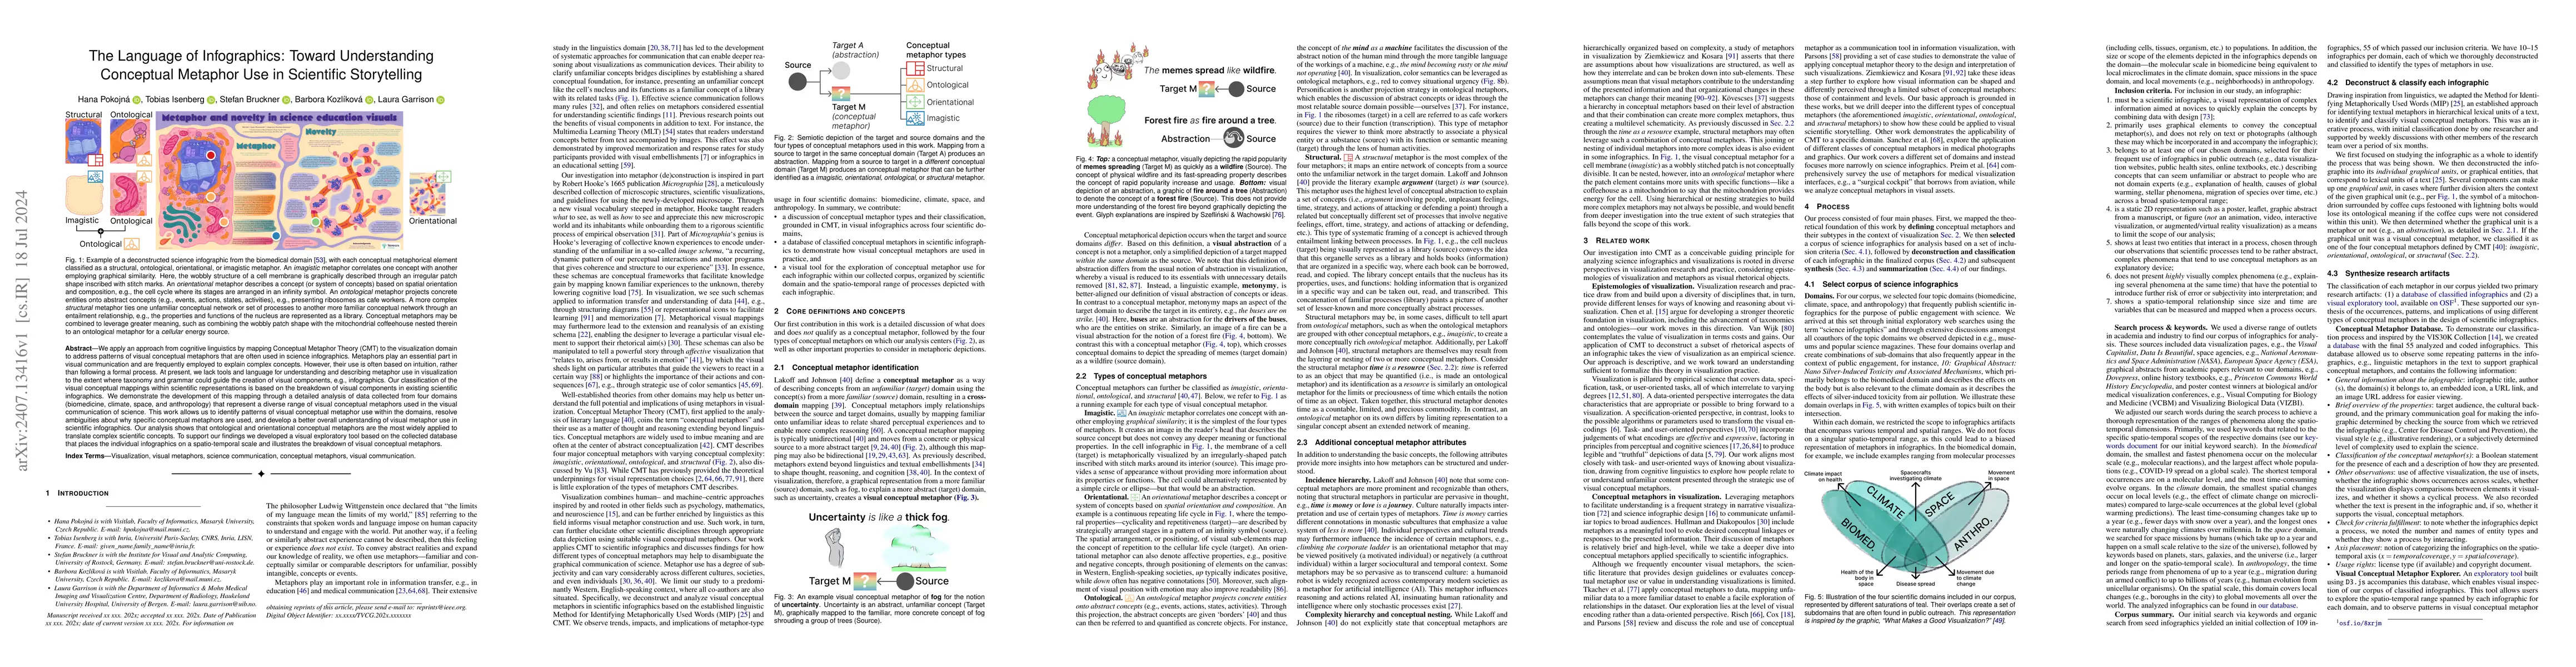
We apply an approach from cognitive linguistics by mapping Conceptual Metaphor Theory (CMT) to the visualization domain to address patterns of visual conceptual metaphors that are often used in science infographics. Metaphors play an essential part in visual communication and are frequently employed to explain complex concepts. However, their use is often based on intuition, rather than following a formal process. At present, we lack tools and language for understanding and describing metaphor use in visualization to the extent where taxonomy and grammar could guide the creation of visual components, e.g., infographics. Our classification of the visual conceptual mappings within scientific representations is based on the breakdown of visual components in existing scientific infographics. We demonstrate the development of this mapping through a detailed analysis of data collected from four domains (biomedicine, climate, space, and anthropology) that represent a diverse range of visual conceptual metaphors used in the visual communication of science. This work allows us to identify patterns of visual conceptual metaphor use within the domains, resolve ambiguities about why specific conceptual metaphors are used, and develop a better overall understanding of visual metaphor use in scientific infographics. Our analysis shows that ontological and orientational conceptual metaphors are the most widely applied to translate complex scientific concepts. To support our findings we developed a visual exploratory tool based on the collected database that places the individual infographics on a spatio-temporal scale and illustrates the breakdown of visual conceptual metaphors.
This graph shows how this paper is connected to other research. The current paper is shown in dark gray, papers that cite it are in green, and papers it references are in blue. You can:
• Hover over any node to see the paper title
• Click a node to view that paper's details
• Drag nodes to rearrange the graph
• Use the zoom controls (bottom right) to zoom in/out
No citations found for this paper.
Title | Authors | Year | Actions |
---|---|---|---|
Color Semantics in Human Cognition
|
Karen B. Schloss
|
2023
|
View Paper |
A Survey of Medical Visualization Through the Lens of Metaphors
|
B. Preim, M. Meuschke, V. Weiß
|
2023
|
View Paper |
Seeing the unseen: Comparison study of representation approaches for biochemical processes in education
|
Hana Pokojná, B. Kozlíková, Drew Berry, Simone Kriglstein, Katarína Furmanová
|
2023
|
View Paper |
Affective Visualization Design: Leveraging the Emotional Impact of Data
|
Xingyu Lan, Yanqiu Wu, Nan Cao
|
2023
|
View Paper |
MetaGlyph: Automatic Generation of Metaphoric Glyph-based Visualization
|
Lu Ying, Xinhuan Shu, Dazhen Deng, Yuchen Yang, Tan Tang, Lingyun Yu, Yingcai Wu
|
2022
|
View Paper |
Metaphorical Visualization: Mapping Data to Familiar Concepts
|
Gleb Tkachev, René Cutura, M. Sedlmair, S. Frey, T. Ertl
|
2022
|
View Paper |
Artificial intelligence in fiction: between narratives and metaphors
|
Isabella Hermann
|
2021
|
View Paper |
Affective Palettes for Scientific Visualization: Grounding Environmental Data in the Natural World
|
F. Samsel, G. Abram, Stephanie Zeller, Daniel F. Keefe
|
2021
|
View Paper |
Conceptual Metaphor and Graphical Convention Influence the Interpretation of Line Graphs
|
Greg Woodin, Bodo Winter, Lace M. K. Padilla
|
2021
|
View Paper |
How to Represent Abstract Concepts? From the Perspective of Conceptual Metaphor Theory
|
Yanli Huang
|
2020
|
View Paper |
Calling Bullshit: The Art of Skepticism in a Data-Driven World
|
2020
|
View Paper | |
VIS30K: A Collection of Figures and Tables From IEEE Visualization Conference Publications
|
Jian Chen, Meng Ling, Rui Li, Petra Isenberg, Tobias Isenberg, M. Sedlmair, Torsten Möller, R. Laramee, Han-Wei Shen, Katharina Wünsche, Qiru Wang
|
2020
|
View Paper |
Visual Abstraction
|
I. Viola, Min Chen, Tobias Isenberg
|
2019
|
View Paper |
A Model of Spatial Directness in Interactive Visualization
|
S. Bruckner, Tobias Isenberg, T. Ropinski, Alexander Wiebel
|
2019
|
View Paper |
Epigenetic metaphors: an interdisciplinary translation of encoding and decoding
|
Aviad E. Raz, Gaëlle Pontarotti, J. Weitzman
|
2019
|
View Paper |
Pondering the Concept of Abstraction in (Illustrative) Visualization
|
I. Viola, Tobias Isenberg
|
2018
|
View Paper |
Metamorphers: storytelling templates for illustrative animated transitions in molecular visualization
|
J. Sorger, P. Mindek, P. Rautek, E. Gröller, G. Johnson, I. Viola
|
2017
|
View Paper |
Metaphor: The Journey from Bidirectionality to Unidirectionality
|
Roy Porat, Yeshayahu Shen
|
2017
|
View Paper |
The Bidirectionality of Metaphor
|
M. Danesi
|
2017
|
View Paper |
Translating Communism for Children: Fables and Posters of the Revolution
|
S. Oushakine
|
2016
|
View Paper |
The impact of metaphors on information visualization
|
Yi-Na Li, Dong-Jin Li, Kang Zhang
|
2016
|
View Paper |
Unlocking the Complexity of Port Data With Visualization
|
Quang Vinh Nguyen, Kang Zhang, S. Simoff
|
2015
|
View Paper |
An Algebraic Process for Visualization Design
|
G. Kindlmann, C. Scheidegger
|
2014
|
View Paper |
Emotional design in multimedia learning: Effects of shape and color on affect and learning
|
J. Plass, Steffi Heidig, Elizabeth O. Hayward, B. Homer, Enjoon Um
|
2014
|
View Paper |
A Design Space of Visualization Tasks
|
Hans-Jörg Schulz, T. Nocke, M. Heitzler, H. Schumann
|
2013
|
View Paper |
A Multi-Level Typology of Abstract Visualization Tasks
|
M. Brehmer, T. Munzner
|
2013
|
View Paper |
What Makes a Visualization Memorable?
|
M. Borkin, Azalea A. Vo, Z. Bylinskii, Phillip Isola, Shashank Sunkavalli, A. Oliva, H. Pfister
|
2013
|
View Paper |
Selecting Semantically‐Resonant Colors for Data Visualization
|
Sharon Lin, Julie Fortuna, Chinmay Kulkarni, M. Stone, Jeffrey Heer
|
2013
|
View Paper |
An Empirical Study on Using Visual Embellishments in Visualization
|
R. Borgo, Alfie Abdul-Rahman, Farhan Mohamed, P. W. Grant, I. Reppa, L. Floridi, Min Chen
|
2012
|
View Paper |
Visualization Rhetoric: Framing Effects in Narrative Visualization
|
J. Hullman, N. Diakopoulos
|
2011
|
View Paper |
A metaphor-enriched social cognition.
|
M. Landau, Brian P. Meier, Lucas A. Keefer
|
2010
|
View Paper |
Narrative Visualization: Telling Stories with Data
|
E. Segel, Jeffrey Heer
|
2010
|
View Paper |
Semiology of Graphics - Diagrams, Networks, Maps
|
Jacques Bertin, William J. Berg
|
2010
|
View Paper |
Crowdsourcing graphical perception: using mechanical turk to assess visualization design
|
Jeffrey Heer, M. Bostock
|
2010
|
View Paper |
Preconceptions and Individual Differences in Understanding Visual Metaphors
|
Caroline Ziemkiewicz, Robert Kosara
|
2009
|
View Paper |
A Pedagogy of Sight: Microscopic Vision in Robert Hooke's Micrographia
|
J. Jack
|
2009
|
View Paper |
The Shaping of Information by Visual Metaphors
|
Caroline Ziemkiewicz, Robert Kosara
|
2008
|
View Paper |
On the role of metaphor in information visualization
|
John S. Risch
|
2008
|
View Paper |
The Stuff of Thought: Language as a Window into Human Nature
|
S. Hannabuss
|
2008
|
View Paper |
Metaphors as a Bridge to Understanding Educational and Social Contexts
|
Devon Jensen
|
2006
|
View Paper |
The value of visualization
|
J. V. Wijk
|
2005
|
View Paper |
A Taxonomic Analysis of User-Interface Metaphors in the Microsoft O ce Project Gallery
|
Pippin Barr, Rilla Khaled, J. Noble, R. Biddle
|
2005
|
View Paper |
Designing interaction, not interfaces
|
M. Beaudouin-Lafon
|
2004
|
View Paper |
Why the Sunny Side Is Up
|
Brian P. Meier, Michael D. Robinson
|
2004
|
View Paper |
Making Truth: METAPHOR IN SCIENCE
|
Theodore L. Brown
|
2003
|
View Paper |
Once Upon a Time…
|
2003
|
View Paper | |
The Craft of Information Visualization: Readings and Reflections
|
B. Bederson, B. Shneiderman
|
2003
|
View Paper |
Individualism-collectivism and personality.
|
H. Triandis
|
2001
|
View Paper |
Metaphoric structuring: understanding time through spatial metaphors
|
L. Boroditsky
|
2000
|
View Paper |
Cognitive Principles of Multimedia Learning: The Role of Modality and Contiguity
|
R. Moreno, R. Mayer
|
1999
|
View Paper |
The Contemporary Theory of Metaphor
|
G. Lakoff
|
1993
|
View Paper |
Generating a Specific Class of Metaphors
|
M. Jones
|
1992
|
View Paper |
The Body in the Mind: The Bodily Basis of Meaning, Imagination, and Reason
|
Janet Keller, Mark H. Johnson
|
1988
|
View Paper |
Cognitive Load During Problem Solving: Effects on Learning
|
J. Sweller
|
1988
|
View Paper |
Automating the design of graphical presentations of relational information
|
J. Mackinlay
|
1986
|
View Paper |
A Study of Color Association Differences between Americans and Japanese.
|
K. Kitao, S. Kitao
|
1986
|
View Paper |
The Visual Display of Quantitative Information
|
E. Tufte
|
1985
|
View Paper |
Graphical Perception: Theory, Experimentation, and Application to the Development of Graphical Methods
|
W. Cleveland, R. McGill
|
1984
|
View Paper |
Metaphors We Live by
|
J. Lawler, G. Lakoff, Mark Johnson
|
1982
|
View Paper |
What Metaphors Mean
|
D. Davidson
|
1978
|
View Paper |
How We Conceptualize Epidemic--Visual Metaphors of COVID-19 in Editorial Cartoons
|
Xiaowen Xiao, Yifei Li
|
2021
|
View Paper |
Infographics as a promising tool for teaching and learning
|
2021
|
||
The Curious Case of Combining Text and Visualization
|
Alvitta Ottley, Aleksandra Kaszowska, R. Crouser, Evan M. Peck
|
2019
|
View Paper |
Metaphor and Metonymy in a Culture of Food and Feasting: A Study Based on Selected Ancient Greek Comedies
|
Waldemar Szefliński, W. Wachowski
|
2019
|
View Paper |
Visual metaphors in representing medical knowledge
|
Maribel Tercedor Sánchez
|
2019
|
View Paper |
Pathways for Theoretical Advances in Visualization
|
Min Chen, G. Grinstein, Chris R. Johnson, J. Kennedy, Melanie Tory
|
2017
|
View Paper |
Conceptual metaphor types in oncology: Cognitive and communicative functions
|
I. N. Ferrando
|
2017
|
View Paper |
Conceptual Metaphor Theory and Classical Theory: Affinities Rather than Divergences
|
J. Mácha
|
2016
|
View Paper |
Structural, orientational, ontological conceptual metaphors and implications for language teaching
|
2015
|
||
A matter of time: Applying a data-users-tasks design triangle to visual analytics of time-oriented data
|
S. Miksch, W. Aigner
|
2014
|
View Paper |
Knowledge Is Beautiful
|
David McCandless
|
2013
|
View Paper |
Journal of Personality and Social Psychology Bidirectionality , Mediation , and Moderation of Metaphorical Effects : The Embodiment of Social Suspicion and Fishy Smells
|
Spike W. S. Lee, N. Schwarz
|
2012
|
View Paper |
The Power of Infographics: Using Pictures to Communicate and Connect with your Audiences
|
2012
|
||
Understanding the structure of information visualization through visual metaphors
|
Robert Kosara, Caroline Ziemkiewicz
|
2010
|
View Paper |
MIP: A method for identifying metaphorically used words in discourse
|
G. Steen, L. Cameron, A. Cienki, P. Crisp, A. Deignan, R. Gibbs, J. Grady, Z. Kövecses, G. Low, E. Semino
|
2007
|
View Paper |
Metaphoric Mappings: the Art of Visualization
|
P. Fishwick
|
2006
|
View Paper |
Alignment in the Processing of Metaphor
|
Дедсе Сеп
|
2004
|
View Paper |
Logisch-philosophische Abhandlung = Tractatus logico-philosophicus
|
Ludwig Wittgenstein, J. Schulte
|
2003
|
View Paper |
Metaphor: A Practical Introduction
|
Z. Kövecses, R. Benczes
|
2002
|
View Paper |
Mappings in thought and language
|
G. Fauconnier
|
1997
|
View Paper |
Speech Acts: An Essay in the Philosophy of Language
|
J. Searle
|
1969
|
View Paper |
Ascending and Descending
|
1960
|
||
Laws of organization in perceptual forms.
|
M. Wertheimer
|
1938
|
View Paper |
Conceptual Metaphor
|
P. Richardson, C. Mueller, Stephen Pihlaja
|
View Paper | |
of Experimental Psychology
|
George Peabody College, Drs. J. Peterson, S. C. Garrison, M. R. Schneck, J. E. Caster, O. A. Simley, W. F. Smith, Miss M. Nichol
|
View Paper | |
primarily uses graphical elements to convey the conceptual metaphor(s), and does not rely on text or photographs (although these may which be incorporated in and accompany the infographic)
|
|||
must be a scientific infographic, a visual representation of complex information aimed at novices to quickly explain the concepts by combining data with design
|
|||
the database of analyzed infographics and infographics that were shortlisted but excluded from the final analysis for failing to meet all inclusion criteria
|
|||
Micrographia: or, Some physiological descriptions of minute bodies made by magnifying glasses . J. Martyn and J. Allestry, London, 1665
|
|||
Human cell – A molecular city
|
|||
TAT: Toughening the Foundation of Abstraction in Visualization Techniques
|
|||
Metaphor and novelty in science education vizuals
|
|||
is a static 2D representation such as a poster, leaflet, graphic abstract from a manuscript,
|
Showing first page preview. Click "Open Full PDF" to view the complete paper.
Oliver Kramer
Published: 2025-02-04
Abhanshu Sharma, Jindong Chen, Hassan Mansoor, Victor Cărbune, Gilles Baechler, Fedir Zubach, Jason Lin, Maria Wang, Srinivas Sunkara, Vincent Etter
Published: 2024-02-20
Xiaoyu Tong, Ekaterina Shutova, Rochelle Choenni, Martha Lewis
Published: 2024-03-19
You need to log in to post a comment.
Your comment contains inappropriate language.
Are you sure you want to remove this tag?
Someone just favorited a paper!
Comments (0)