Summary

The ability of a cell to communicate with its environment is essential for key cellular functions like replication, metabolism, or cell fate decisions. The involved molecular mechanisms are highly dynamic and difficult to capture experimentally. Simulation studies offer a valuable means for exploring and predicting how cell signaling processes unfold. We present a design study on the visual analysis of such studies to support 1) modelers in calibrating model parameters such that the simulated signal responses over time reflect reference behavior from cell biology research and 2) cell biologists in exploring the influence of receptor trafficking on the efficiency of signal transmission 
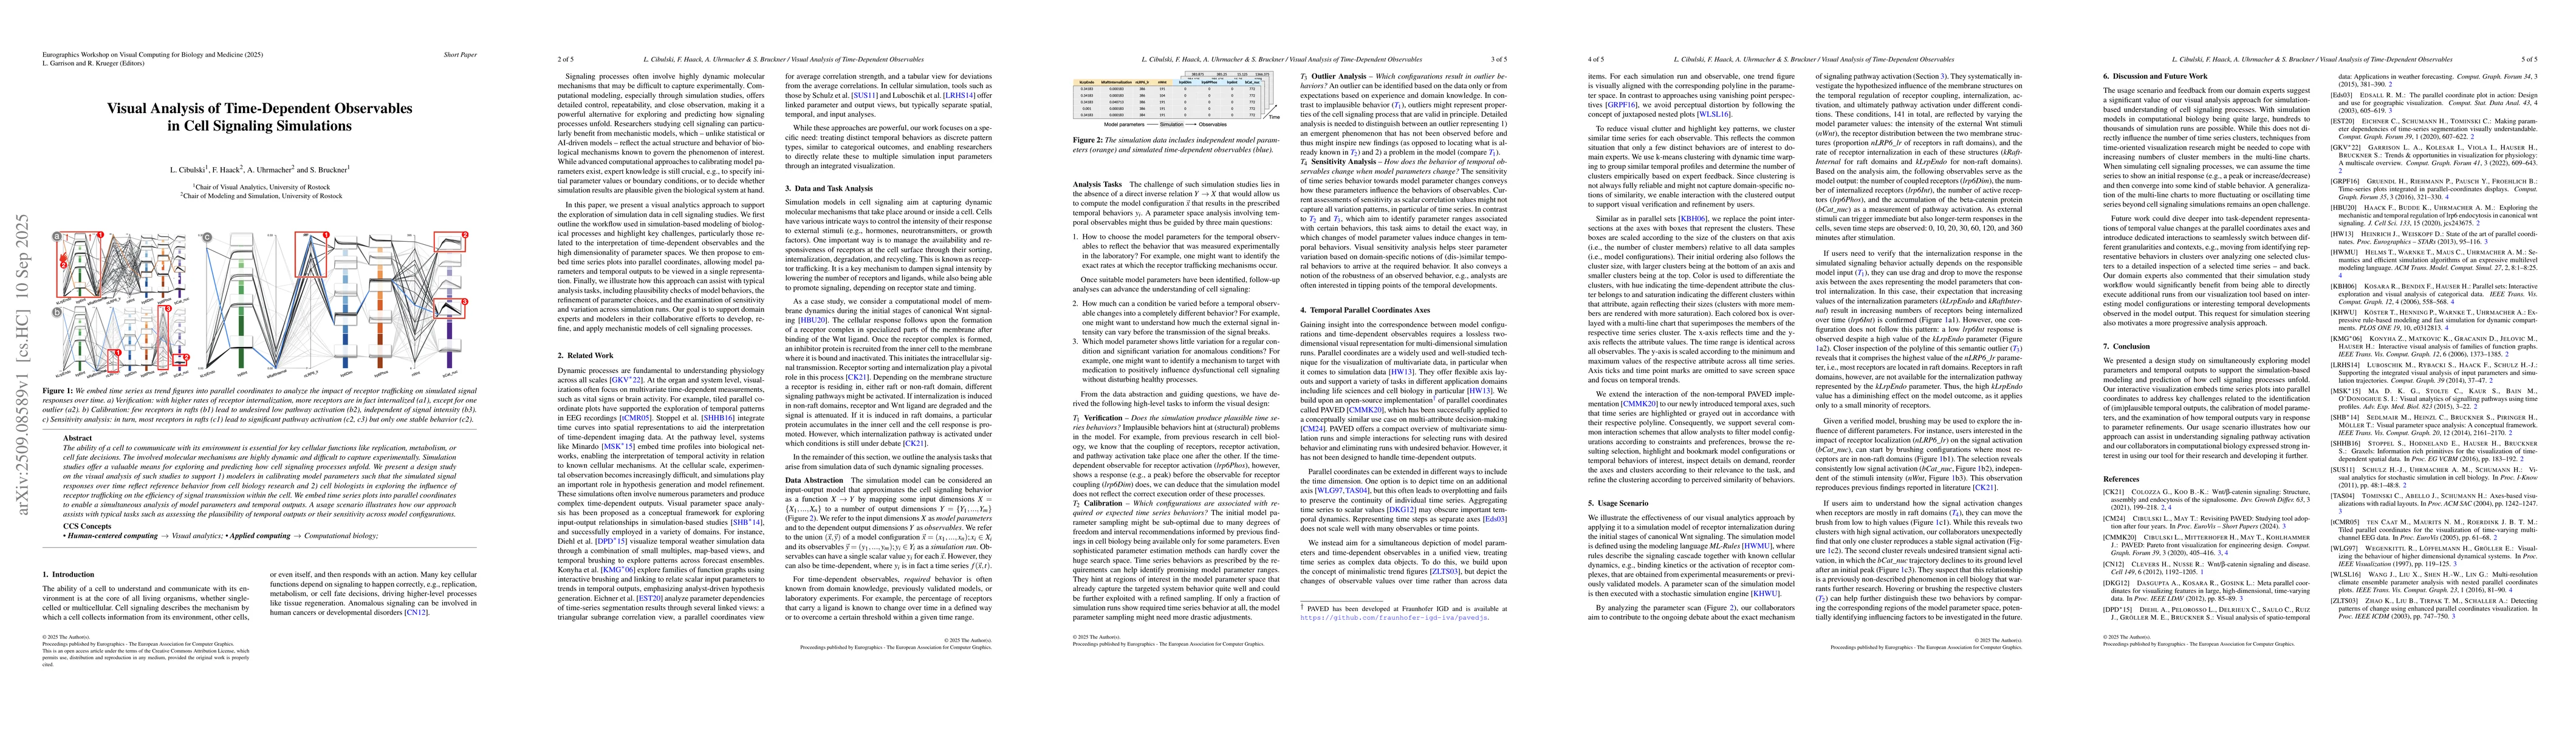
within the cell. We embed time series plots into parallel coordinates to enable a simultaneous analysis of model parameters and temporal outputs. A usage scenario illustrates how our approach assists with typical tasks such as assessing the plausibility of temporal outputs or their sensitivity across model configurations.

AI Key Findings

Generated Nov 01, 2025

Methodology

The study presents a visual analytics approach integrating time series plots into parallel coordinates to analyze simulation data from cell signaling processes. This method enables simultaneous exploration of model parameters and temporal outputs through interactive visualization techniques.

Key Results

  • The approach effectively supports model calibration by aligning simulated signal responses with reference biological behaviors.
  • It enables the identification of distinct temporal patterns as categorical outcomes, linking them to simulation input parameters.
  • The visualization aids in sensitivity analysis, showing how parameter changes affect temporal observable behaviors.

Significance

This research addresses critical challenges in interpreting dynamic biological processes by providing a tool for collaborative model refinement and hypothesis generation in cell signaling studies.

Technical Contribution

The integration of time series data into parallel coordinates through a minimalist trend figure approach, with clustering and interactive visualization for simulation analysis.

Novelty

This work introduces a unified visualization framework that simultaneously treats temporal behaviors as discrete pattern types and links them to multiple simulation input parameters through integrated visual analysis.

Limitations

  • The method may struggle with very high-dimensional parameter spaces due to visualization complexity.
  • It requires expert domain knowledge for interpreting results, which could limit accessibility for non-experts.

Future Work

  • Developing techniques to handle larger numbers of cluster members in multi-line charts for time-oriented visualization.
  • Exploring task-dependent representations of temporal value changes at parallel coordinates axes.
  • Creating dedicated interactions for seamless switching between different granularities and contexts in analysis.

Paper Details

PDF Preview

Download PDF

Comments (0)

This website uses cookies to ensure you get the best experience. Learn more