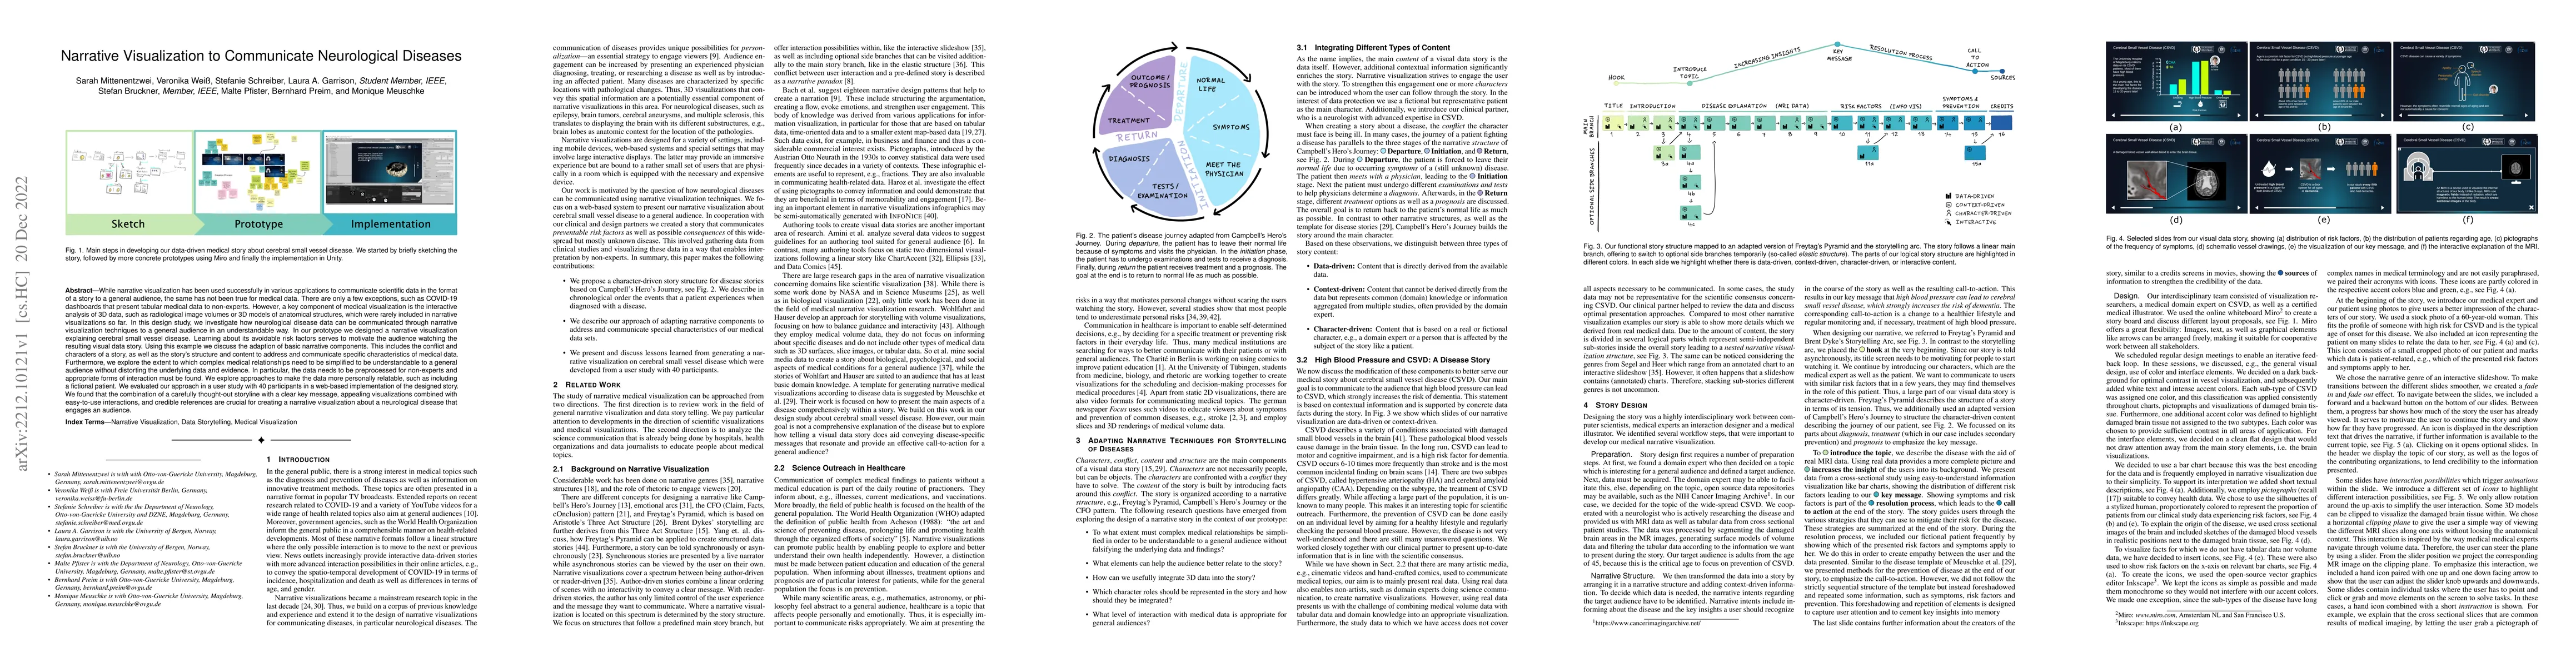
Narrative Visualization to Communicate Neurological Diseases
Publication
Metrics
AI Quick Summary
This study explores the use of narrative visualization to communicate complex neurological disease data, such as cerebral small vessel disease, to a general audience. The research emphasizes the importance of simplifying medical data while maintaining accuracy, and evaluates the effectiveness of such visualizations through user studies, highlighting the need for engaging storylines and interactive elements.
Paper Preview
Abstract
While narrative visualization has been used successfully in various applications to communicate scientific data in the format of a story to a general audience, the same has not been true for medical data. There are only a few exceptions that present tabular medical data to non-experts. However, a key component of medical visualization is the interactive analysis of 3D data, such as 3D models of anatomical structures, which were rarely included in narrative visualizations so far. In this design study, we investigate how neurological disease data can be communicated through narrative visualization techniques to a general audience in an understandable way. We designed a narrative visualization explaining cerebral small vessel disease. Learning about its avoidable risk factors serves to motivate the audience watching the resulting visual data story. Using this example, we discuss the adaption of basic narrative components. This includes the conflict and characters of a story, as well as the story's structure and content to address and communicate specific characteristics of medical data. Furthermore, we explore the extent to which complex medical relationships need to be simplified to be understandable to a general audience without distorting the underlying data and evidence. In particular, the data needs to be preprocessed for non-experts and appropriate forms of interaction must be found. We explore approaches to make the data more personally relatable, such as including a fictional patient. We evaluated our approach in a user study with 40 participants in a web-based implementation of the designed story. We found that the combination of a carefully thought-out storyline with a clear key message, appealing visualizations combined with easy-to-use interactions, and credible references are crucial for creating a narrative visualization about a neurological disease that engages an audience.
AI Key Findings
Get AI-generated insights about this paper's methodology, results, significance, and more — seven facets brought into focus.
Impact
Paper Details
Authors
PDF Preview
Key Terms
Citation Network
Current paper (gray), citations (green), references (blue)
Display is limited for performance on very large graphs.
Discussion 0