Semantic Resizing of Charts Through Generalization:A Case Study with Line Charts
Publication
Metrics
AI Quick Summary
This paper proposes a generalization technique for resizing line charts while preserving essential data semantics, inspired by cartographic principles. The algorithm determines the appropriate generalization based on spatial density and element importance, and a prototype evaluation shows successful preservation of data shape with reduced clutter.
Paper Preview
Abstract
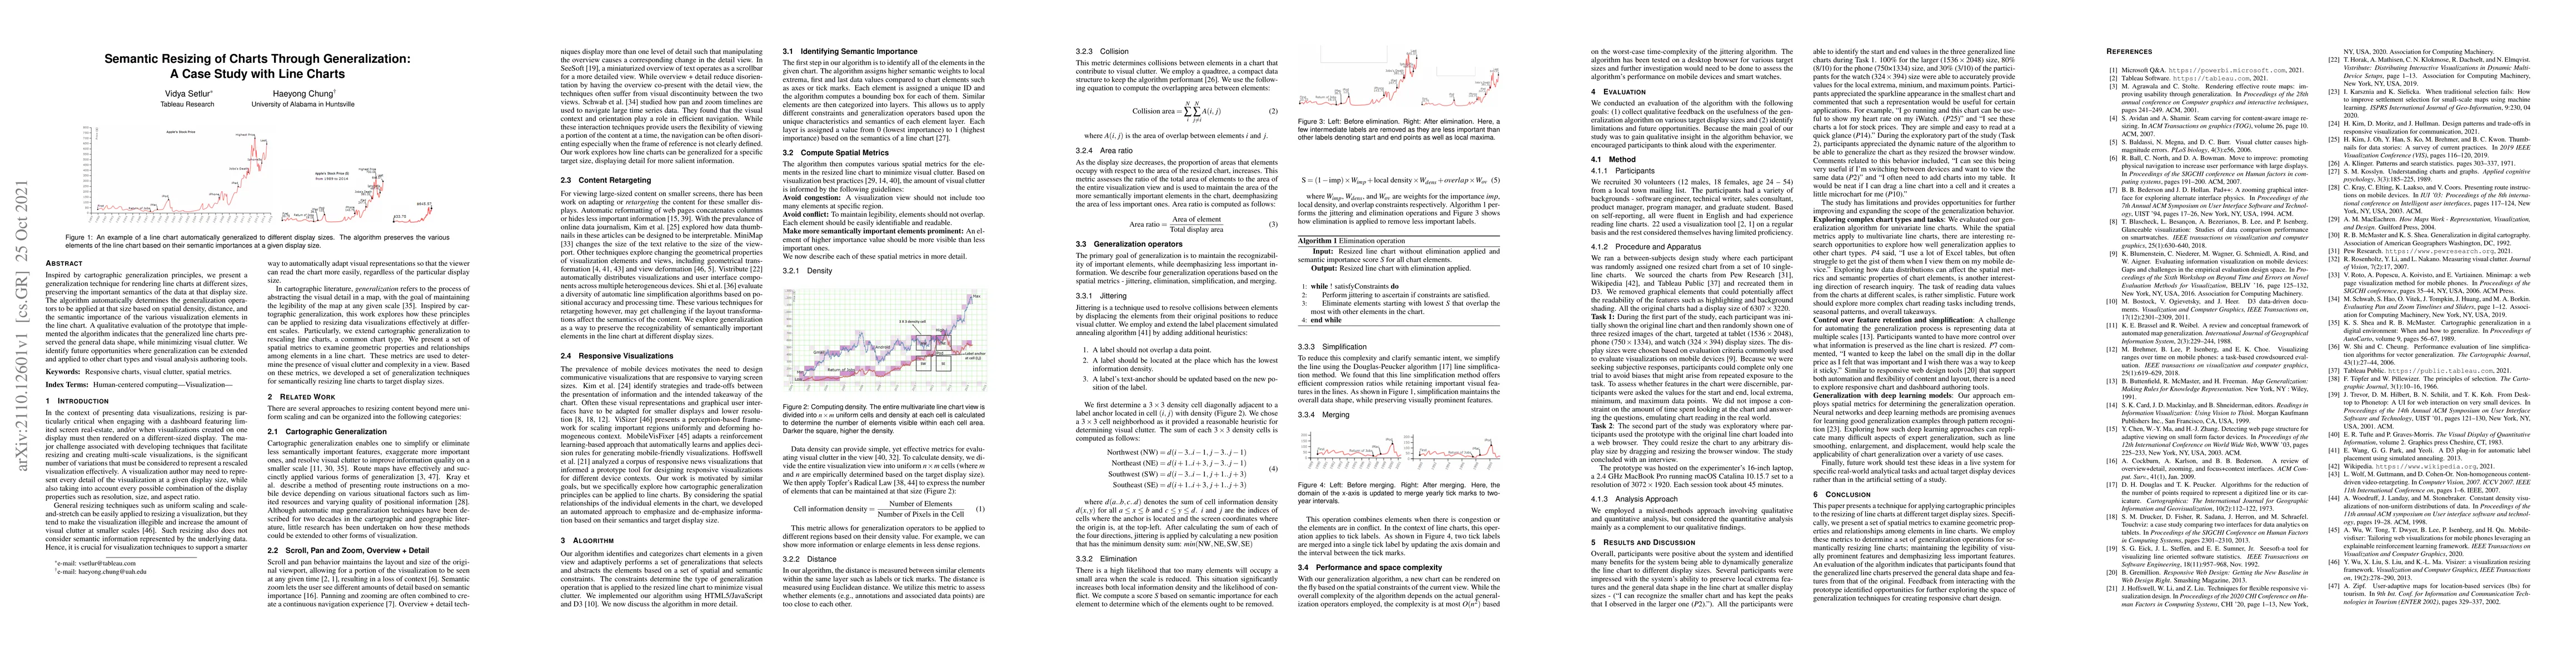
Inspired by cartographic generalization principles, we present a generalization technique for rendering line charts at different sizes, preserving the important semantics of the data at that display size. The algorithm automatically determines the generalization operators to be applied at that size based on spatial density, distance, and the semantic importance of the various visualization elements in the line chart. A qualitative evaluation of the prototype that implemented the algorithm indicates that the generalized line charts pre-served the general data shape, while minimizing visual clutter. We identify future opportunities where generalization can be extended and applied to other chart types and visual analysis authoring tools.
AI Key Findings
Get AI-generated insights about this paper's methodology, results, significance, and more — seven facets brought into focus.
Impact
Paper Details
Authors
PDF Preview
Key Terms
Citation Network
Current paper (gray), citations (green), references (blue)
Display is limited for performance on very large graphs.
Discussion 0