Publication
Metrics
AI Quick Summary
TopoLines introduces a novel topological smoothing method for line charts that retains important peaks while minimizing noise, contrasting with conventional methods that may obscure these features. The effectiveness of TopoLines is demonstrated through comparisons with five popular smoothing techniques across four application domains.
Paper Preview
Abstract
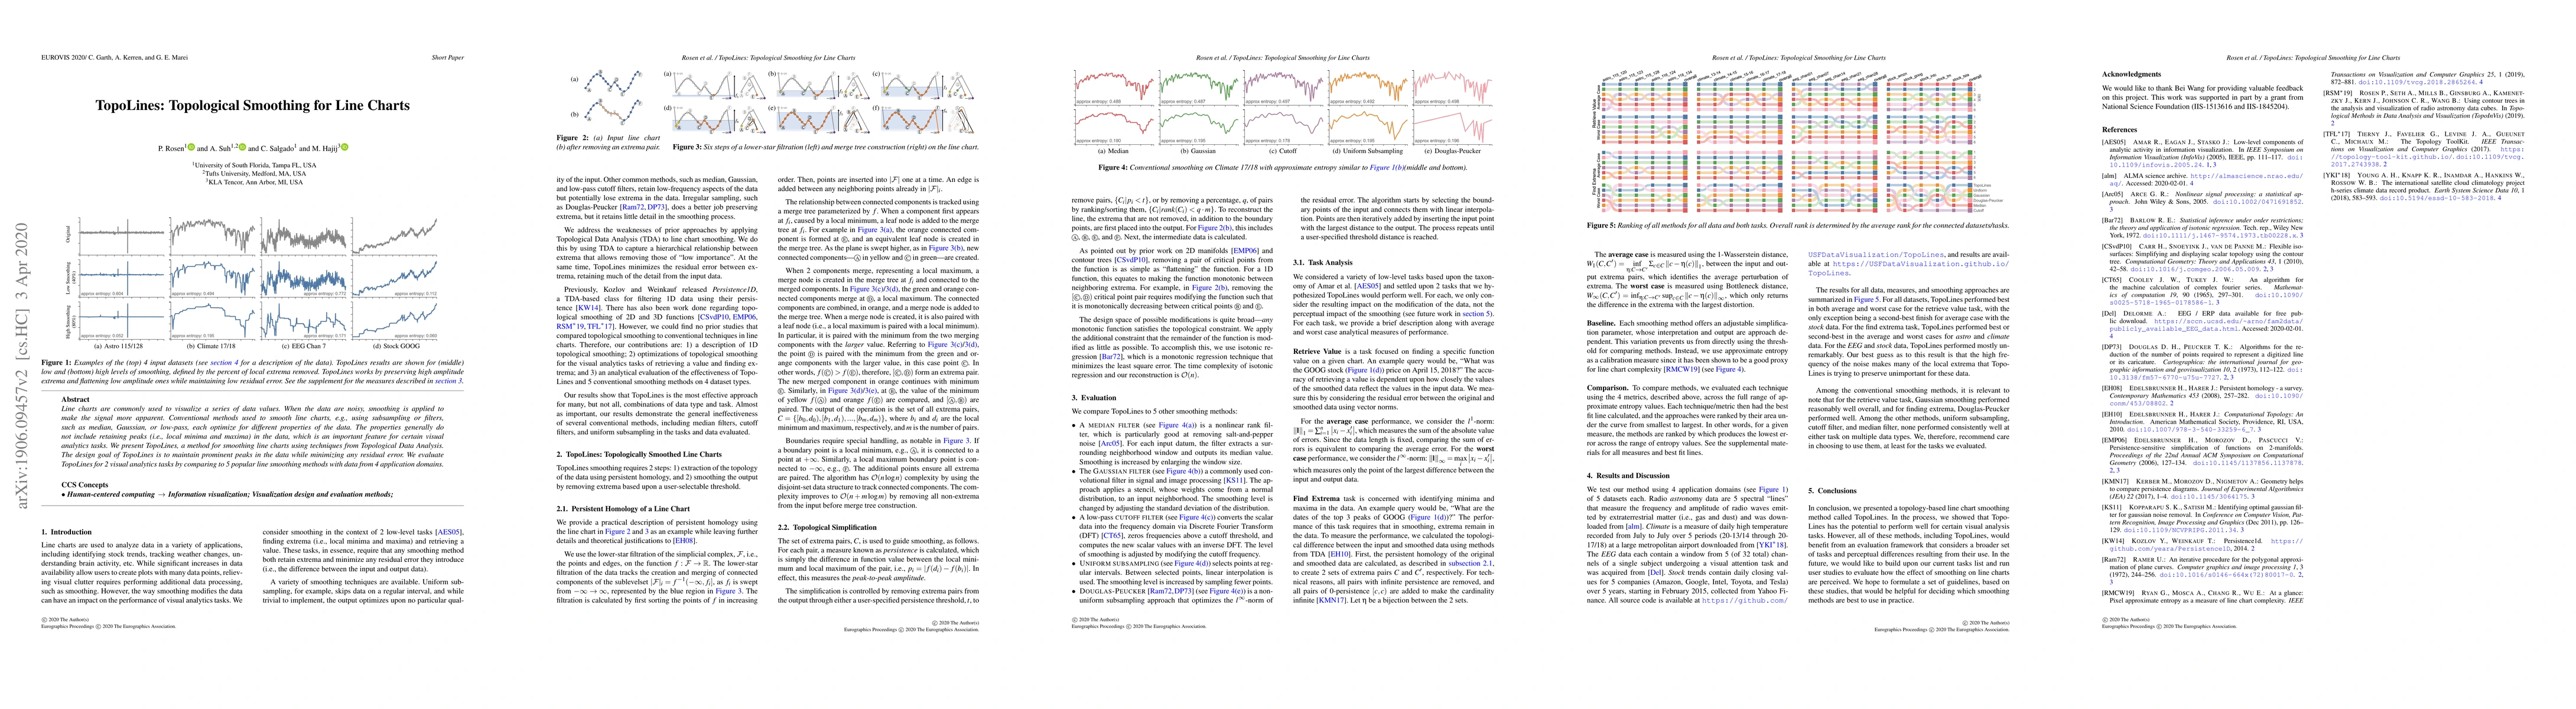
Line charts are commonly used to visualize a series of data values. When the data are noisy, smoothing is applied to make the signal more apparent. Conventional methods used to smooth line charts, e.g., using subsampling or filters, such as median, Gaussian, or low-pass, each optimize for different properties of the data. The properties generally do not include retaining peaks (i.e., local minima and maxima) in the data, which is an important feature for certain visual analytics tasks. We present TopoLines, a method for smoothing line charts using techniques from Topological Data Analysis. The design goal of TopoLines is to maintain prominent peaks in the data while minimizing any residual error. We evaluate TopoLines for 2 visual analytics tasks by comparing to 5 popular line smoothing methods with data from 4 application domains.
AI Key Findings
Get AI-generated insights about this paper's methodology, results, significance, and more — seven facets brought into focus.
Impact
Paper Details
Authors
PDF Preview
Key Terms
Citation Network
Current paper (gray), citations (green), references (blue)
Display is limited for performance on very large graphs.
Discussion 0