This study investigates how readers integrate line charts and accompanying captions to derive key takeaways. Findings show that readers prioritize high-prominence features when both chart and caption emphasize them, while they rely on the chart to highlight higher-prominence features when captions describe low-prominence aspects. External contextual information enhances understanding.
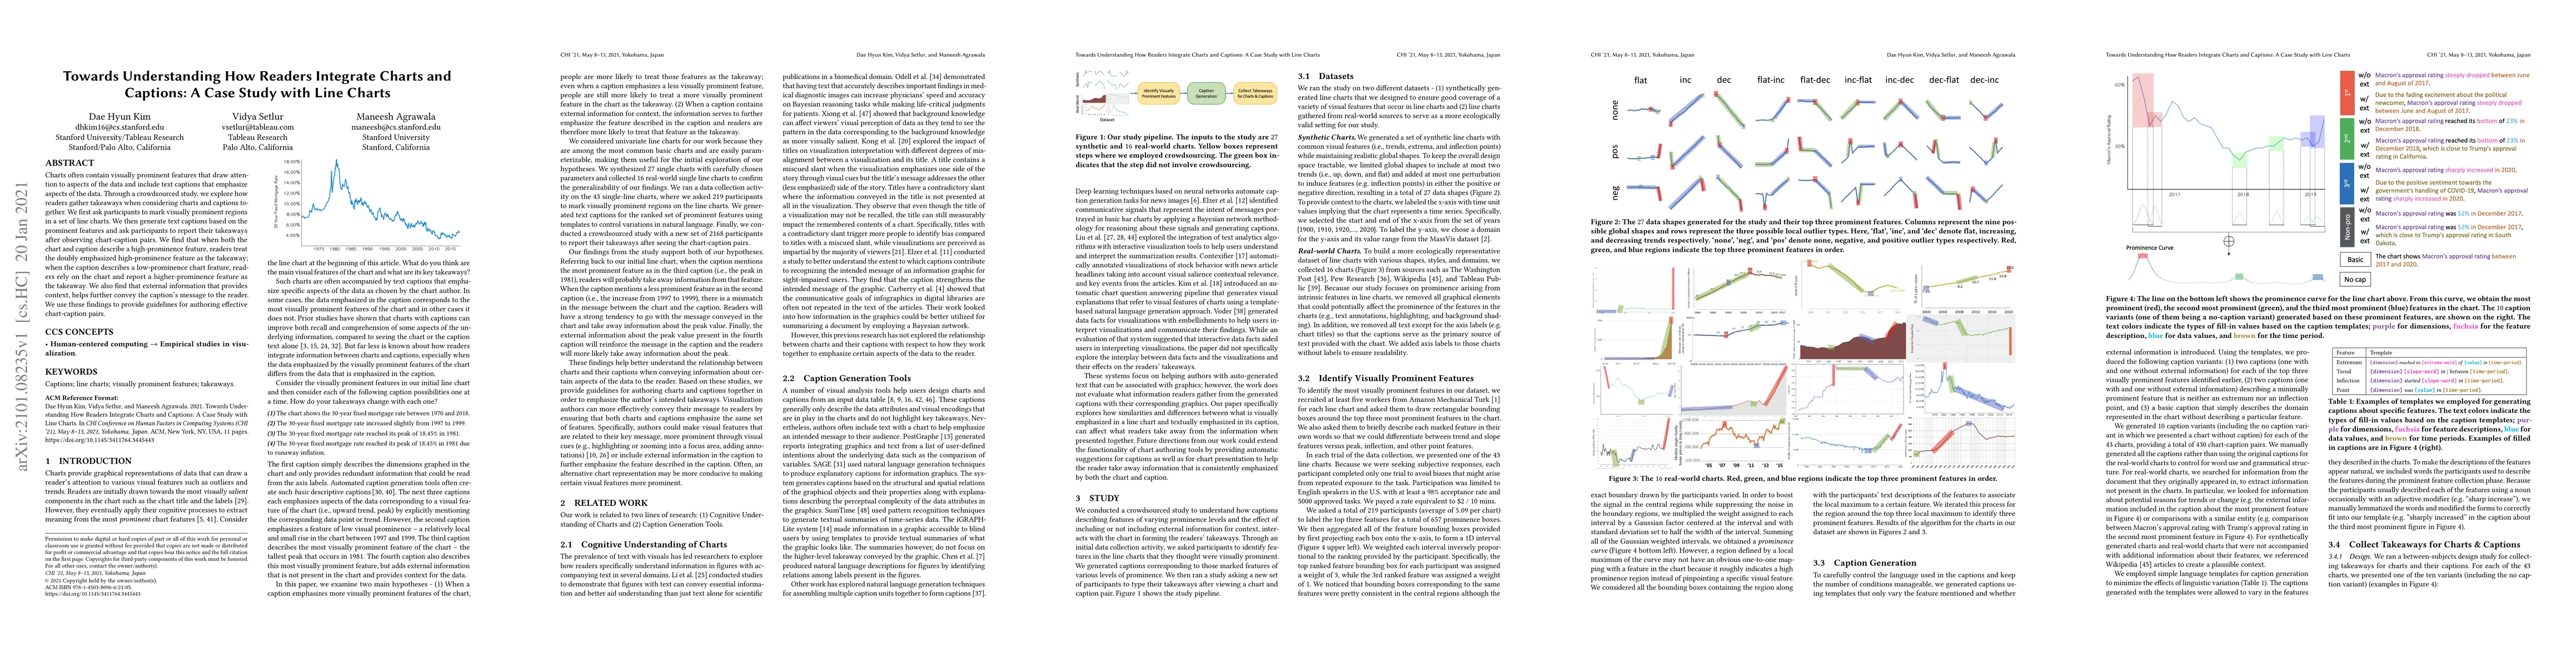
Charts often contain visually prominent features that draw attention to aspects of the data and include text captions that emphasize aspects of the data. Through a crowdsourced study, we explore how readers gather takeaways when considering charts and captions together. We first ask participants to mark visually prominent regions in a set of line charts. We then generate text captions based on the prominent features and ask participants to report their takeaways after observing chart-caption pairs. We find that when both the chart and caption describe a high-prominence feature, readers treat the doubly emphasized high-prominence feature as the takeaway; when the caption describes a low-prominence chart feature, readers rely on the chart and report a higher-prominence feature as the takeaway. We also find that external information that provides context, helps further convey the caption's message to the reader. We use these findings to provide guidelines for authoring effective chart-caption pairs.
This graph shows how this paper is connected to other research. The current paper is shown in dark gray, papers that cite it are in green, and papers it references are in blue. You can:
• Hover over any node to see the paper title
• Click a node to view that paper's details
• Drag nodes to rearrange the graph
• Use the zoom controls (bottom right) to zoom in/out
Title | Authors | Year | Actions |
---|---|---|---|
Confirmation Bias: The Double-Edged Sword of Data Facts in Visual Data Communication
|
Shiyao Li, Thomas James Davidson, Cindy Xiong Bearfield, Emily Wall
|
2025
|
View Paper |
"Piecing Data Connections Together Like a Puzzle": Effects of Increasing Task Complexity on the Effectiveness of Data Storytelling Enhanced Visualisations
|
M. Milesi, Paola Mejia-Domenzain, Laura Brandl, Vanessa Echeverría, Yueqiao Jin, D. Gašević, Yi-Shan Tsai, Tanja Käser, Roberto Martínez-Maldonado
|
2025
|
View Paper |
Pluto: Authoring Semantically Aligned Text and Charts for Data-Driven Communication
|
Arjun Srinivasan, V. Setlur, Arvind Satyanarayan
|
2025
|
View Paper |
Jupybara: Operationalizing a Design Space for Actionable Data Analysis and Storytelling with LLMs
|
Huichen Will Wang, Larry Birnbaum, V. Setlur
|
2025
|
View Paper |
A Systematic Review of Data Visualization
|
Shilpa Balan
|
2024
|
View Paper |
C2: Scalable Auto-Feedback for LLM-based Chart Generation
|
Woosung Koh, Jang Han Yoon, MinHyung Lee, Youngjin Song, Jaegwan Cho, Jaehyun Kang, Taehyeon Kim, Se-young Yun, Youngjae Yu, Bongshin Lee
|
2024
|
View Paper |
A Survey on Annotations in Information Visualization: Empirical Insights, Applications, and Challenges
|
Md Dilshadur Rahman, Bhavana Doppalapudi, Ghulam Jilani Quadri, Paul Rosen
|
2024
|
View Paper |
Visualization of Age Distributions as Elements of Medical Data-Stories
|
Sophia Dowlatabadi, B. Preim, M. Meuschke
|
2024
|
View Paper |
"The Data Says Otherwise" — Towards Automated Fact-checking and Communication of Data Claims
|
Yu Fu, Shunan Guo, J. Hoffswell, Victor S. Bursztyn, R. Rossi, J. Stasko
|
2024
|
View Paper |
An Empirical Evaluation of the GPT-4 Multimodal Language Model on Visualization Literacy Tasks
|
Alexander Bendeck, John Stasko
|
2024
|
View Paper |
How Aligned are Human Chart Takeaways and LLM Predictions? A Case Study on Bar Charts with Varying Layouts
|
Huichen Will Wang, J. Hoffswell, Sao Myat Thazin Thane, V. S. Bursztyn, Cindy Xiong Bearfield
|
2024
|
View Paper |
Dash: A Bimodal Data Exploration Tool for Interactive Text and Visualizations
|
Dennis Bromley, V. Setlur
|
2024
|
View Paper |
From Instruction to Insight: Exploring the Functional and Semantic Roles of Text in Interactive Dashboards
|
N. Sultanum, V. Setlur
|
2024
|
View Paper |
Discovering Accessible Data Visualizations for People with ADHD
|
Tien Tran, H. Lee, Ji Hwan Park
|
2024
|
View Paper |
SciCapenter: Supporting Caption Composition for Scientific Figures with Machine-Generated Captions and Ratings
|
Ting-Yao Hsu, Chieh-Yang Huang, Shih-Hong Huang, Ryan A. Rossi, Sungchul Kim, Tong Yu, C. L. Giles, ‘Kenneth’ Huang
|
2024
|
View Paper |
Understanding Reader Takeaways in Thematic Maps Under Varying Text, Detail, and Spatial Autocorrelation
|
Arlen Fan, Fan Lei, M. Mancenido, A. Maceachren, Ross Maciejewski
|
2024
|
View Paper |
SlopeSeeker: A Search Tool for Exploring a Dataset of Quantifiable Trends
|
Alexander Bendeck, Dennis Bromley, V. Setlur
|
2024
|
View Paper |
Same Data, Diverging Perspectives: The Power of Visualizations to Elicit Competing Interpretations
|
Cindy Xiong Bearfield, Lisanne Van Weelden, Adam Waytz, Steven Franconeri
|
2024
|
View Paper |
Almanac: An API for Recommending Text Annotations For Time-Series Charts Using News Headlines
|
Terrell Ibanez, V. Setlur, Maneesh Agrawala
|
2023
|
View Paper |
The Role of Text in Visualizations: How Annotations Shape Perceptions of Bias and Influence Predictions
|
Chase Stokes, Cindy Xiong Bearfield, Marti A. Hearst
|
2023
|
View Paper |
Fostering Enterprise Conversations Around Data on Collaboration Platforms
|
Hyeok Kim, Arjun Srinivasan, Matthew Brehmer
|
2023
|
View Paper |
Show It or Tell It? Text, Visualization, and Their Combination
|
Marti A. Hearst
|
2023
|
View Paper |
Authoring tool for Data Journalists integrating Self-Explanatory Visualization Onboarding Concept for a Treemap Visualization
|
Christina Stoiber, Sonja Radkohl, Florian Grassinger, Daniela Moitzi, Holger Stitz, Eva Goldgruber, Dominic Girardi, Wolfgang Aigner
|
2023
|
View Paper |
Natural Language Dataset Generation Framework for Visualizations Powered by Large Language Models
|
Hyung-Kwon Ko, Hyeon Jeon, Gwanmo Park, Dae Hyun Kim, Nam Wook Kim, Juho Kim, Jinwook Seo
|
2023
|
View Paper |
What Eye Tracking Can Show Us About How People Are Influenced by Deceptive Tactics in Line Graphs
|
C. Lauer, C. A. Sanchez
|
2023
|
View Paper |
My Model is Unfair, Do People Even Care? Visual Design Affects Trust and Perceived Bias in Machine Learning
|
Aimen Gaba, Zhanna Kaufman, Jason Chueng, Marie Shvakel, Kyle Wm. Hall, Yuriy Brun, Cindy Xiong Bearfield
|
2023
|
View Paper |
What Is the Difference Between a Mountain and a Molehill? Quantifying Semantic Labeling of Visual Features in Line Charts
|
Dennis Bromley, V. Setlur
|
2023
|
View Paper |
Olio: A Semantic Search Interface for Data Repositories
|
V. Setlur, Andriy Kanyuka, Arjun Srinivasan
|
2023
|
View Paper |
EC: A Tool for Guiding Chart and Caption Emphasis
|
Dae Hyun Kim, Seulgi Choi, Juho Kim, V. Setlur, Maneesh Agrawala
|
2023
|
View Paper |
VisText: A Benchmark for Semantically Rich Chart Captioning
|
Benny J. Tang, Angie Boggust
|
2023
|
View Paper |
The Reality of the Situation: A Survey of Situated Analytics
|
Sungbok Shin, A. Batch, P. Butcher, Panagiotis D. Ritsos, N. Elmqvist
|
2023
|
View Paper |
What is the message? Perspectives on Visual Data Communication
|
Laura Koesten, Kathleen Gregory, Regina Schuster, Christian Knoll, Sarah Davies, T. Möller
|
2023
|
View Paper |
Data Point Selection for Line Chart Visualization: Methodological Assessment and Evidence-Based Guidelines
|
Jonas Van Der Donckt, Jeroen Van Der Donckt, Michael Rademaker, S. V. Hoecke
|
2023
|
View Paper |
Scientific document processing: challenges for modern learning methods
|
Abhinav Ramesh Kashyap, Yajing Yang, MingSung Kan
|
2023
|
View Paper |
The Chart Excites Me! Exploring How Data Visualization Design Influences Affective Arousal
|
Xingyu Lan, Yanqiu Wu, Qing Chen, Nan Cao
|
2022
|
View Paper |
Intentable: A Mixed-Initiative System for Intent-Based Chart Captioning
|
Ji-Won Choi, Jaemin Jo
|
2022
|
View Paper |
Why More Text is (Often) Better: Themes from Reader Preferences for Integration of Charts and Text
|
Chase Stokes, Marti A. Hearst
|
2022
|
View Paper |
How Do Viewers Synthesize Conflicting Information from Data Visualizations?
|
Prateek Mantri, Hariharan Subramonyam, Audrey L. Michal, Cindy Xiong
|
2022
|
View Paper |
Striking a Balance: Reader Takeaways and Preferences when Integrating Text and Charts
|
Chase Stokes, V. Setlur, Bridget Cogley, Arvind Satyanarayan, Marti A. Hearst
|
2022
|
View Paper |
LineCap: Line Charts for Data Visualization Captioning Models
|
Anita Mahinpei, Zona Kostic, Christy Tanner
|
2022
|
View Paper |
Investigating the Role and Interplay of Narrations and Animations in Data Videos
|
Hao Cheng, Junhong Wang, Yun Wang, Bongshin Lee, Haidong Zhang, Dongmei Zhang
|
2022
|
View Paper |
How Do Captions Affect Visualization Reading?
|
Shelly Cheng, Hazel Zhu, Eugene Wu
|
2022
|
View Paper |
Annotating Line Charts for Addressing Deception
|
Arlen Fan, Yuxin Ma, M. Mancenido, Ross Maciejewski
|
2022
|
View Paper |
ChartQA: A Benchmark for Question Answering about Charts with Visual and Logical Reasoning
|
Ahmed Masry, Do Xuan Long, J. Tan, Shafiq R. Joty, Enamul Hoque
|
2022
|
View Paper |
Chart-to-Text: A Large-Scale Benchmark for Chart Summarization
|
Shankar Kanthara, Rixie Tiffany Ko Leong, Xiang Lin, Ahmed Masry, Megh Thakkar, Enamul Hoque, Shafiq R. Joty
|
2022
|
View Paper |
Accessible Visualization via Natural Language Descriptions: A Four-Level Model of Semantic Content
|
Alan Lundgard, Arvind Satyanarayan
|
2021
|
View Paper |
Towards Natural Language Interfaces for Data Visualization: A Survey
|
Leixian Shen, Enya Shen, Yuyu Luo, Xiaocong Yang, Xuming Hu, Xiongshuai Zhang, Zhiwei Tai, Jianmin Wang
|
2021
|
View Paper |
Making the Invisible Visible: Risks and Benefits of Disclosing Metadata in Visualization
|
Alyxander Burns, Thai On, C. Lee, R. Shapiro, Cindy Xiong, Narges Mahyar
|
2021
|
View Paper |
Visual Arrangements of Bar Charts Influence Comparisons in Viewer Takeaways
|
Cindy Xiong, V. Setlur, Benjamin Bach, Kylie Lin, Eunyee Koh, S. Franconeri
|
2021
|
View Paper |
VBridge: Connecting the Dots Between Features and Data to Explain Healthcare Models
|
Furui Cheng, Dongyu Liu, F. Du, Yanna Lin, Alexandra Zytek, Haomin Li, Huamin Qu, K. Veeramachaneni
|
2021
|
View Paper |
The Why and The How: A Survey on Natural Language Interaction in Visualization
|
Henrik Voigt, Ozge Alacam, M. Meuschke, K. Lawonn, Sina Zarrieß
|
2022
|
View Paper |
VBridge: Connecting the Dots Between Features, Explanations, and Data for Healthcare Models
|
Furui Cheng, Dongyu Liu, F. Du, Yanna Lin, Alexandra Zytek, Haomin Li, Huamin Qu, K. Veeramachaneni
|
2021
|
View Paper |
Theoretisch kader
|
Nicole Plasschaert
|
2019
|
View Paper |
Huamin Qu, Yun Wang, Yingcai Wu, Haotian Li, Haidong Zhang, Xinyang Jiang, Lu Ying, Shuguang Dou
Published: 2024-05-20
Eugene Wu, Hanxiu 'Hazel' Zhu, Shelly Shiying Cheng
Published: 2022-09-27
Published: 2021-10-26
Vidya Setlur, Dennis Bromley
Published: 2023-08-04
Comments (0)