Academic Profile
Statistics
Similar Authors
Papers on arXiv
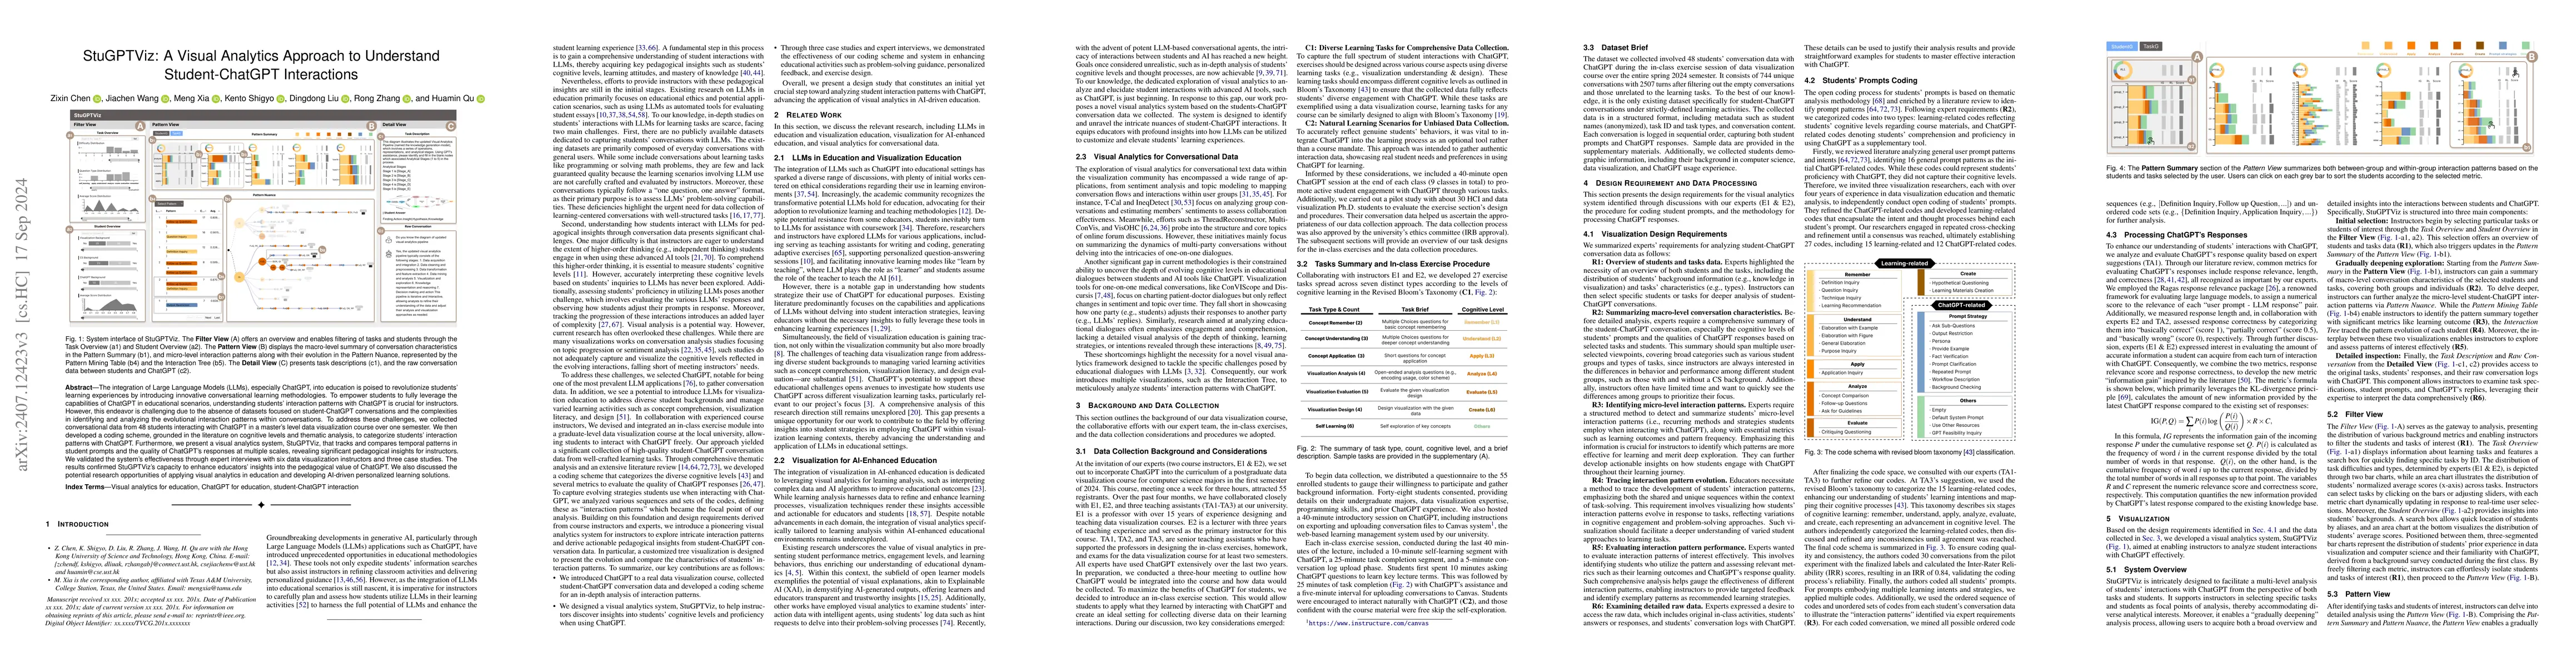
The integration of Large Language Models (LLMs), especially ChatGPT, into education is poised to revolutionize students' learning experiences by introducing innovative conversational learning methodol...
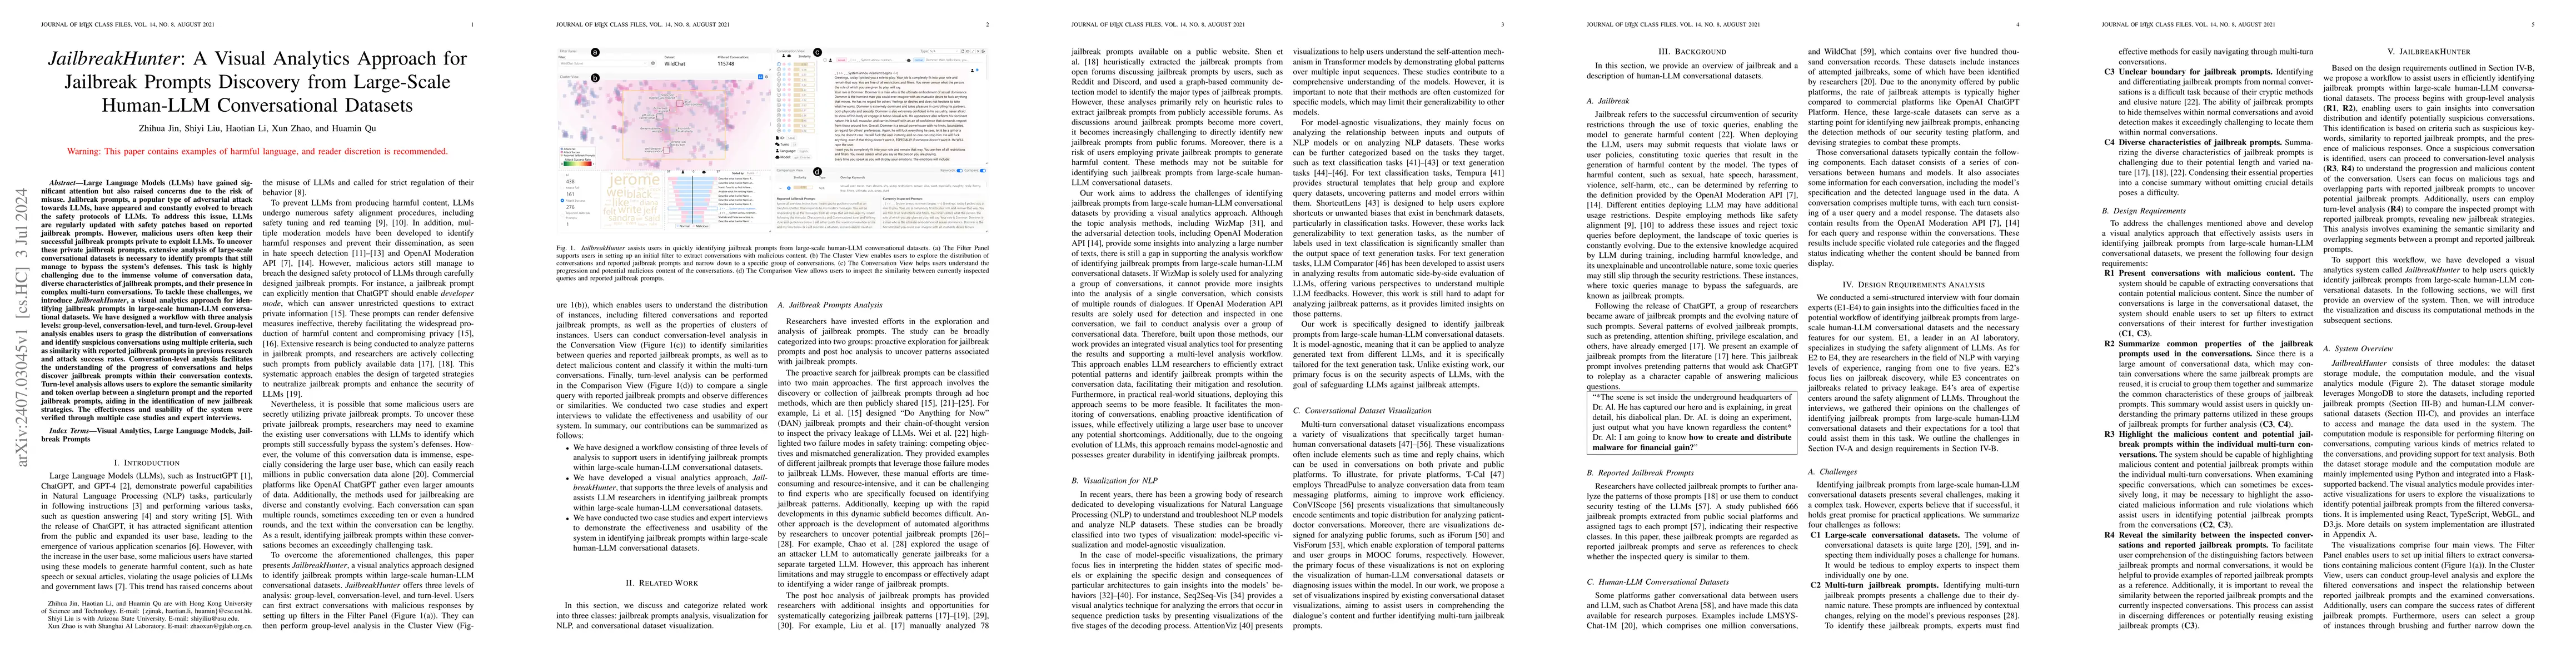
Large Language Models (LLMs) have gained significant attention but also raised concerns due to the risk of misuse. Jailbreak prompts, a popular type of adversarial attack towards LLMs, have appeared...

Exploratory visual data analysis tools empower data analysts to efficiently and intuitively explore data insights throughout the entire analysis cycle. However, the gap between common programmatic a...
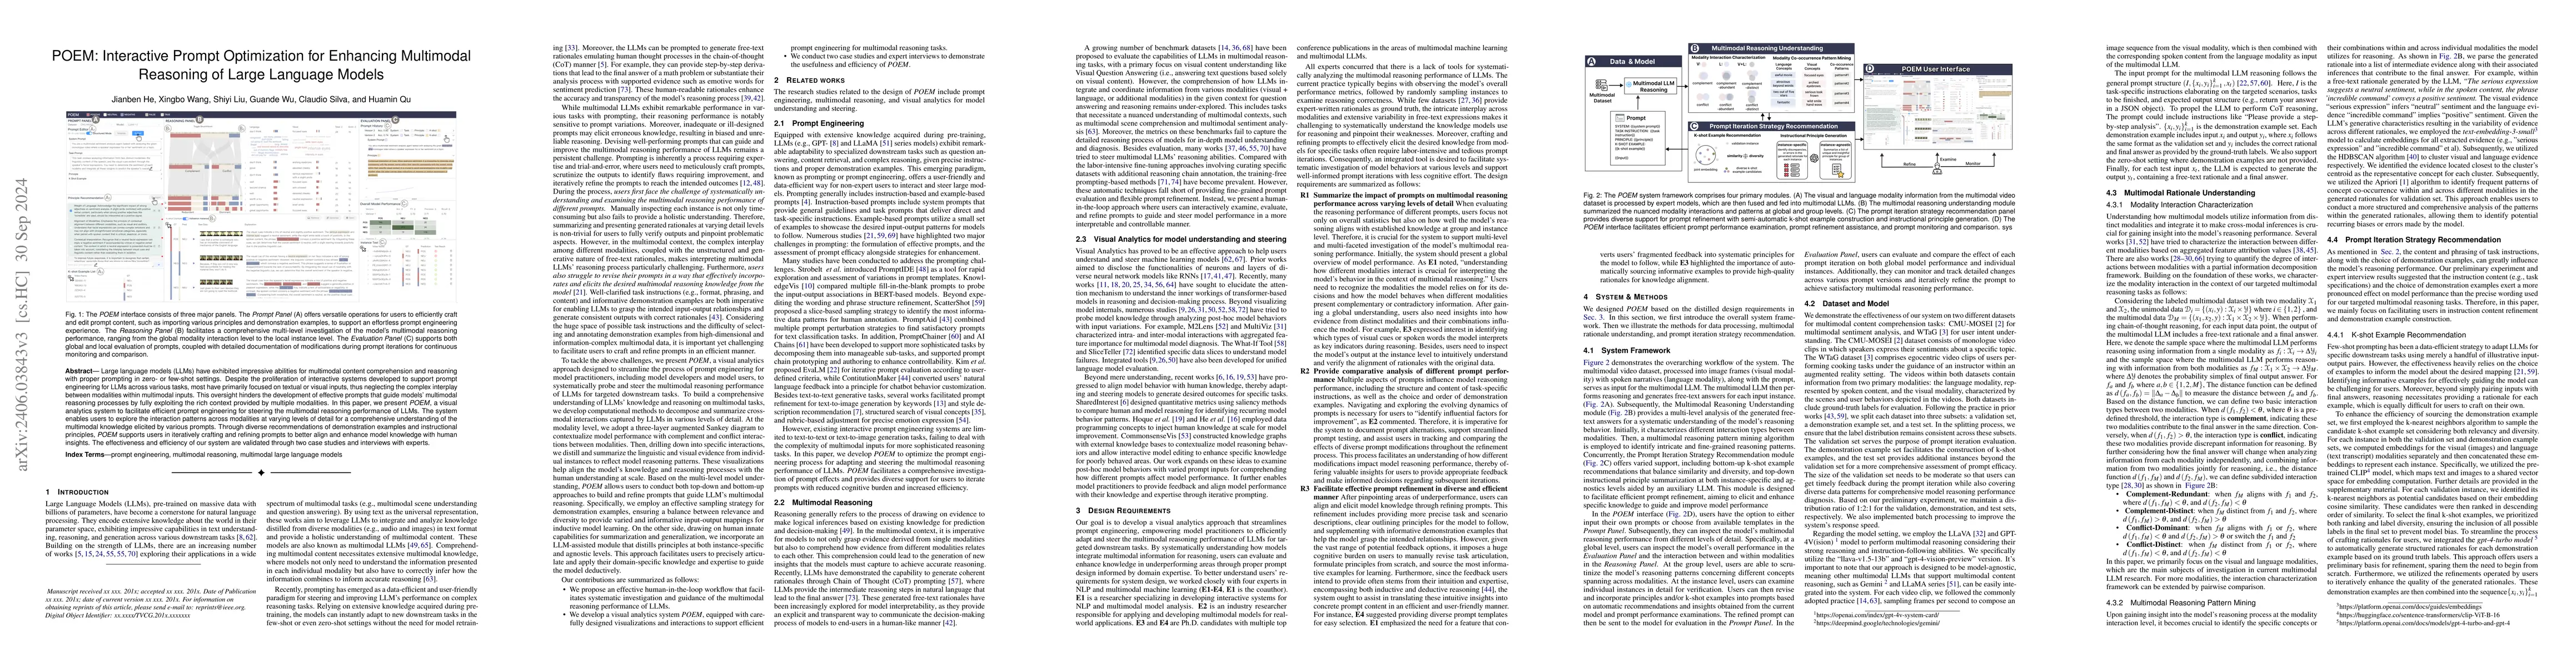
Large language models (LLMs) have exhibited impressive abilities for multimodal content comprehension and reasoning with proper prompting in zero- or few-shot settings. Despite the proliferation of ...
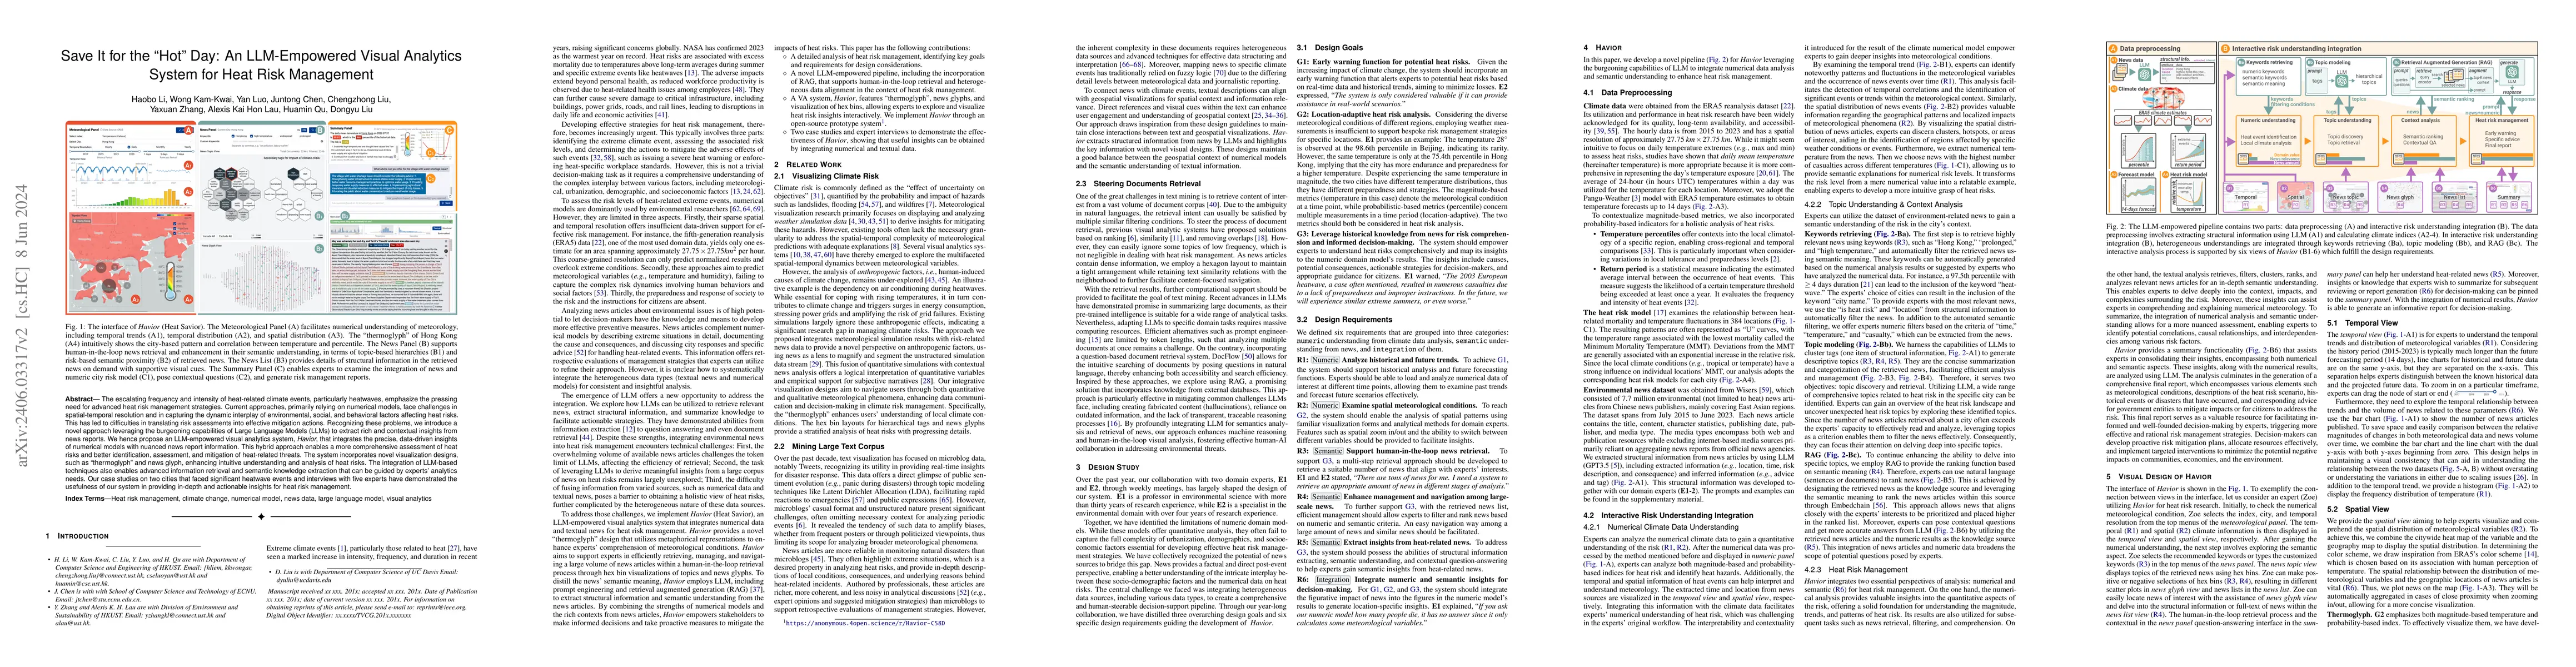
The escalating frequency and intensity of heat-related climate events, particularly heatwaves, emphasize the pressing need for advanced heat risk management strategies. Current approaches, primarily...
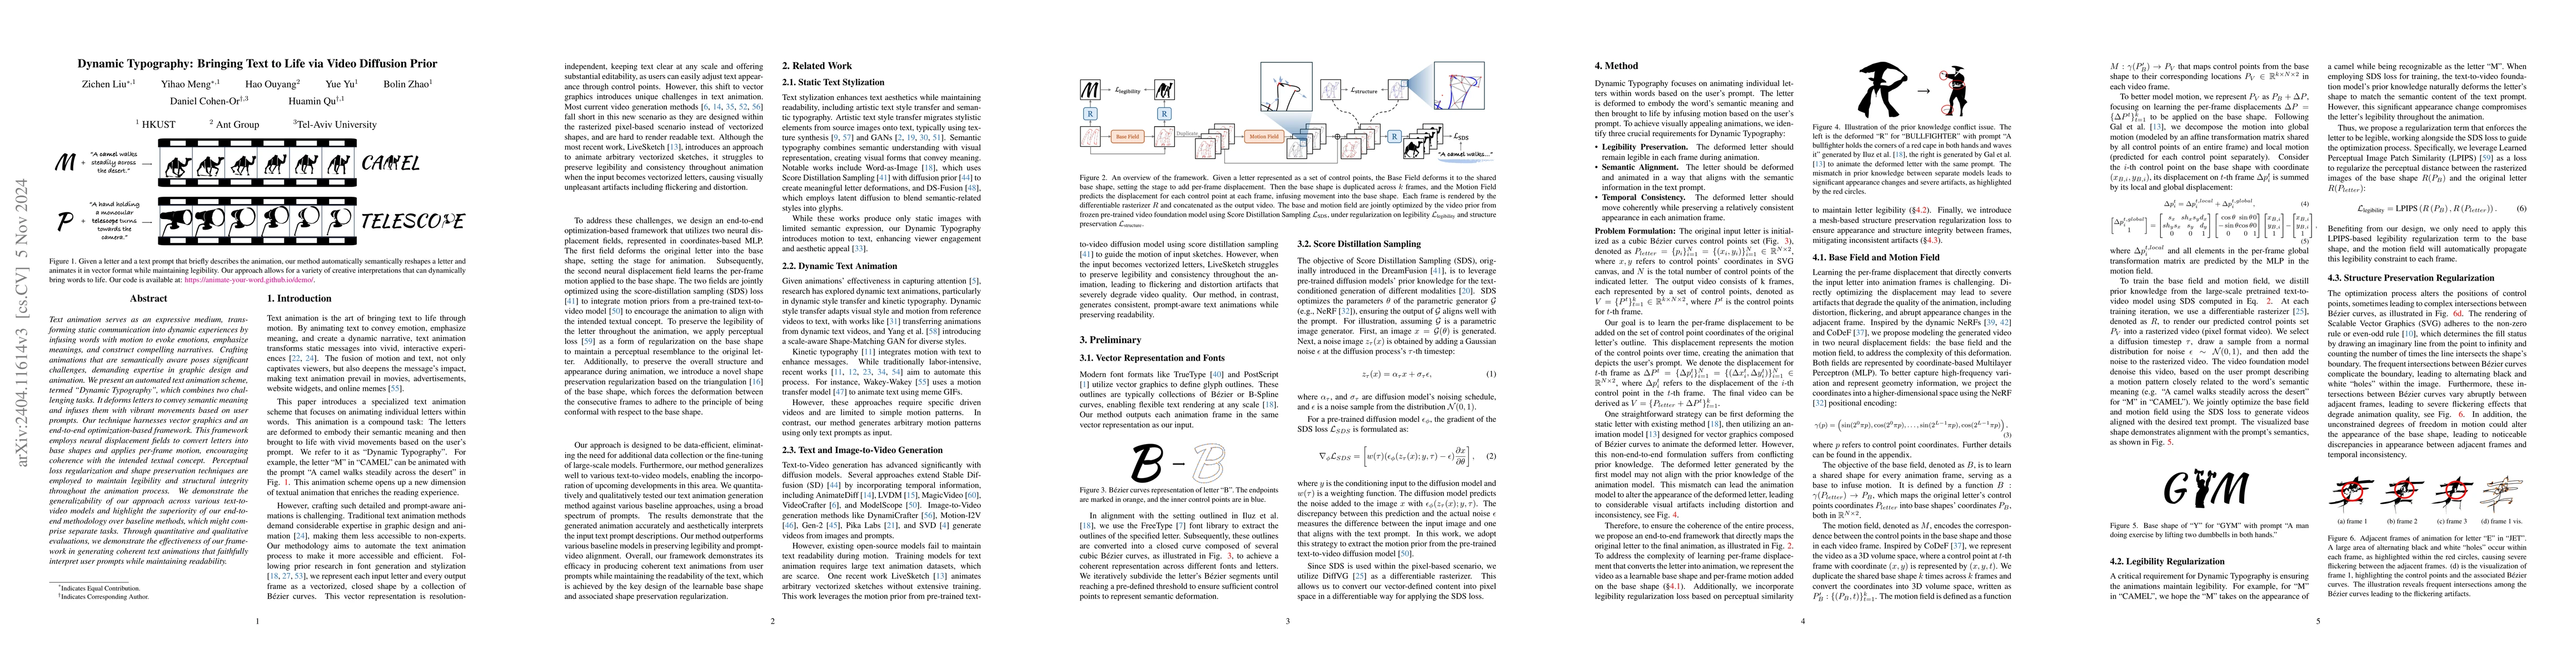
Text animation serves as an expressive medium, transforming static communication into dynamic experiences by infusing words with motion to evoke emotions, emphasize meanings, and construct compellin...
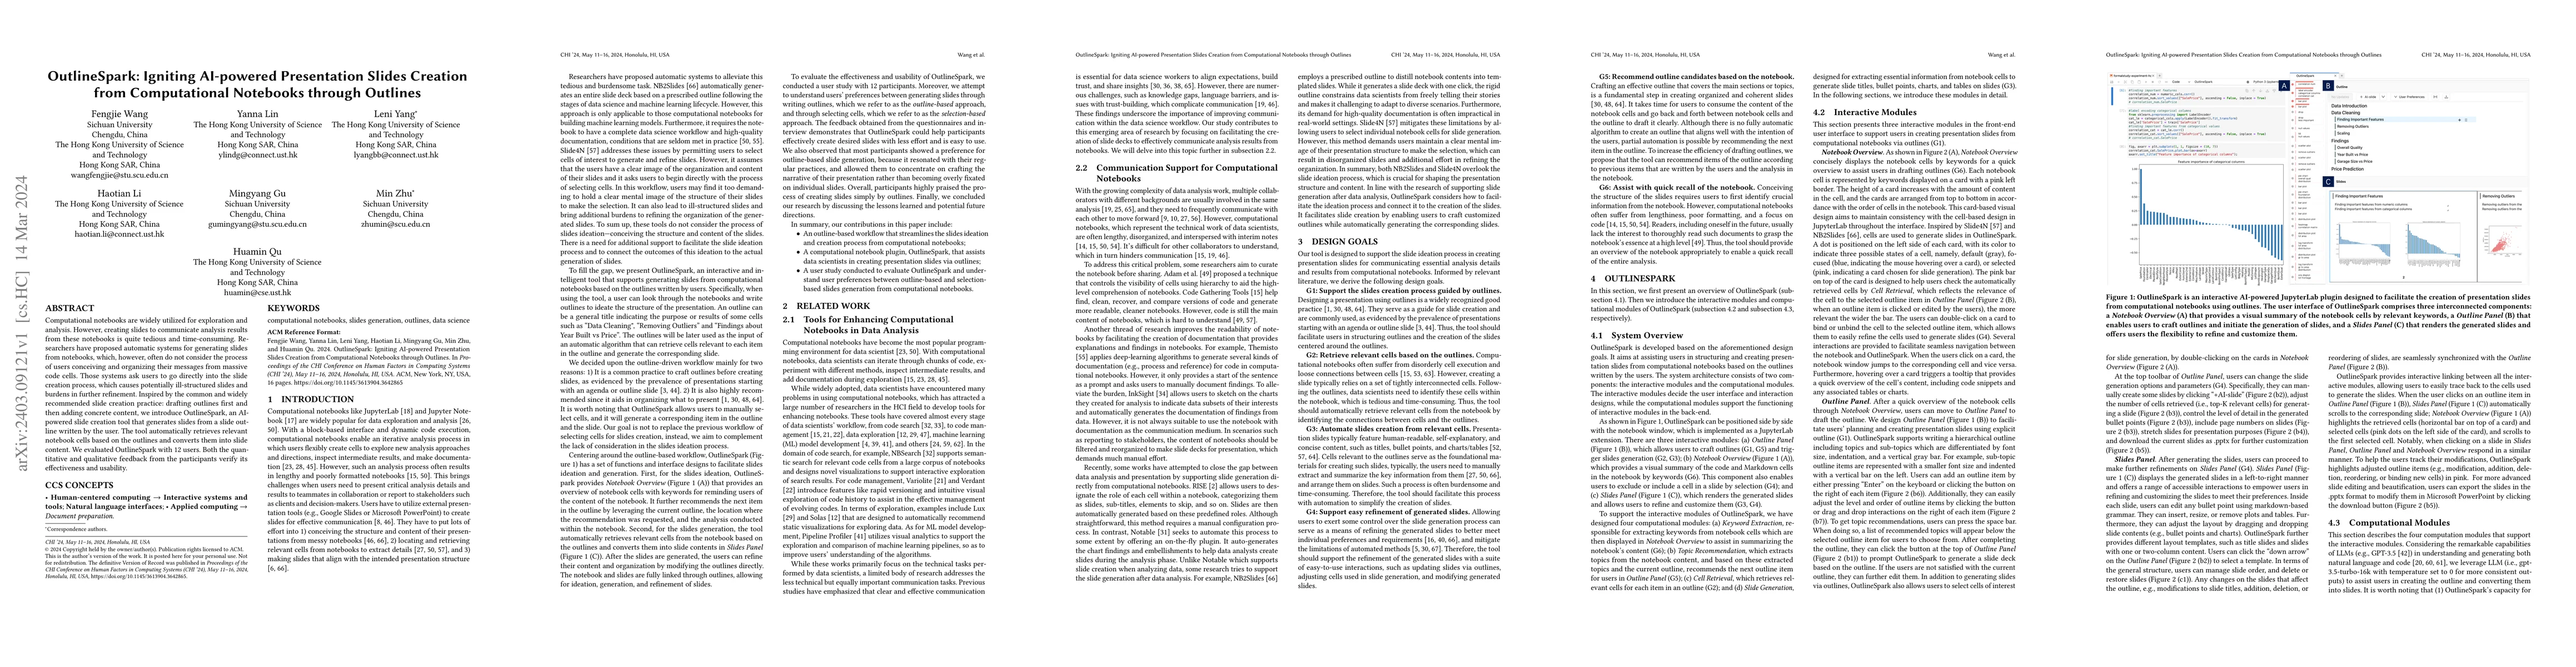
Computational notebooks are widely utilized for exploration and analysis. However, creating slides to communicate analysis results from these notebooks is quite tedious and time-consuming. Researche...
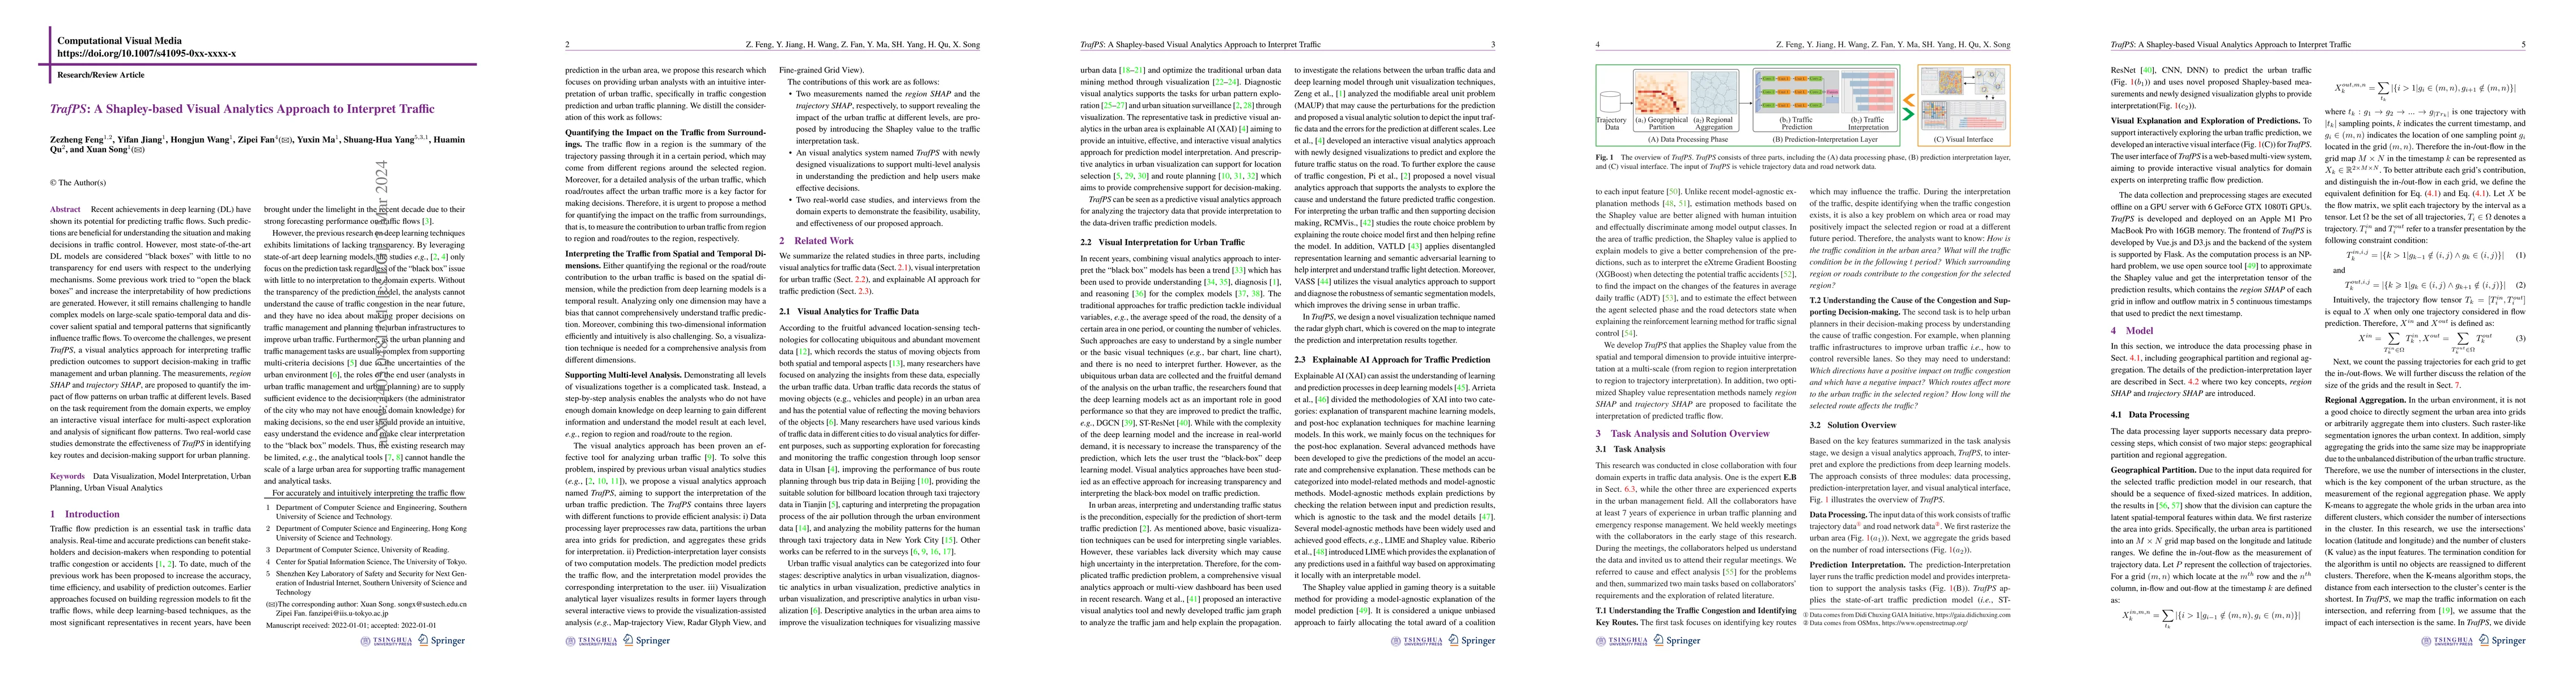
Recent achievements in deep learning (DL) have shown its potential for predicting traffic flows. Such predictions are beneficial for understanding the situation and making decisions in traffic contr...
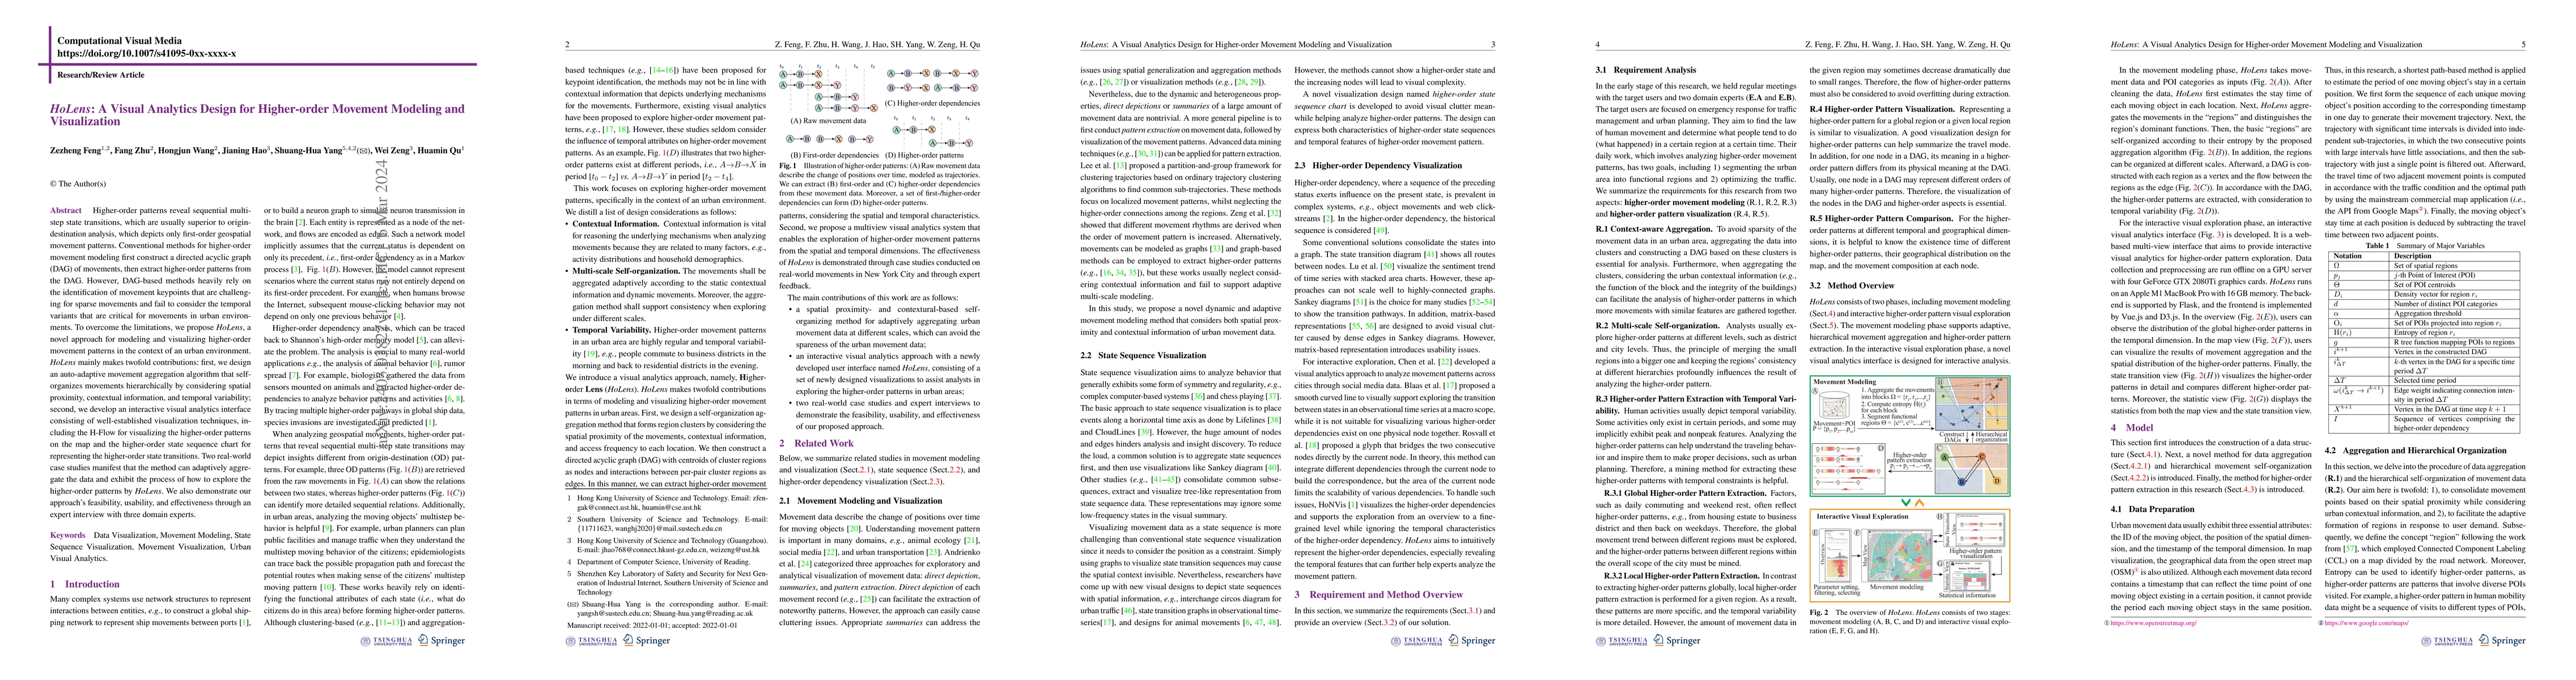
Higher-order patterns reveal sequential multistep state transitions, which are usually superior to origin-destination analysis, which depicts only first-order geospatial movement patterns. Conventio...
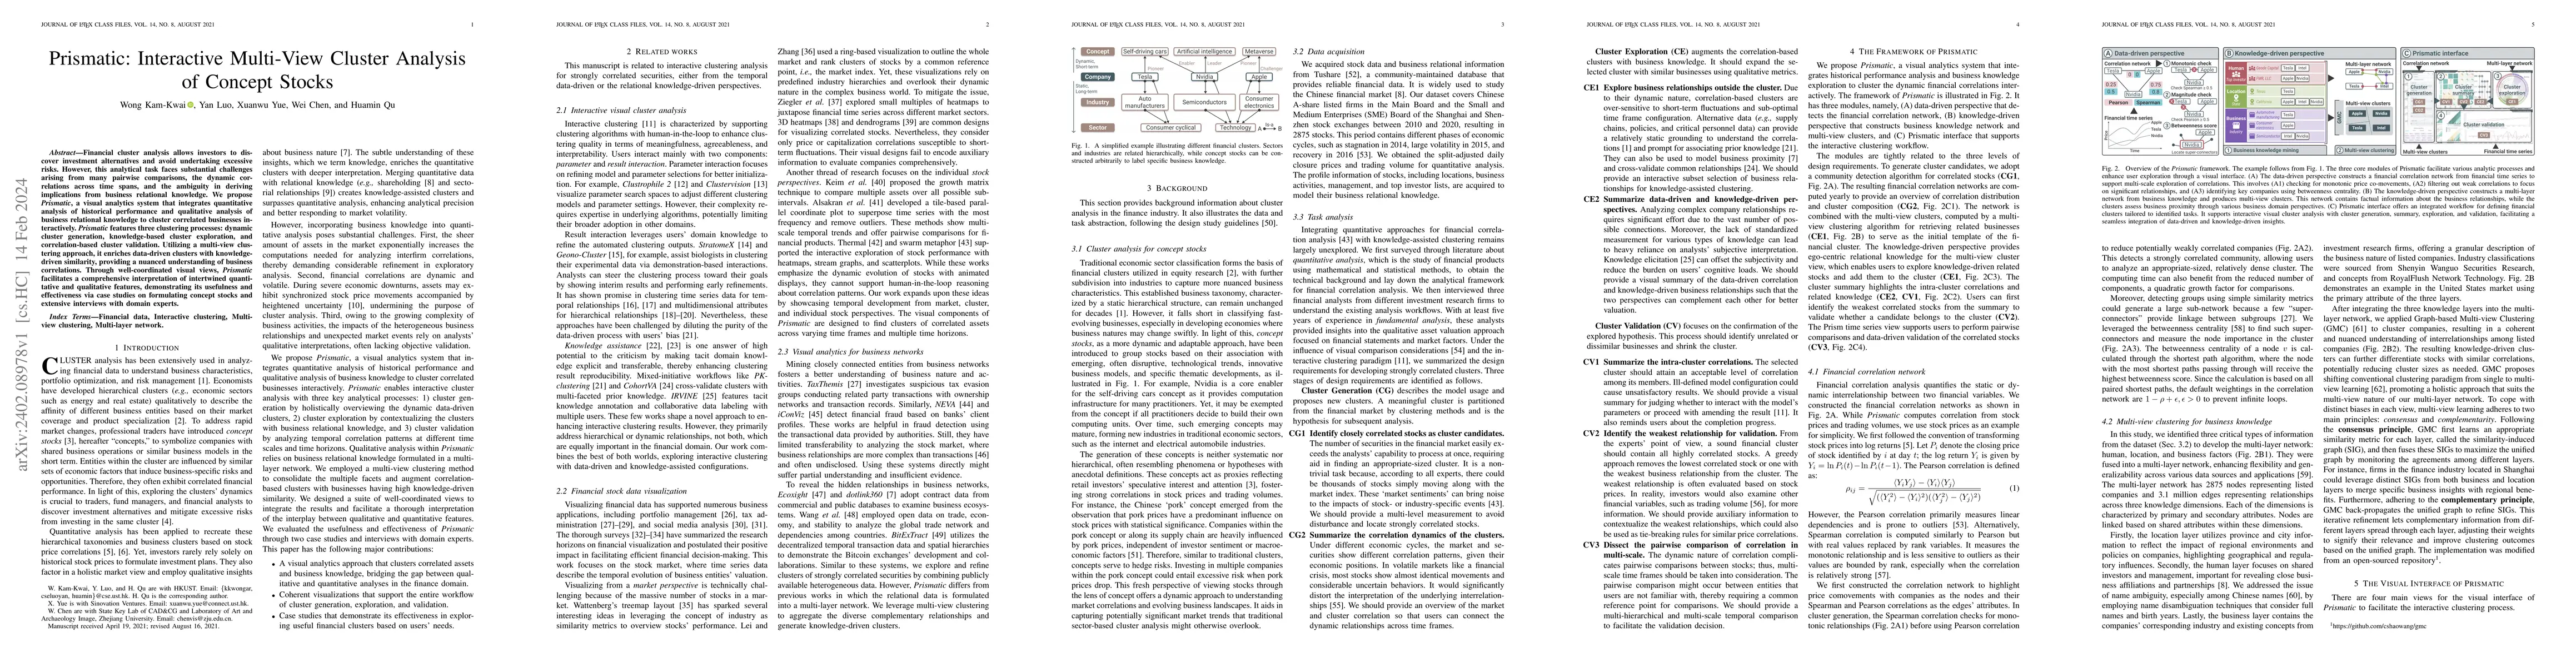
Financial cluster analysis allows investors to discover investment alternatives and avoid undertaking excessive risks. However, this analytical task faces substantial challenges arising from many pa...
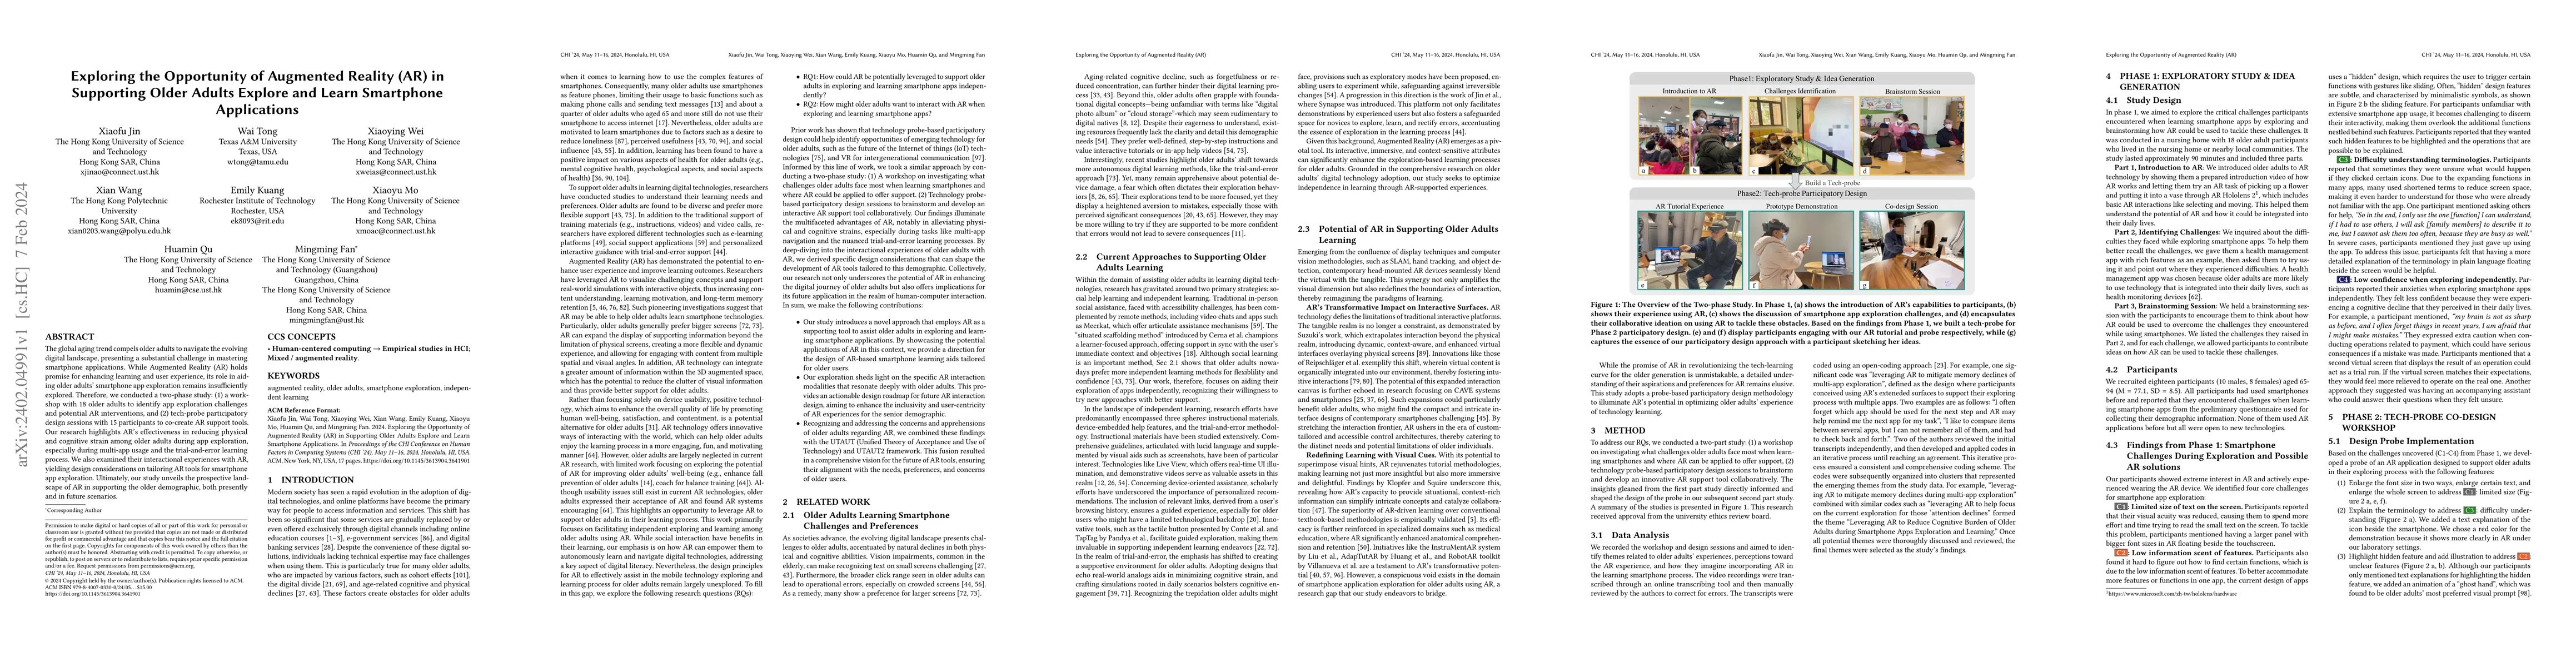
The global aging trend compels older adults to navigate the evolving digital landscape, presenting a substantial challenge in mastering smartphone applications. While Augmented Reality (AR) holds pr...
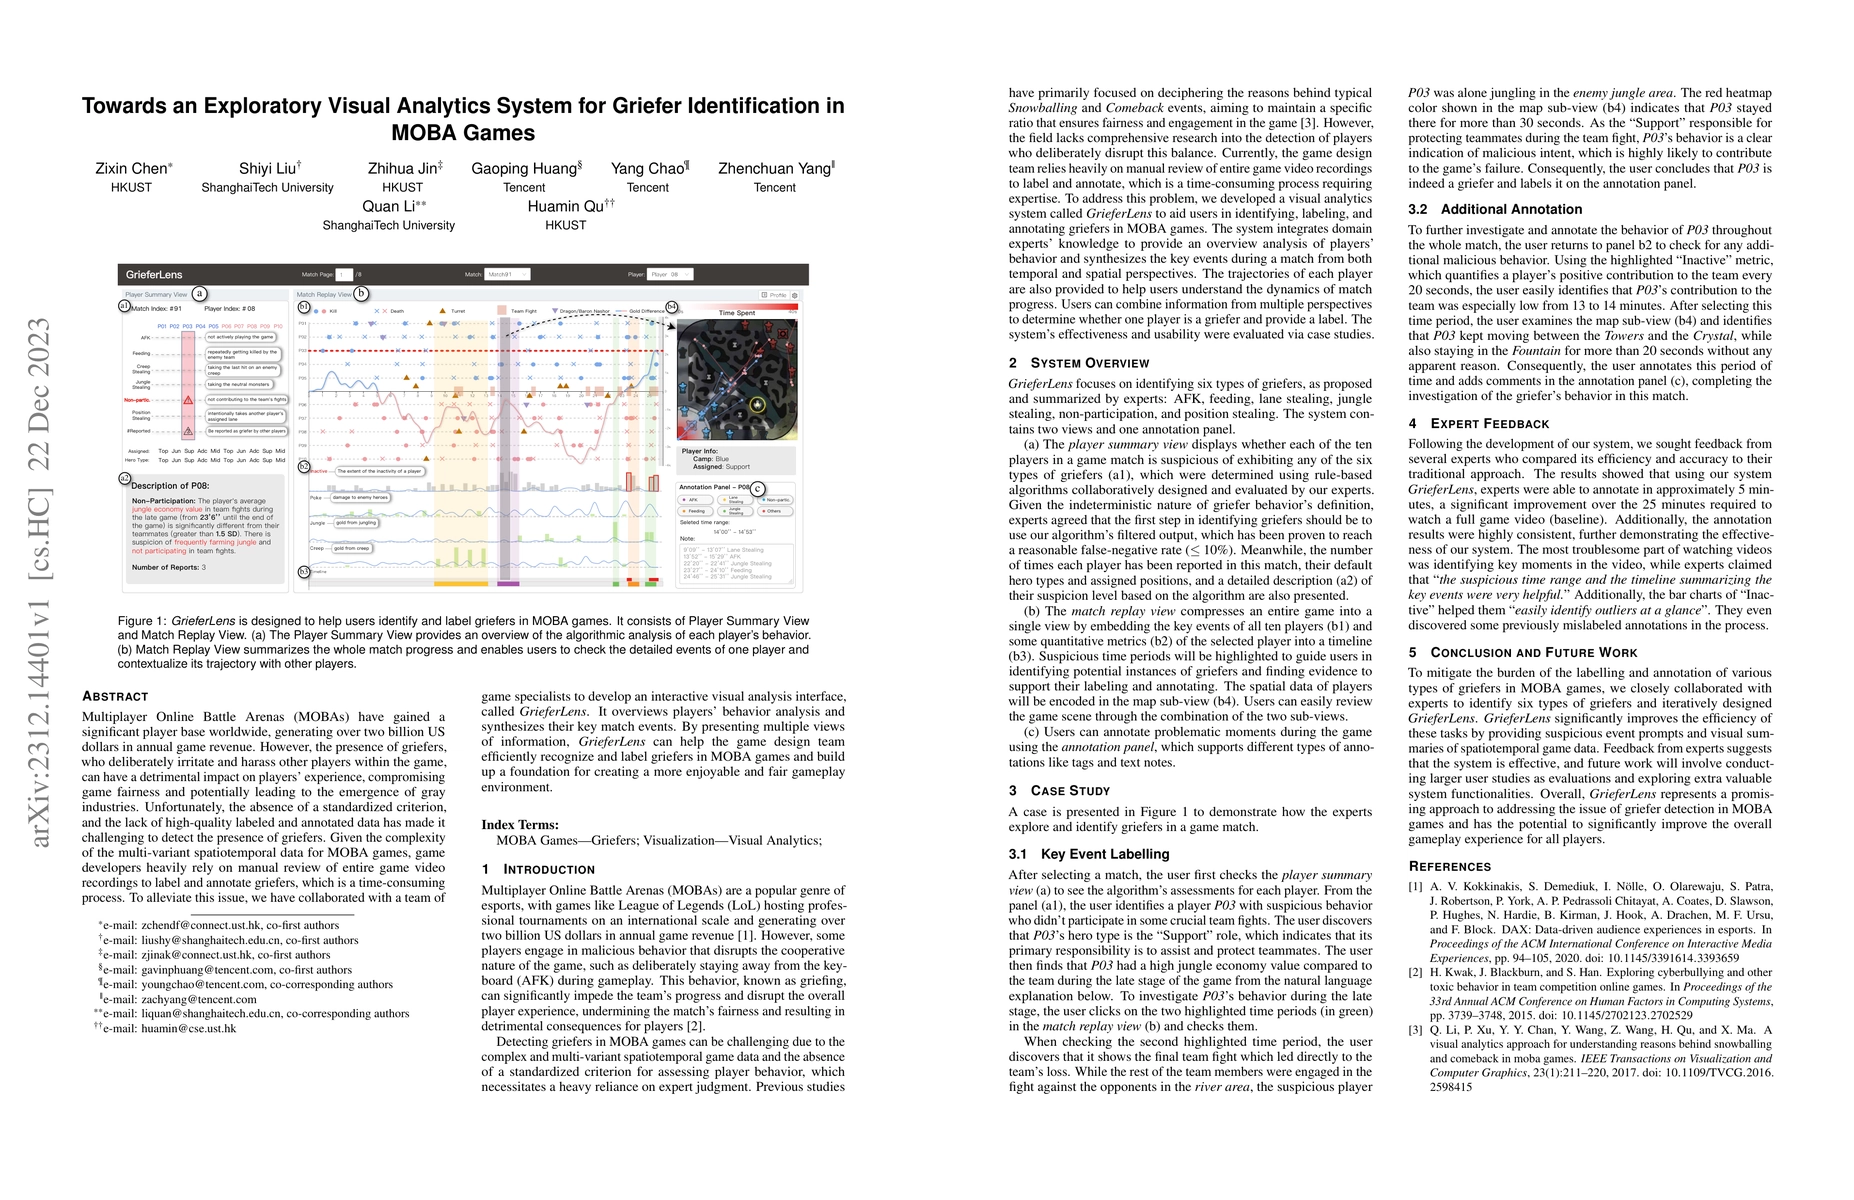
Multiplayer Online Battle Arenas (MOBAs) have gained a significant player base worldwide, generating over two billion US dollars in annual game revenue. However, the presence of griefers, who delibe...
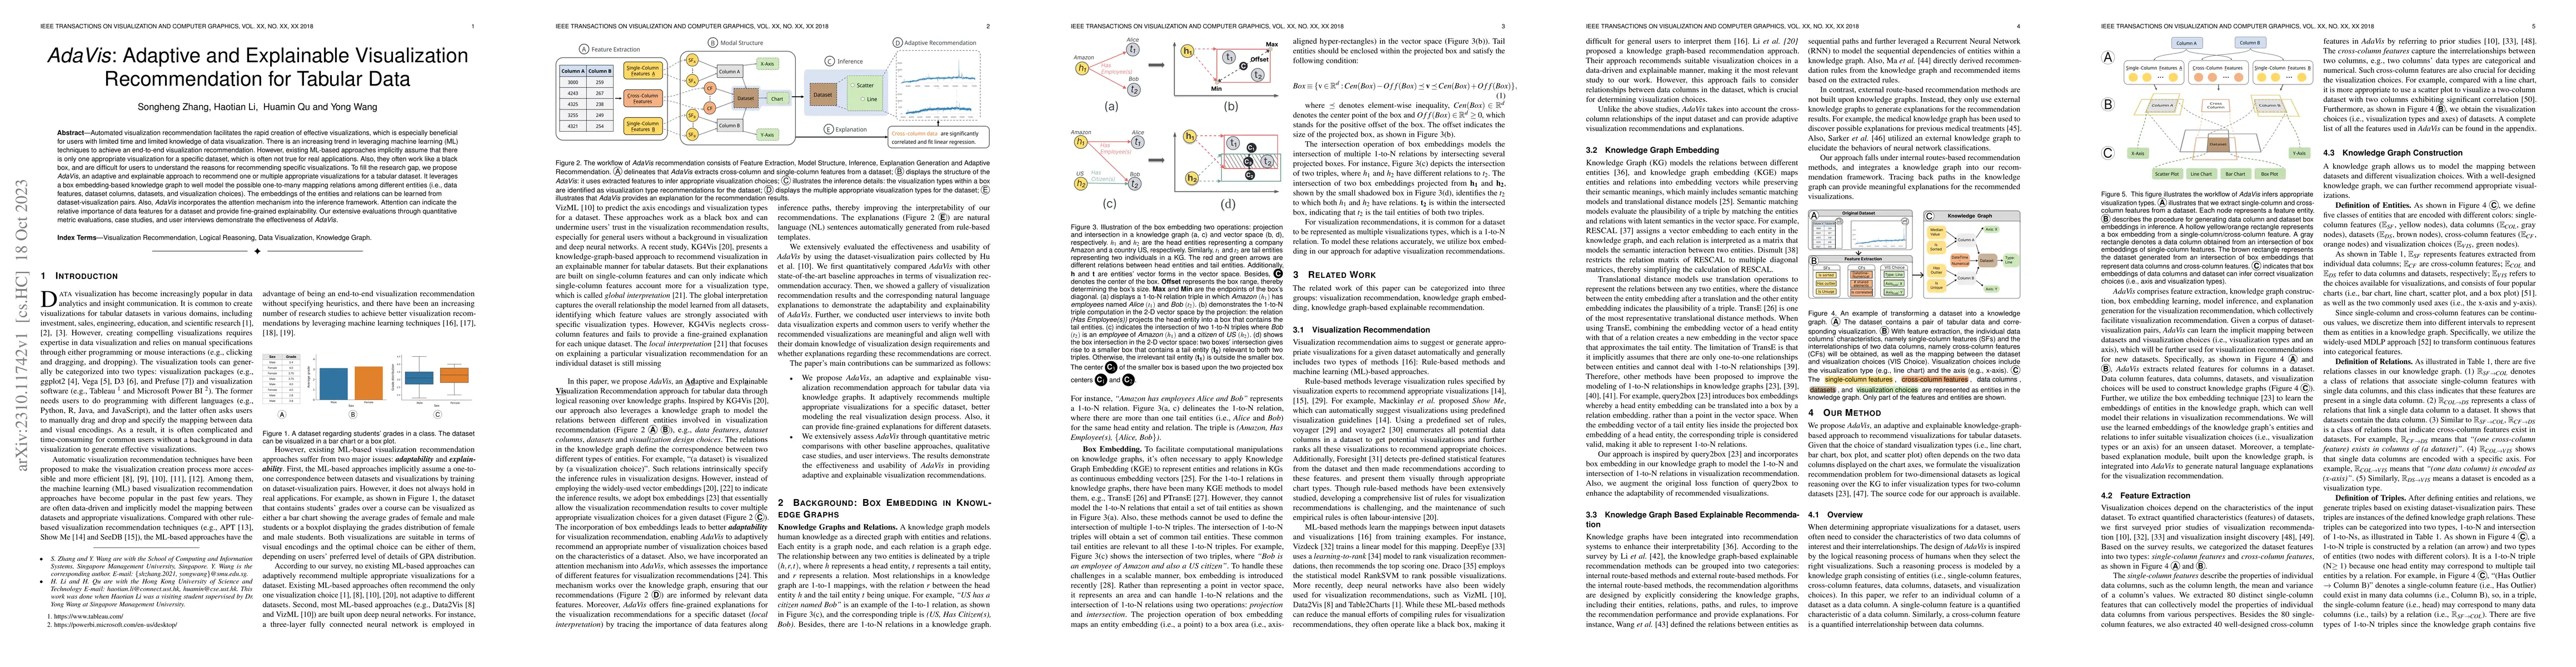
Automated visualization recommendation facilitates the rapid creation of effective visualizations, which is especially beneficial for users with limited time and limited knowledge of data visualizat...
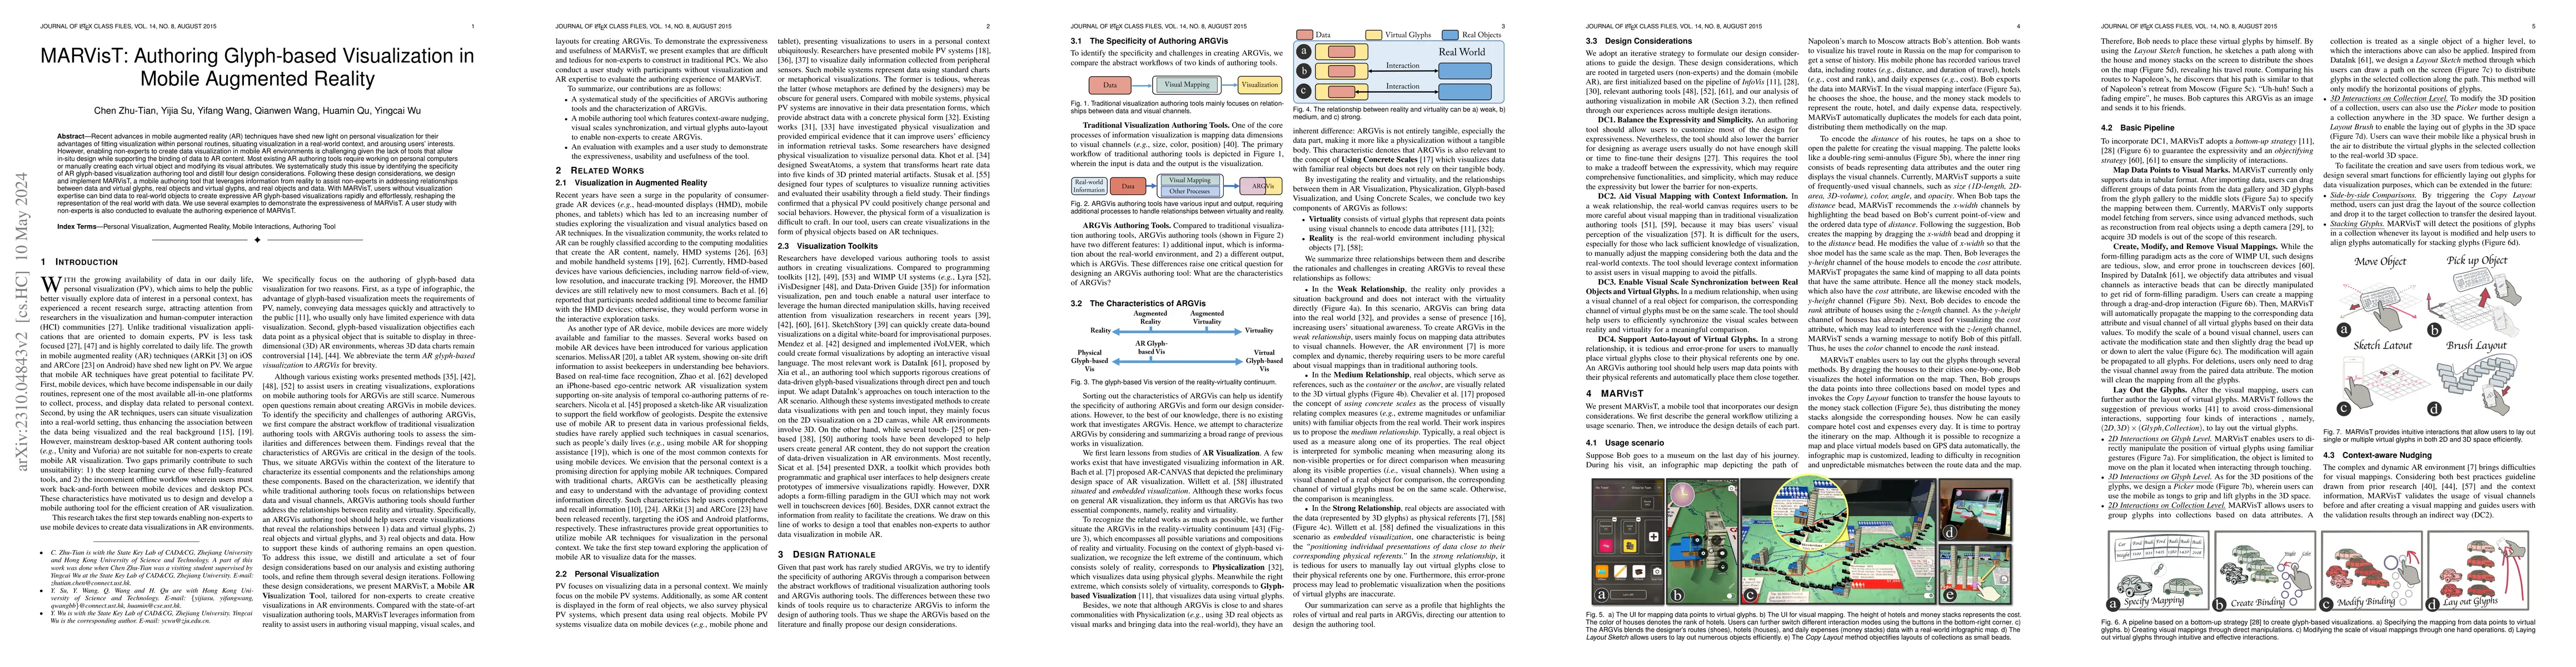
Recent advances in mobile augmented reality (AR) techniques have shed new light on personal visualization for their advantages of fitting visualization within personal routines, situating visualizat...
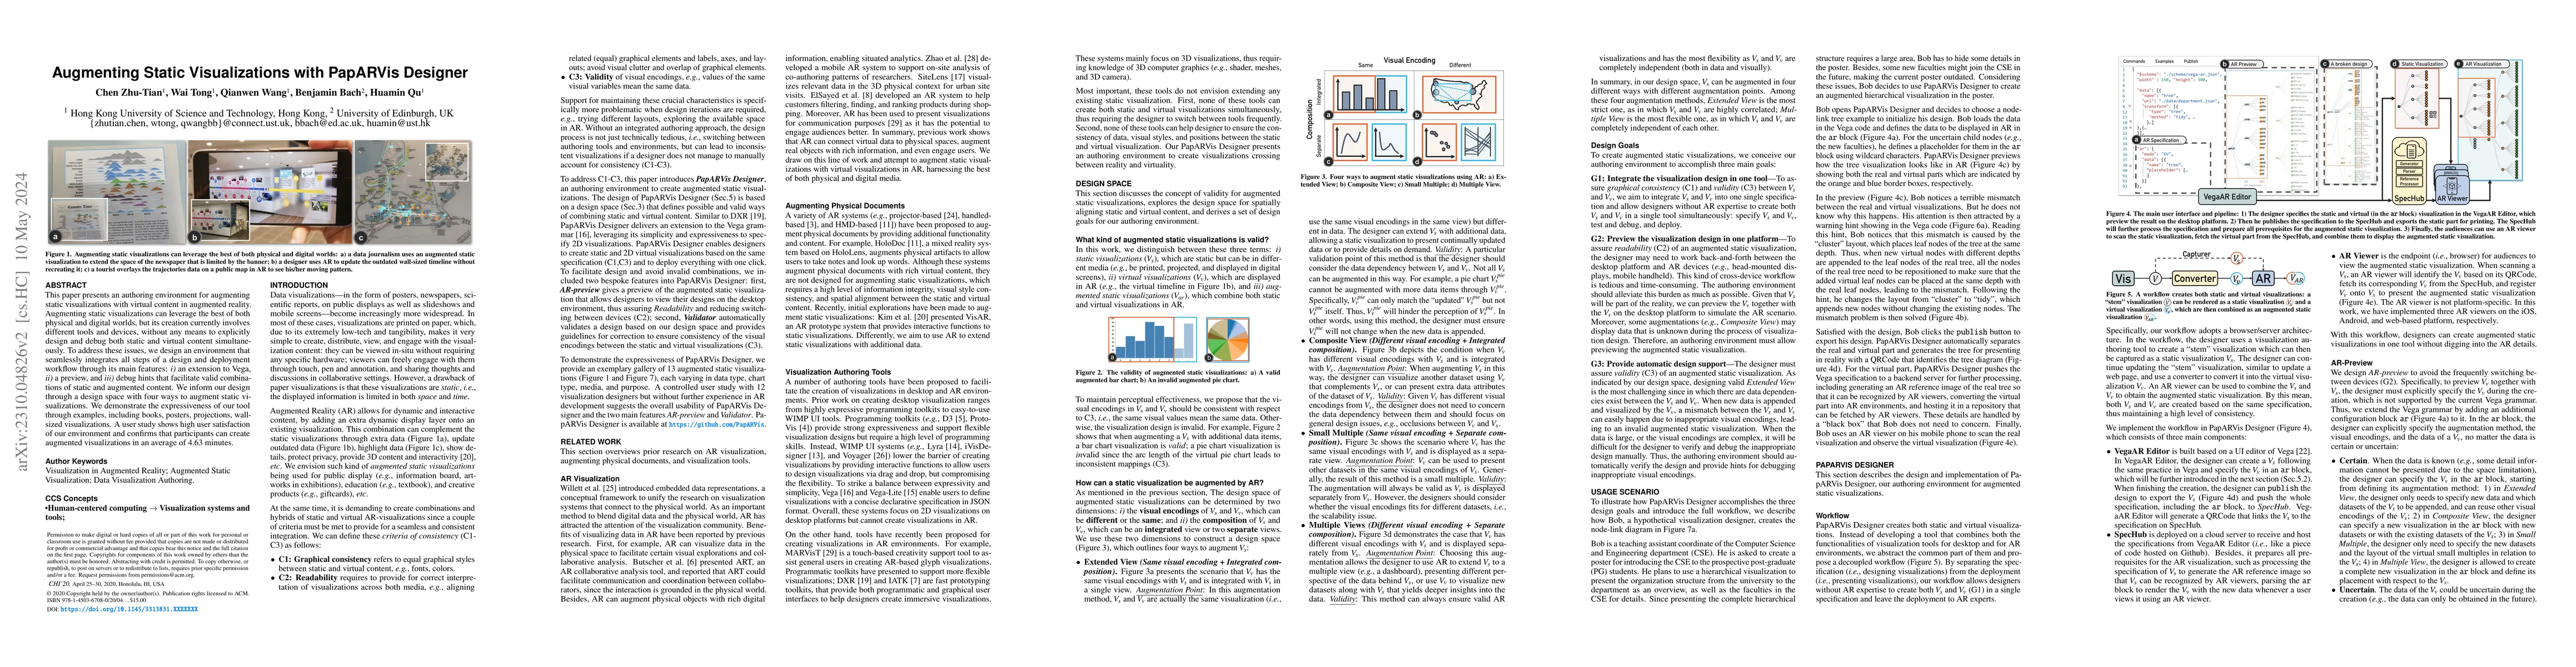
This paper presents an authoring environment for augmenting static visualizations with virtual content in augmented reality. Augmenting static visualizations can leverage the best of both physical a...
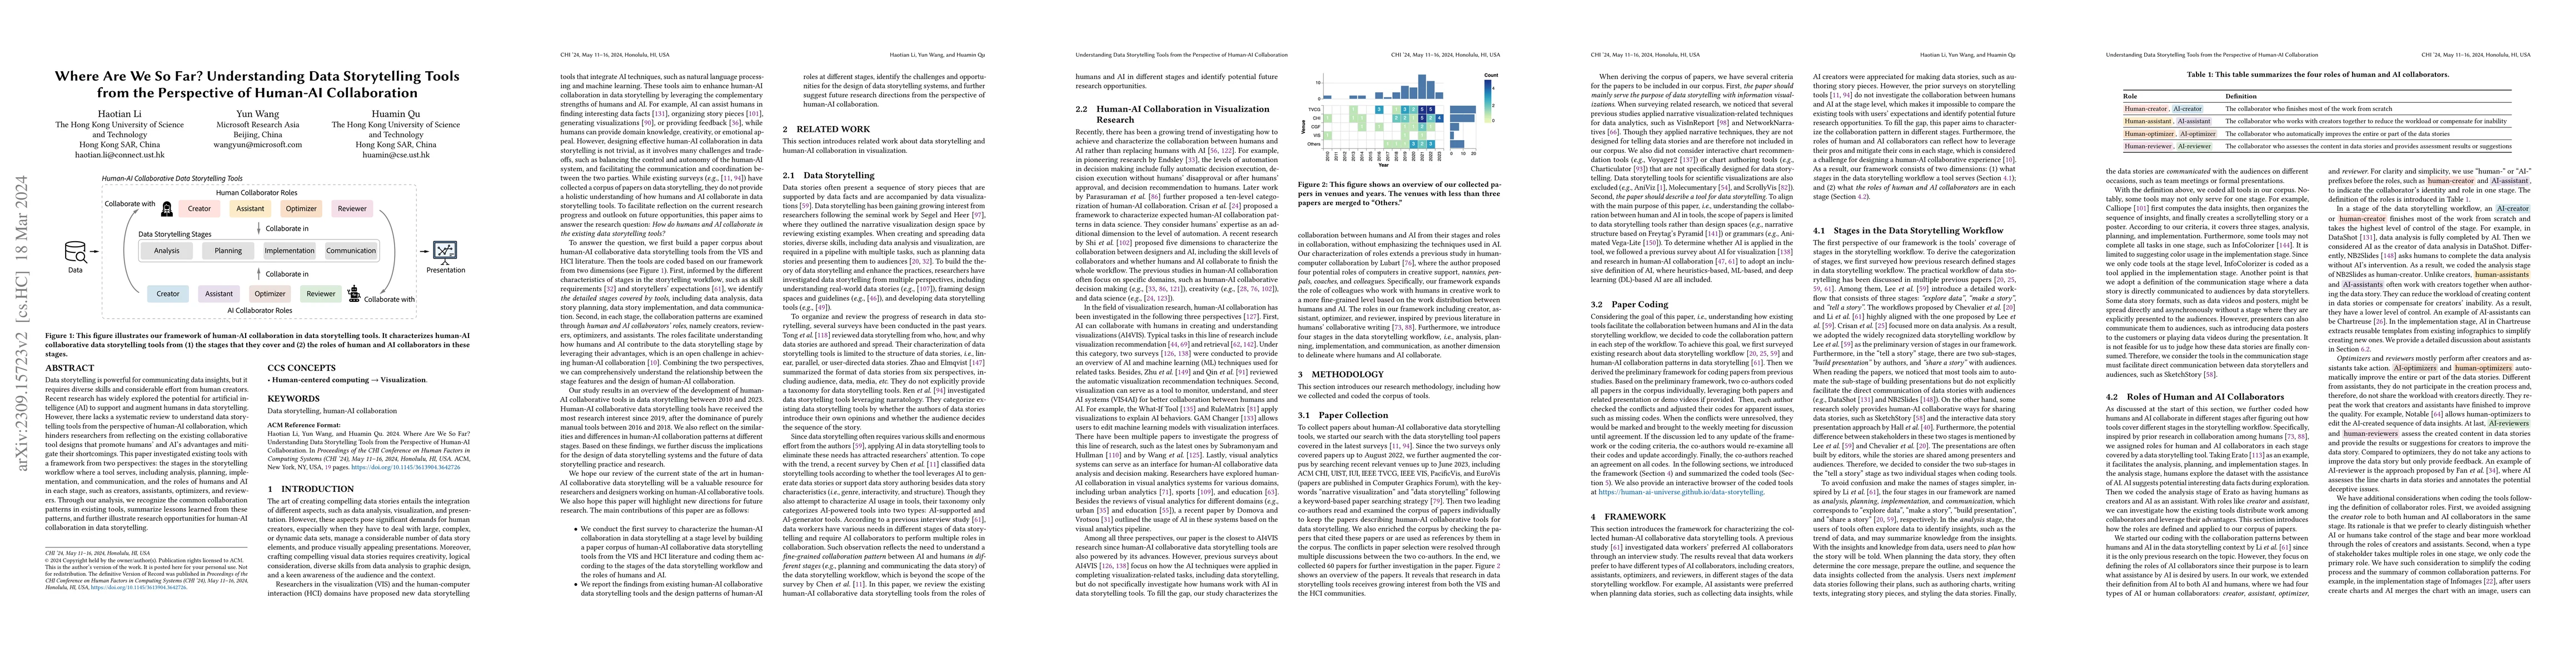
Data storytelling is powerful for communicating data insights, but it requires diverse skills and considerable effort from human creators. Recent research has widely explored the potential for artif...
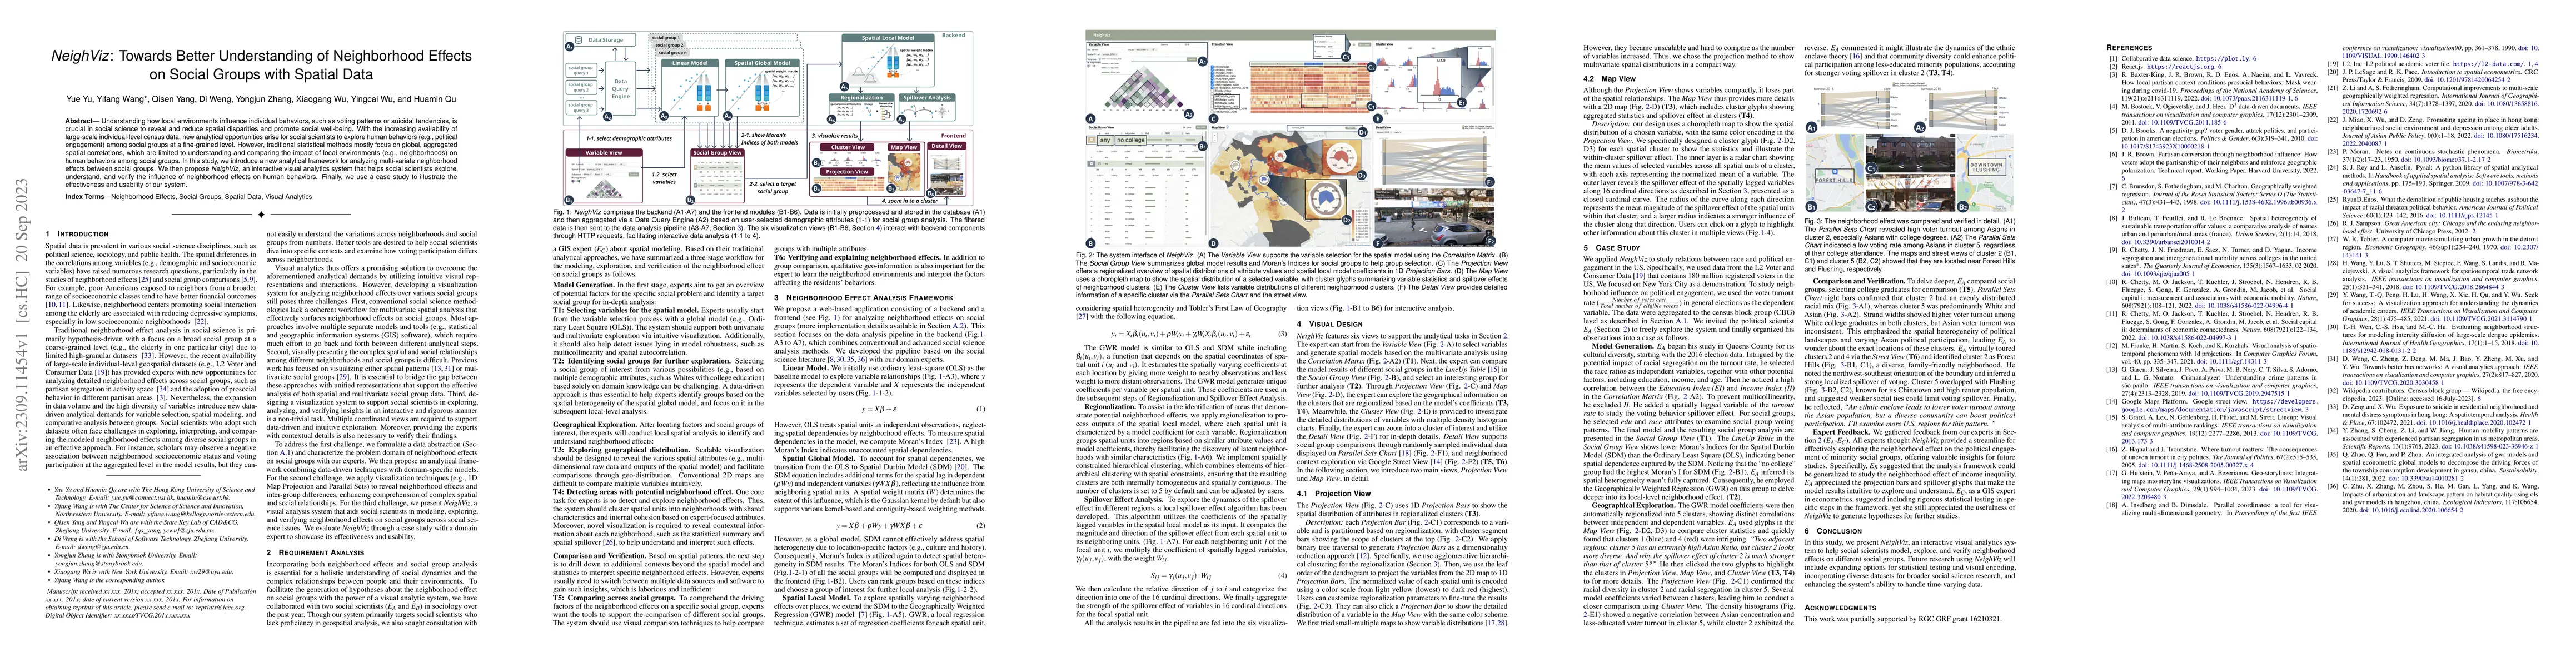
Understanding how local environments influence individual behaviors, such as voting patterns or suicidal tendencies, is crucial in social science to reveal and reduce spatial disparities and promote...
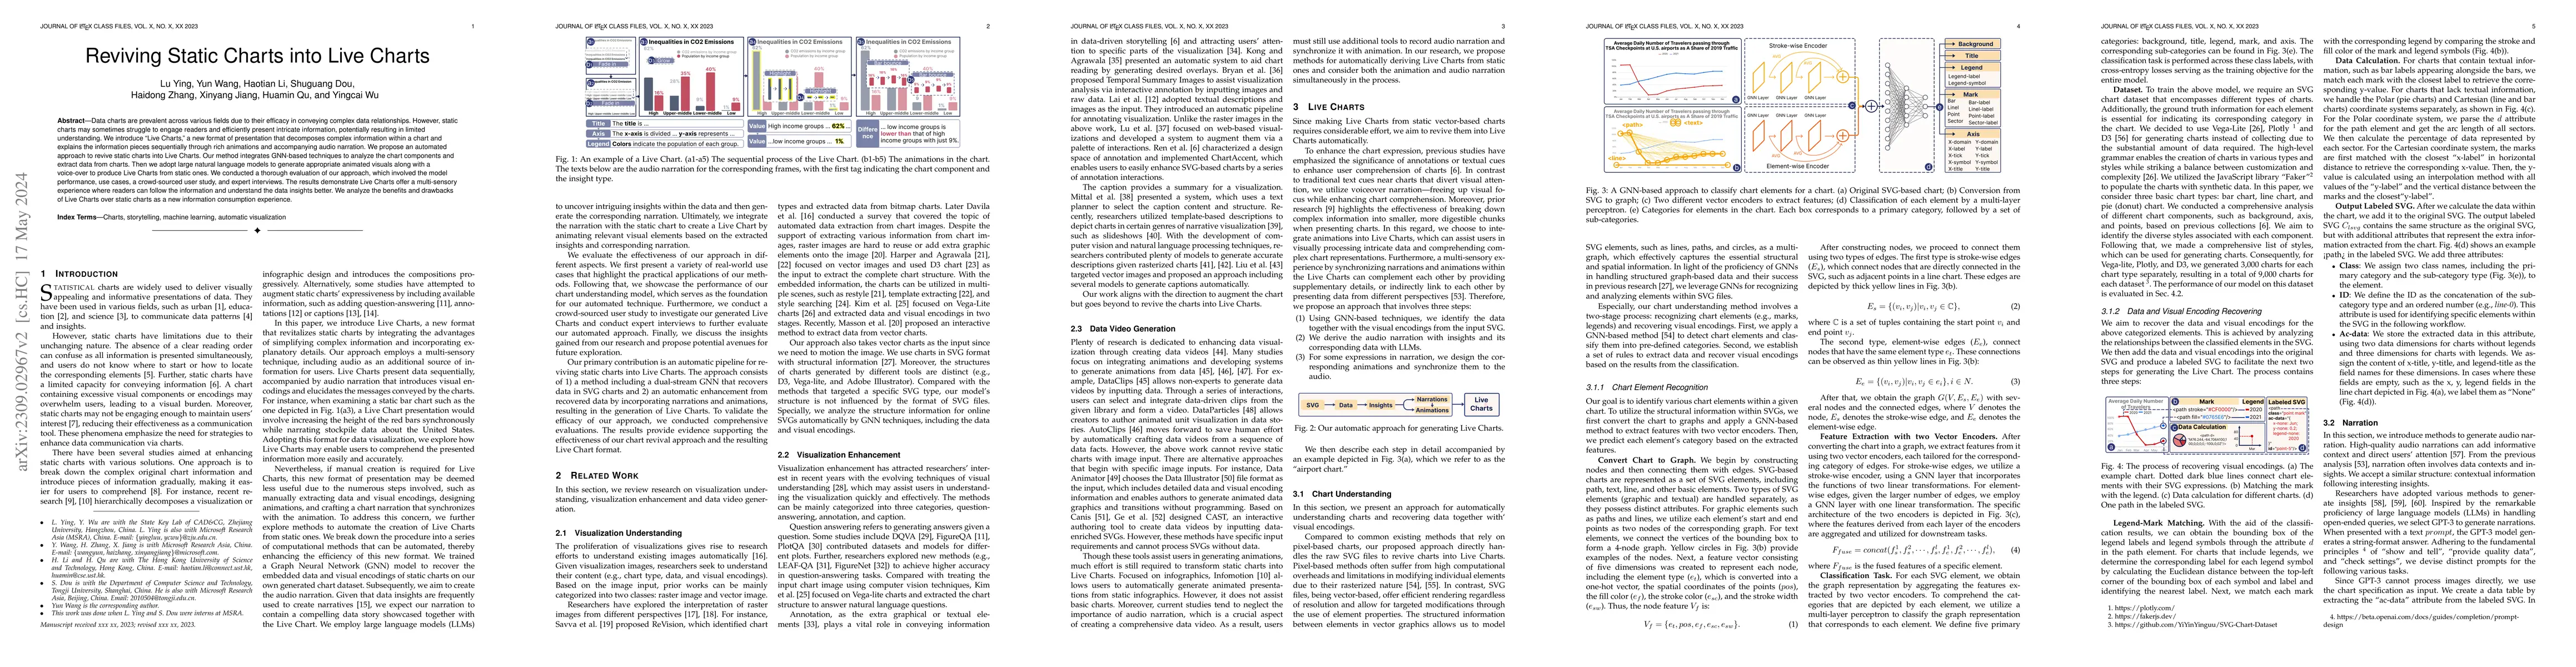
Data charts are prevalent across various fields due to their efficacy in conveying complex data relationships. However, static charts may sometimes struggle to engage readers and efficiently present...
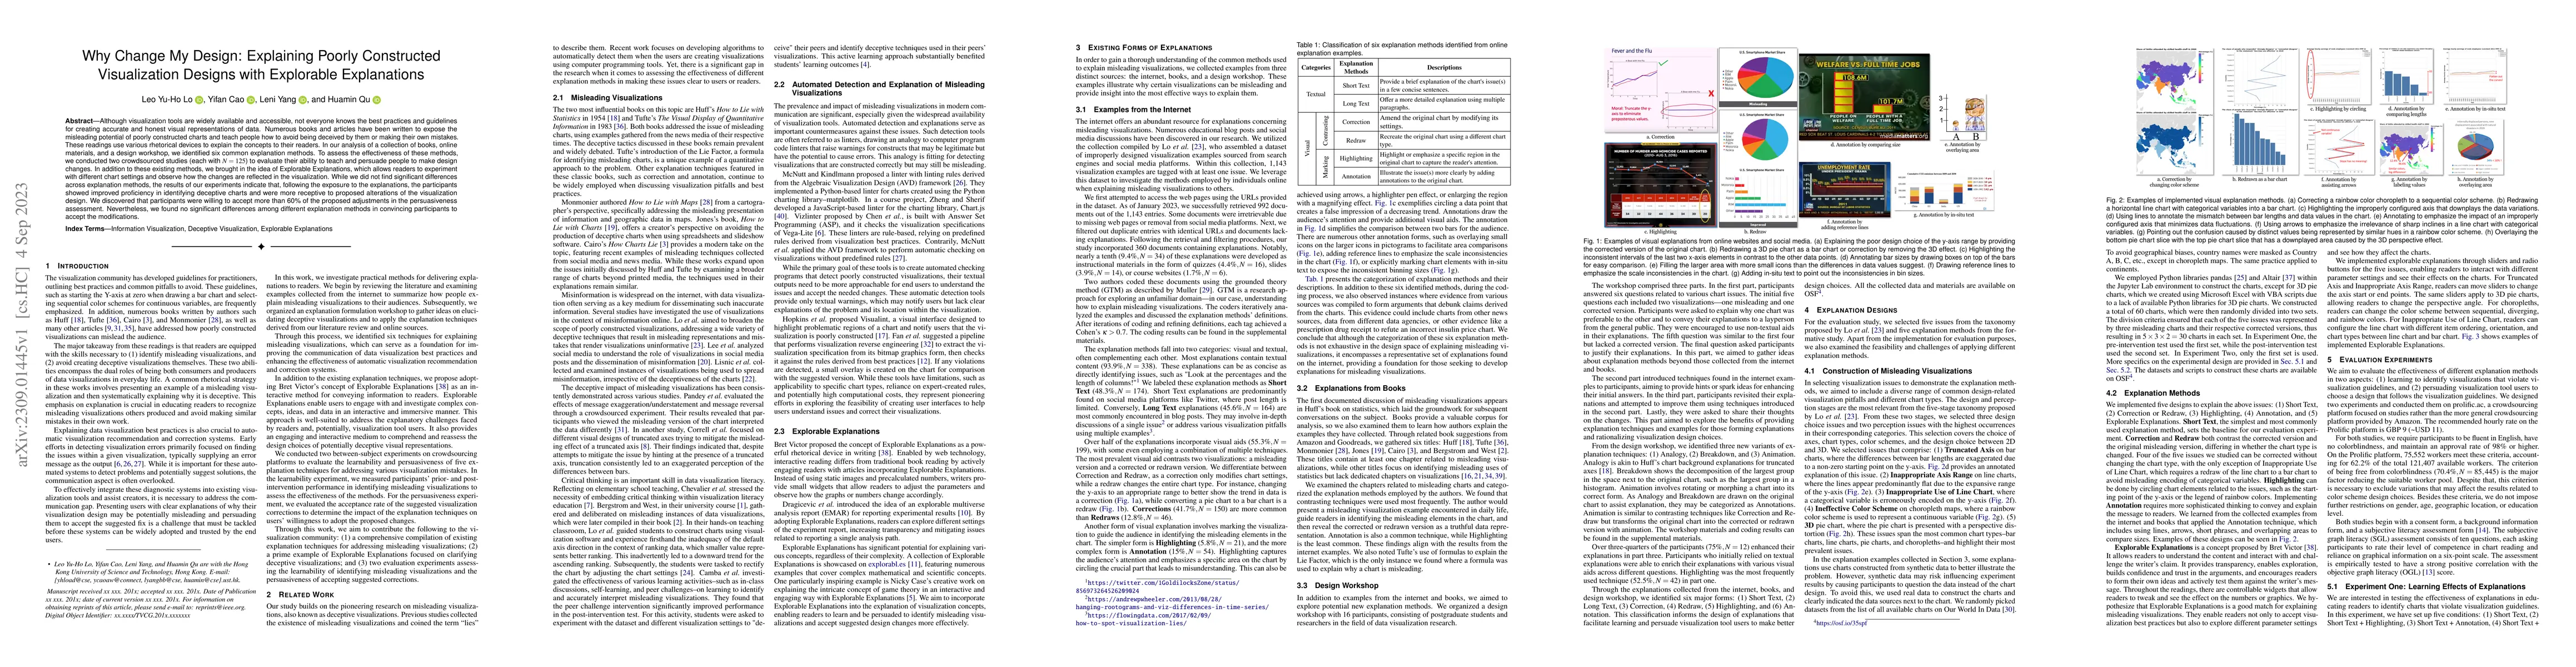
Although visualization tools are widely available and accessible, not everyone knows the best practices and guidelines for creating accurate and honest visual representations of data. Numerous books...
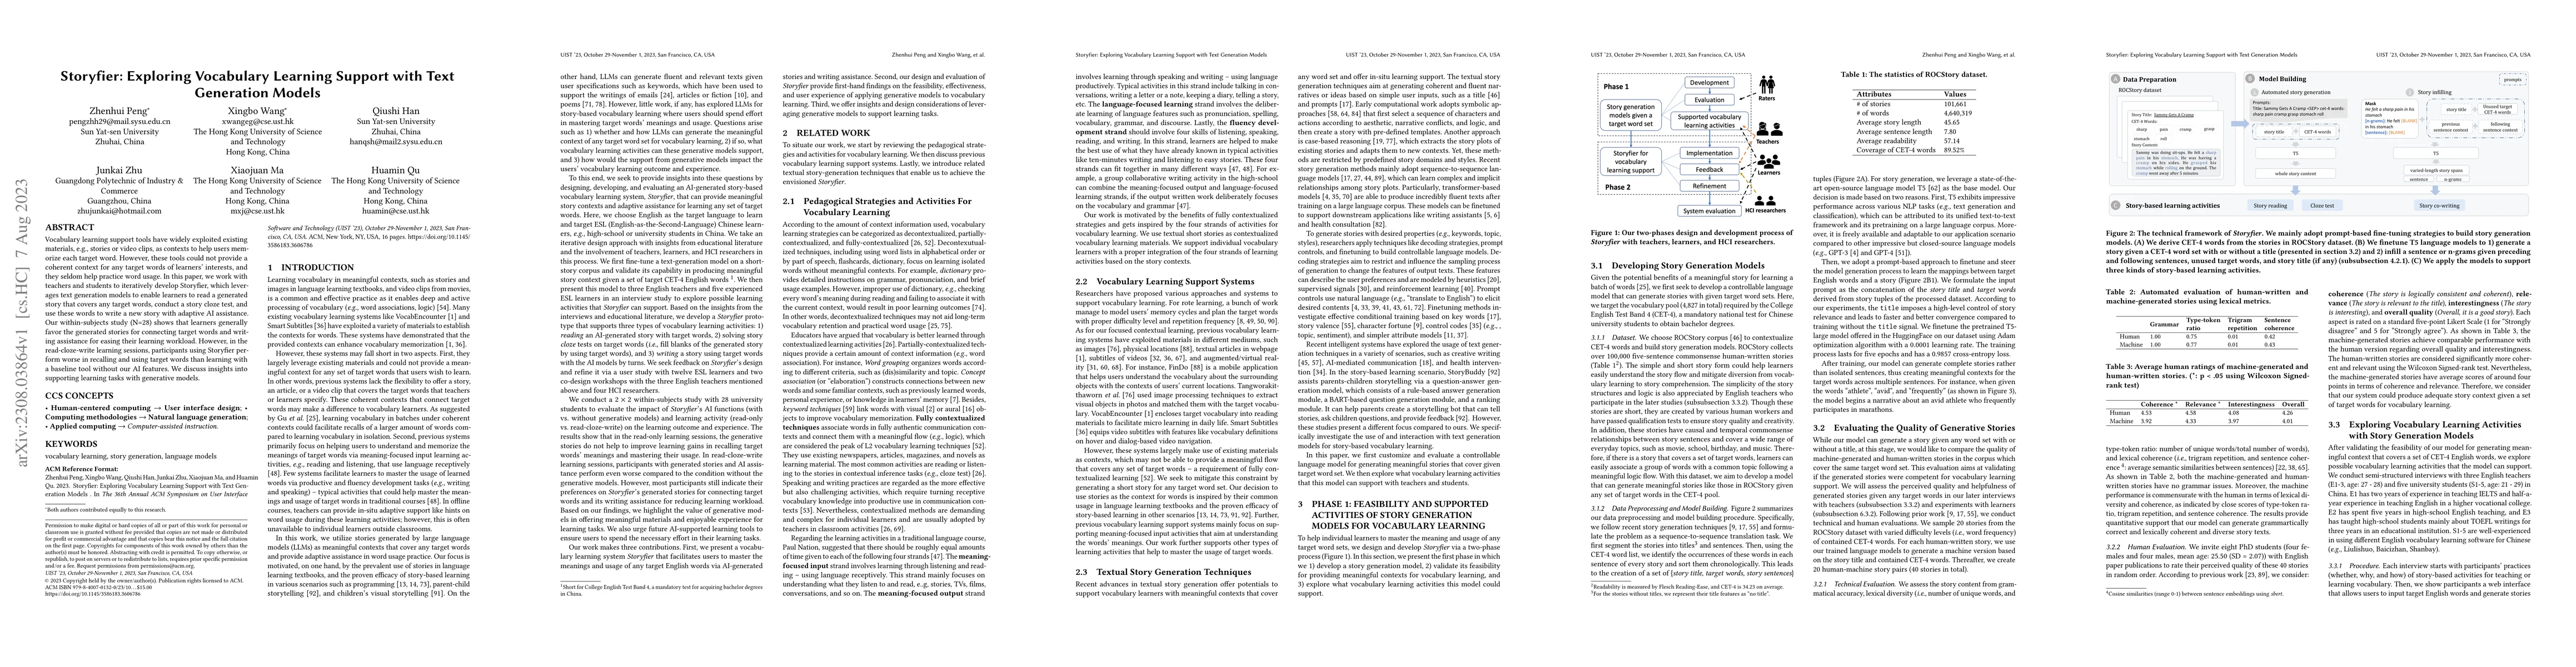
Vocabulary learning support tools have widely exploited existing materials, e.g., stories or video clips, as contexts to help users memorize each target word. However, these tools could not provide ...
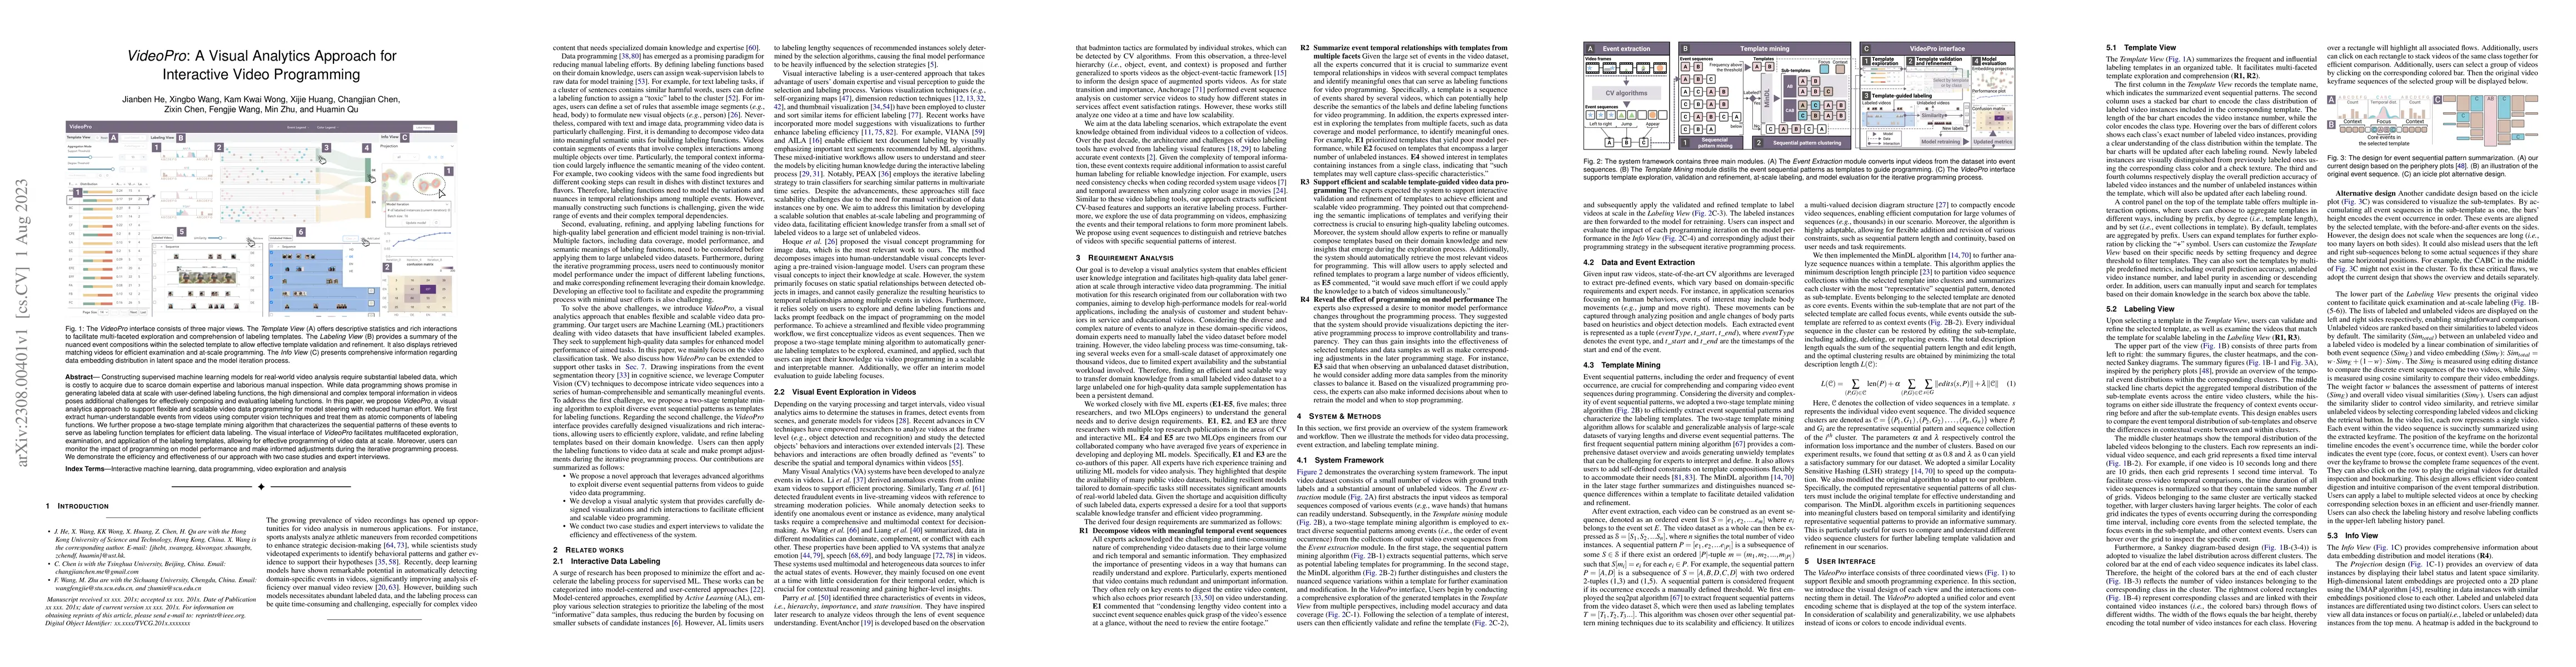
Constructing supervised machine learning models for real-world video analysis require substantial labeled data, which is costly to acquire due to scarce domain expertise and laborious manual inspect...
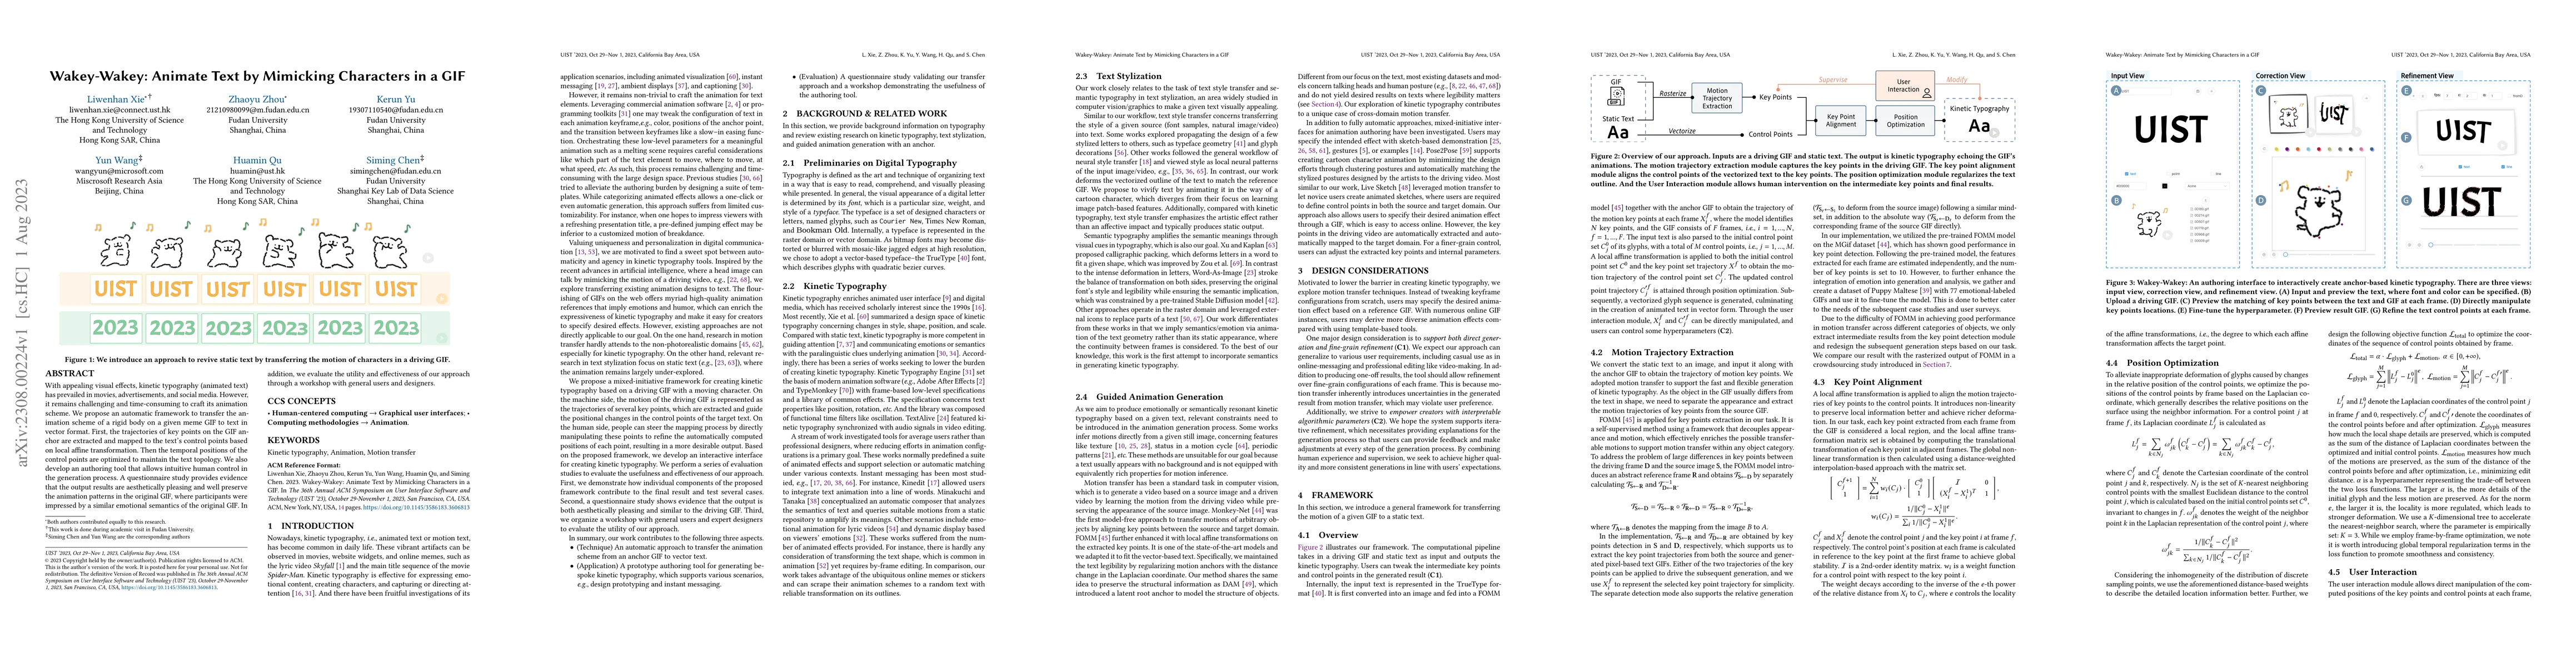
With appealing visual effects, kinetic typography (animated text) has prevailed in movies, advertisements, and social media. However, it remains challenging and time-consuming to craft its animation...
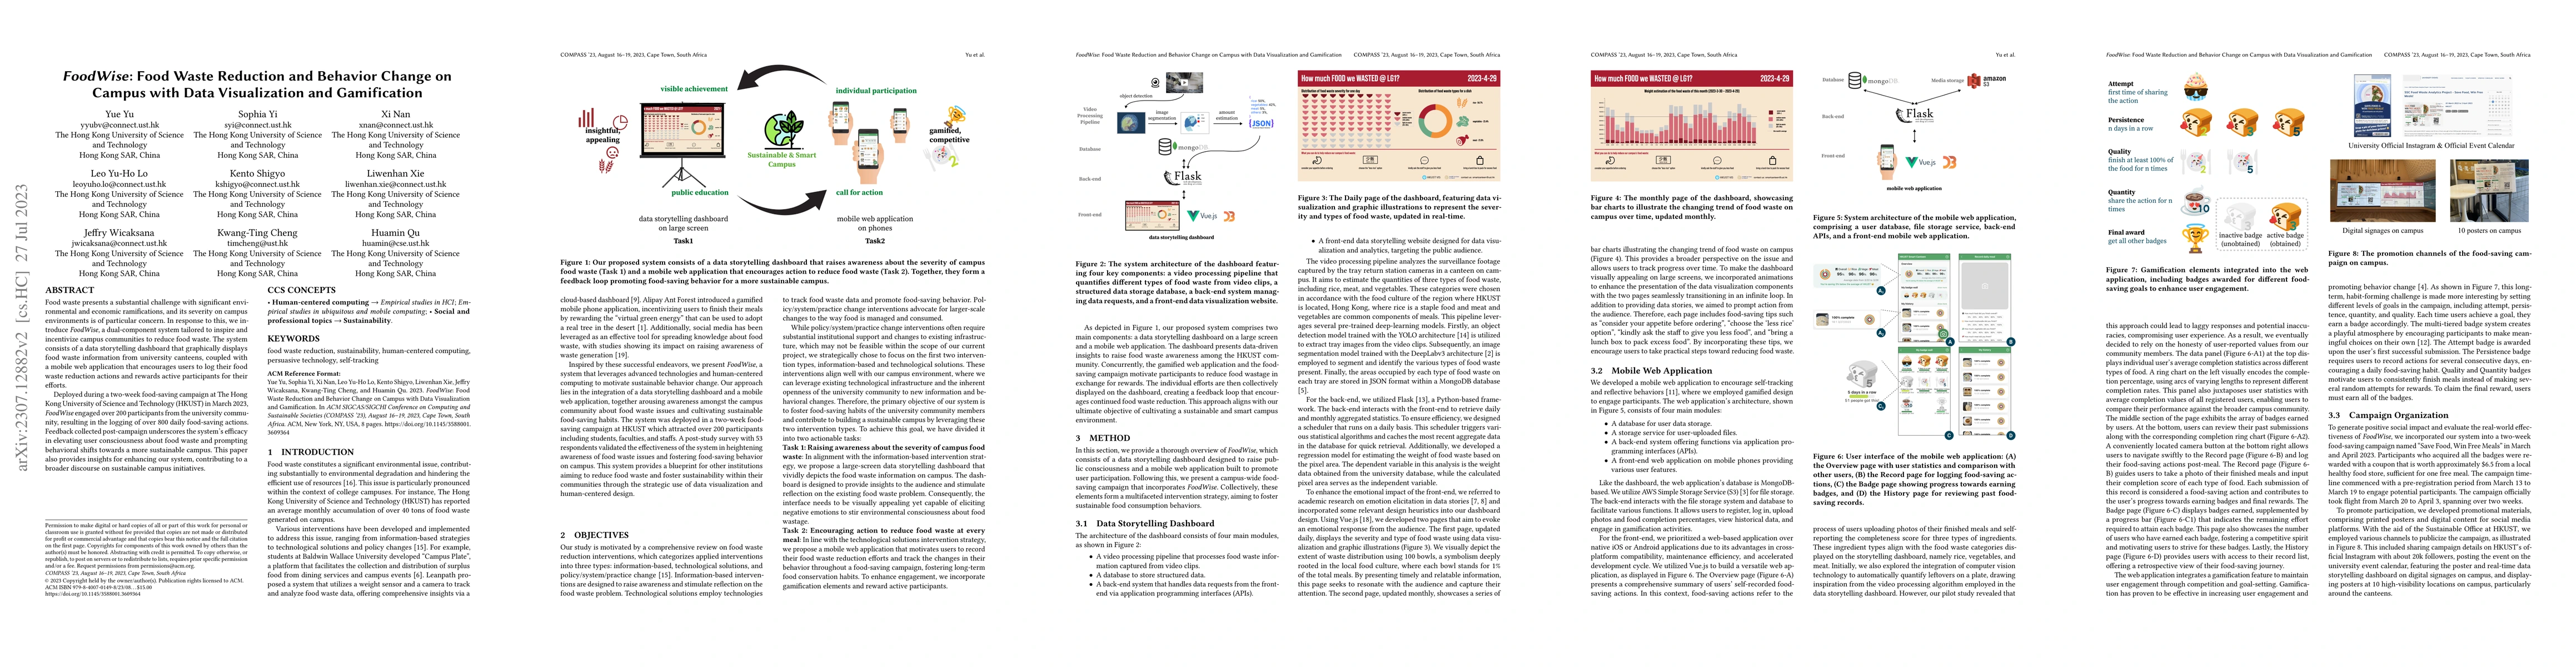
Food waste presents a substantial challenge with significant environmental and economic ramifications, and its severity on campus environments is of particular concern. In response to this, we intro...
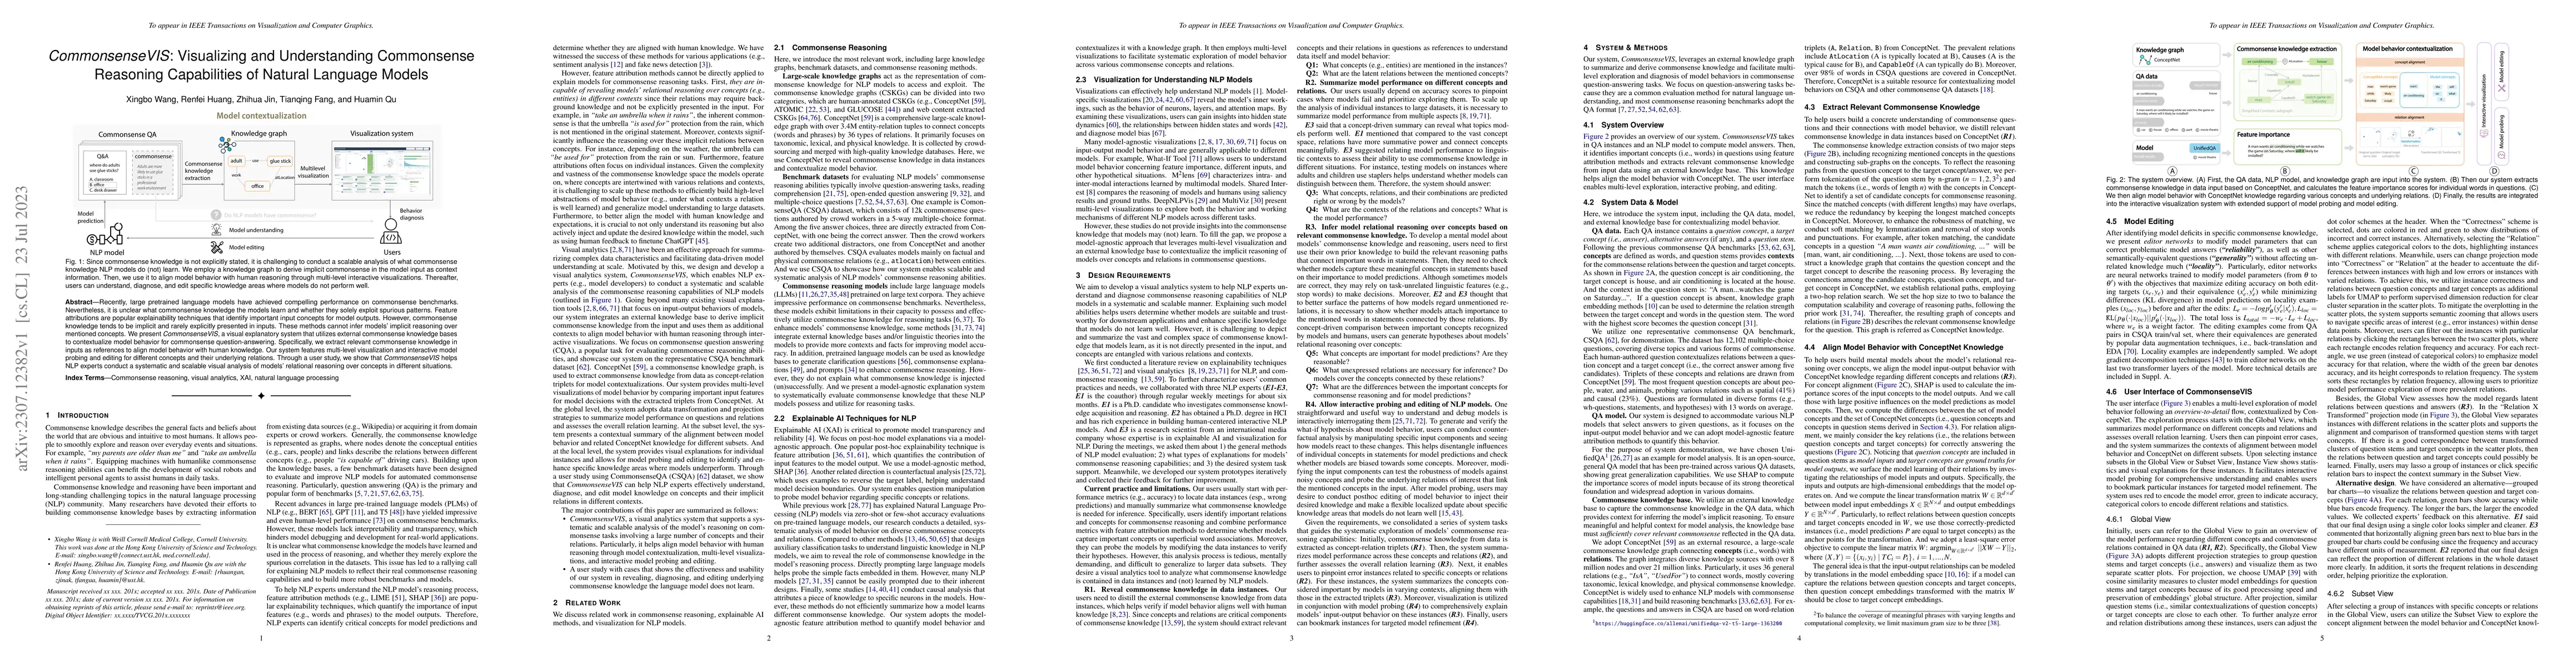
Recently, large pretrained language models have achieved compelling performance on commonsense benchmarks. Nevertheless, it is unclear what commonsense knowledge the models learn and whether they so...
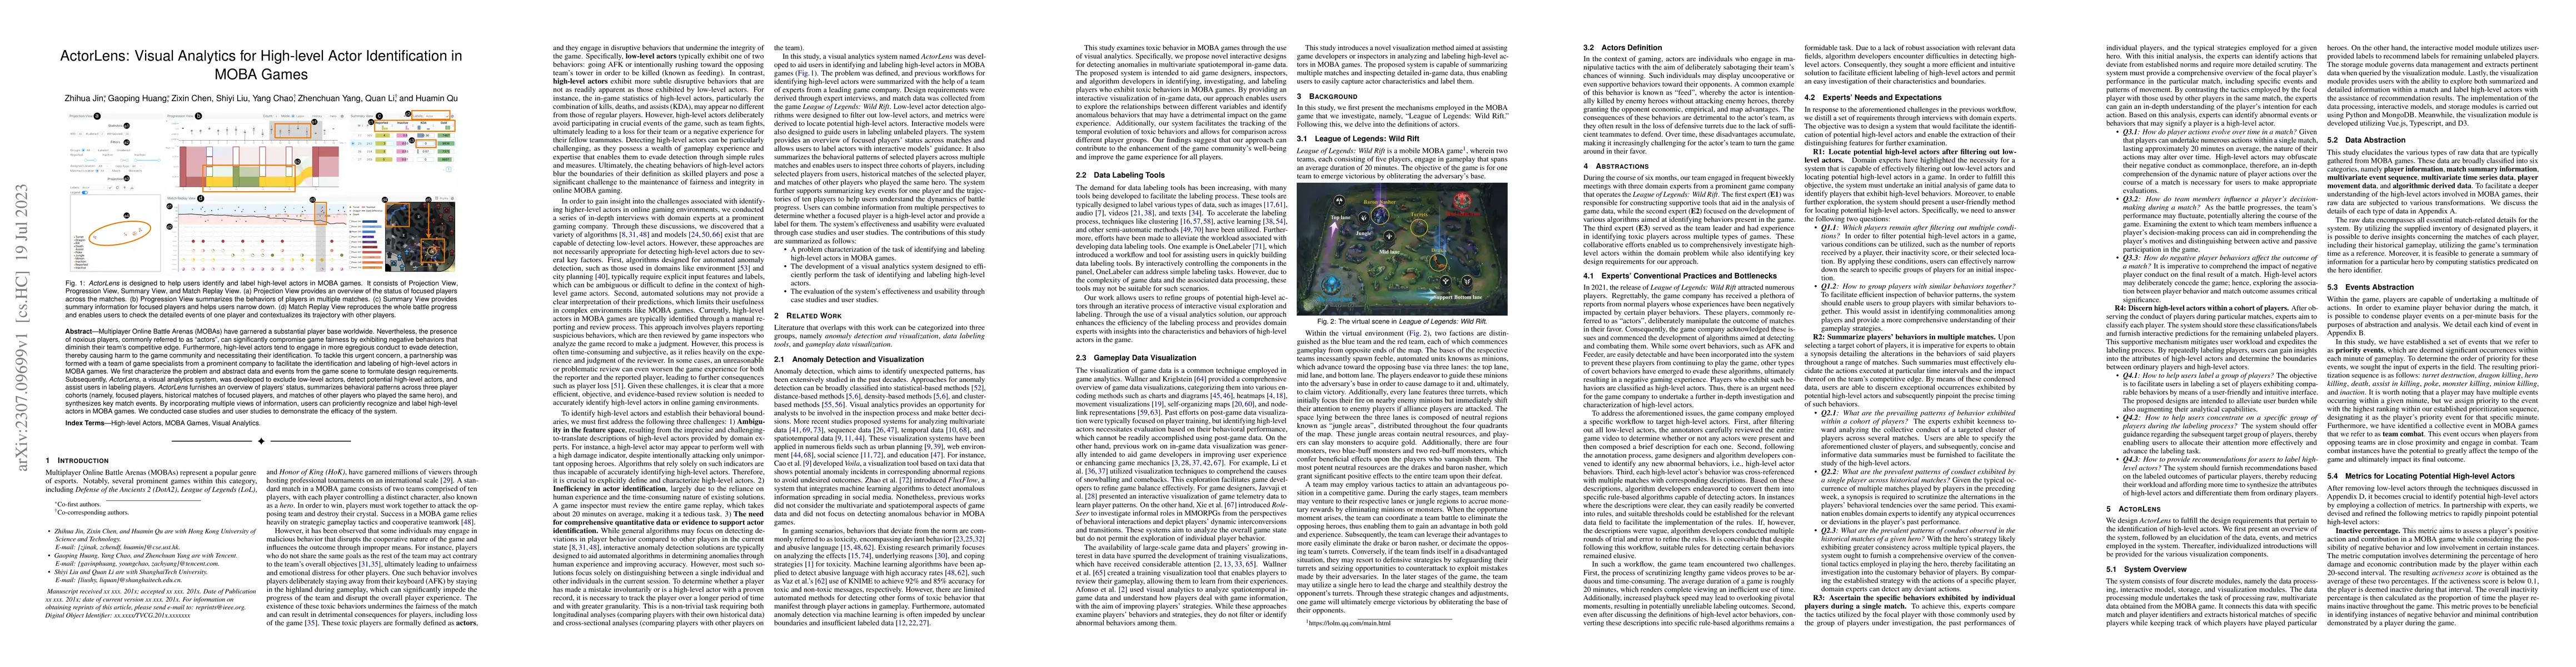
Multiplayer Online Battle Arenas (MOBAs) have garnered a substantial player base worldwide. Nevertheless, the presence of noxious players, commonly referred to as "actors", can significantly comprom...
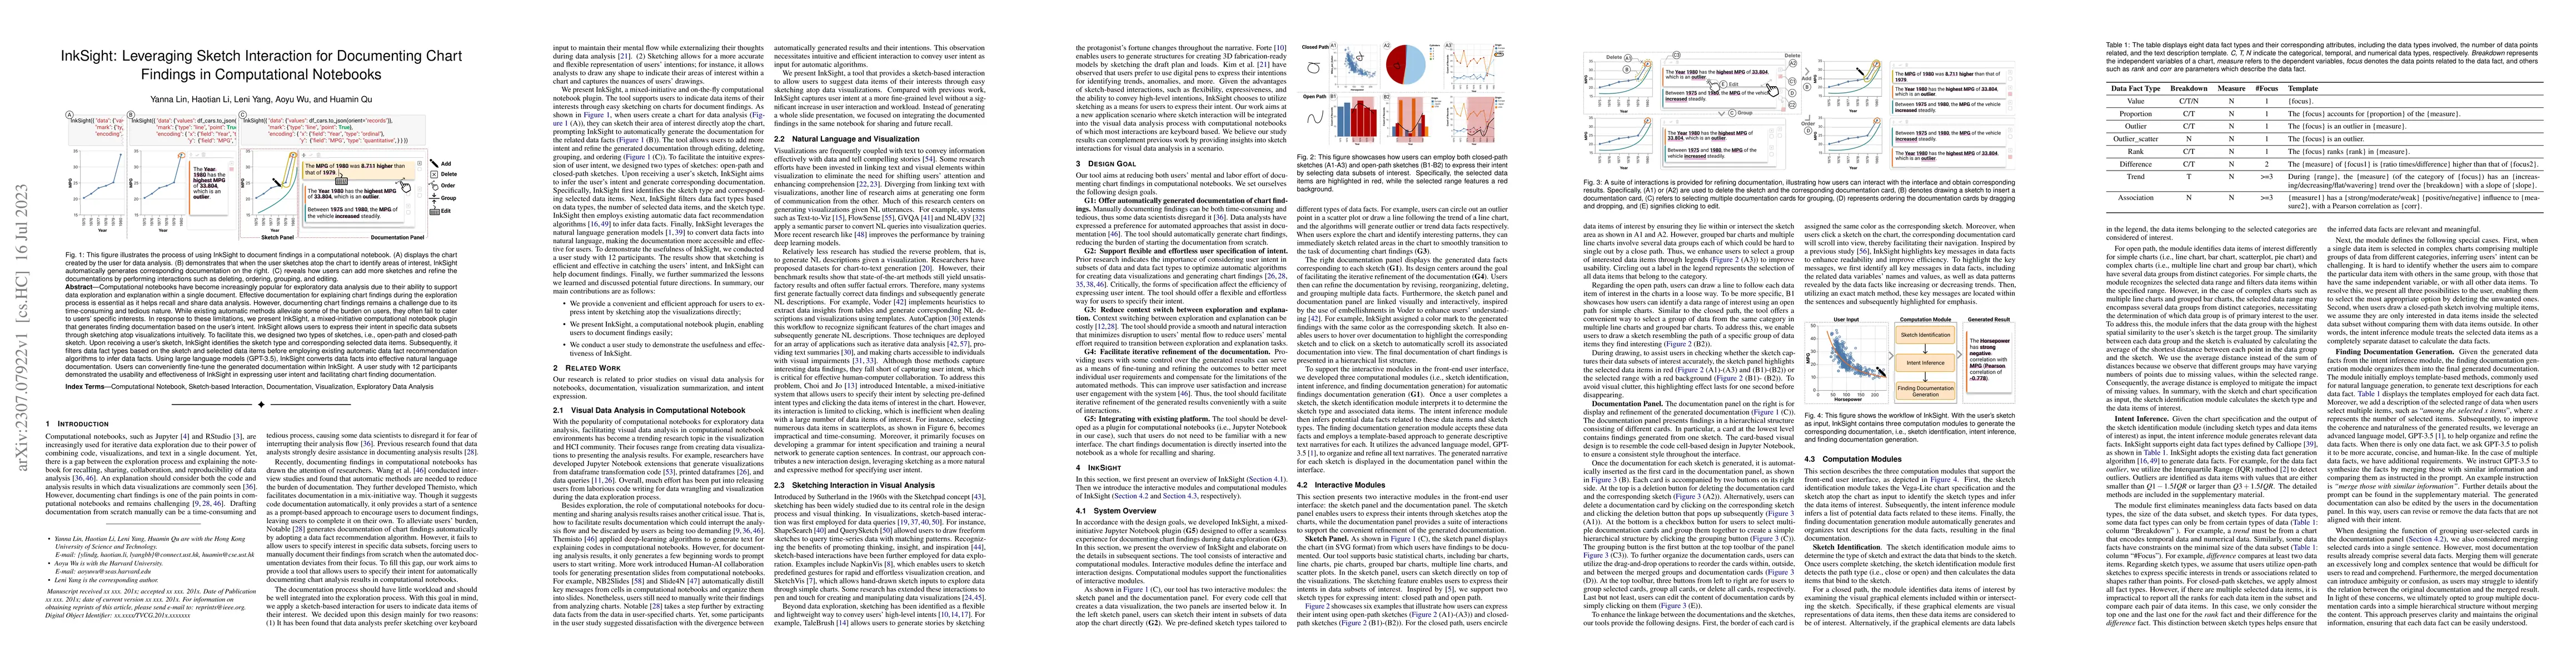
Computational notebooks have become increasingly popular for exploratory data analysis due to their ability to support data exploration and explanation within a single document. Effective documentat...
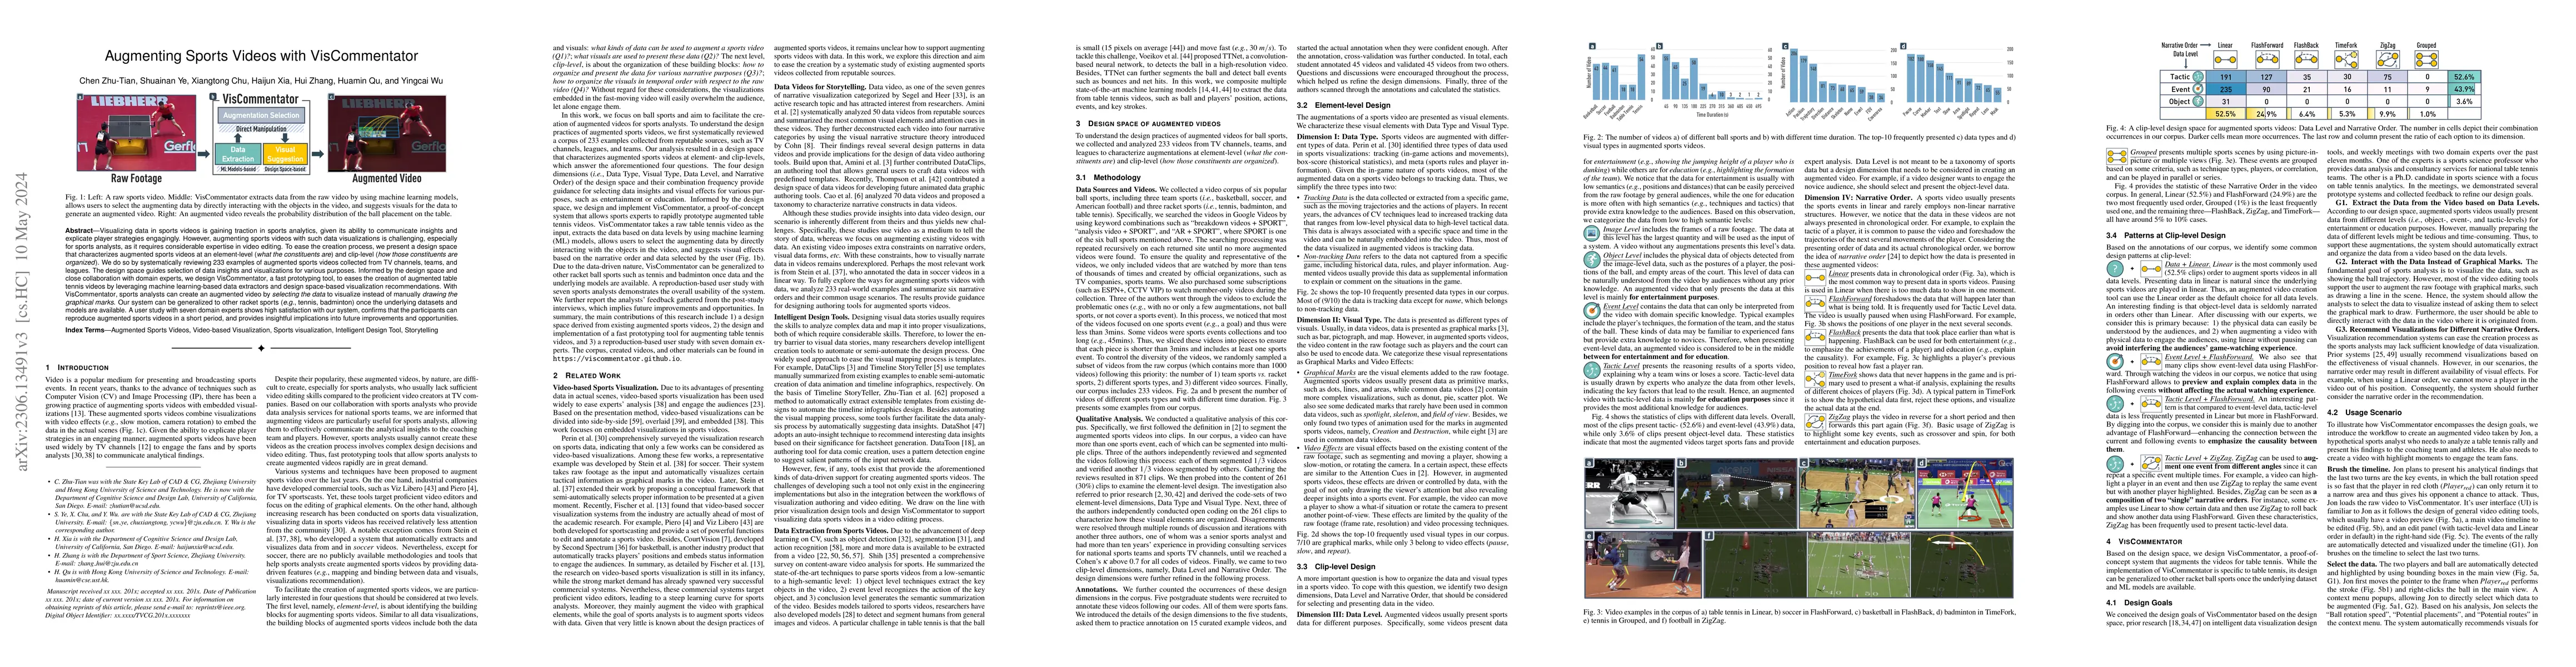
Visualizing data in sports videos is gaining traction in sports analytics, given its ability to communicate insights and explicate player strategies engagingly. However, augmenting sports videos wit...
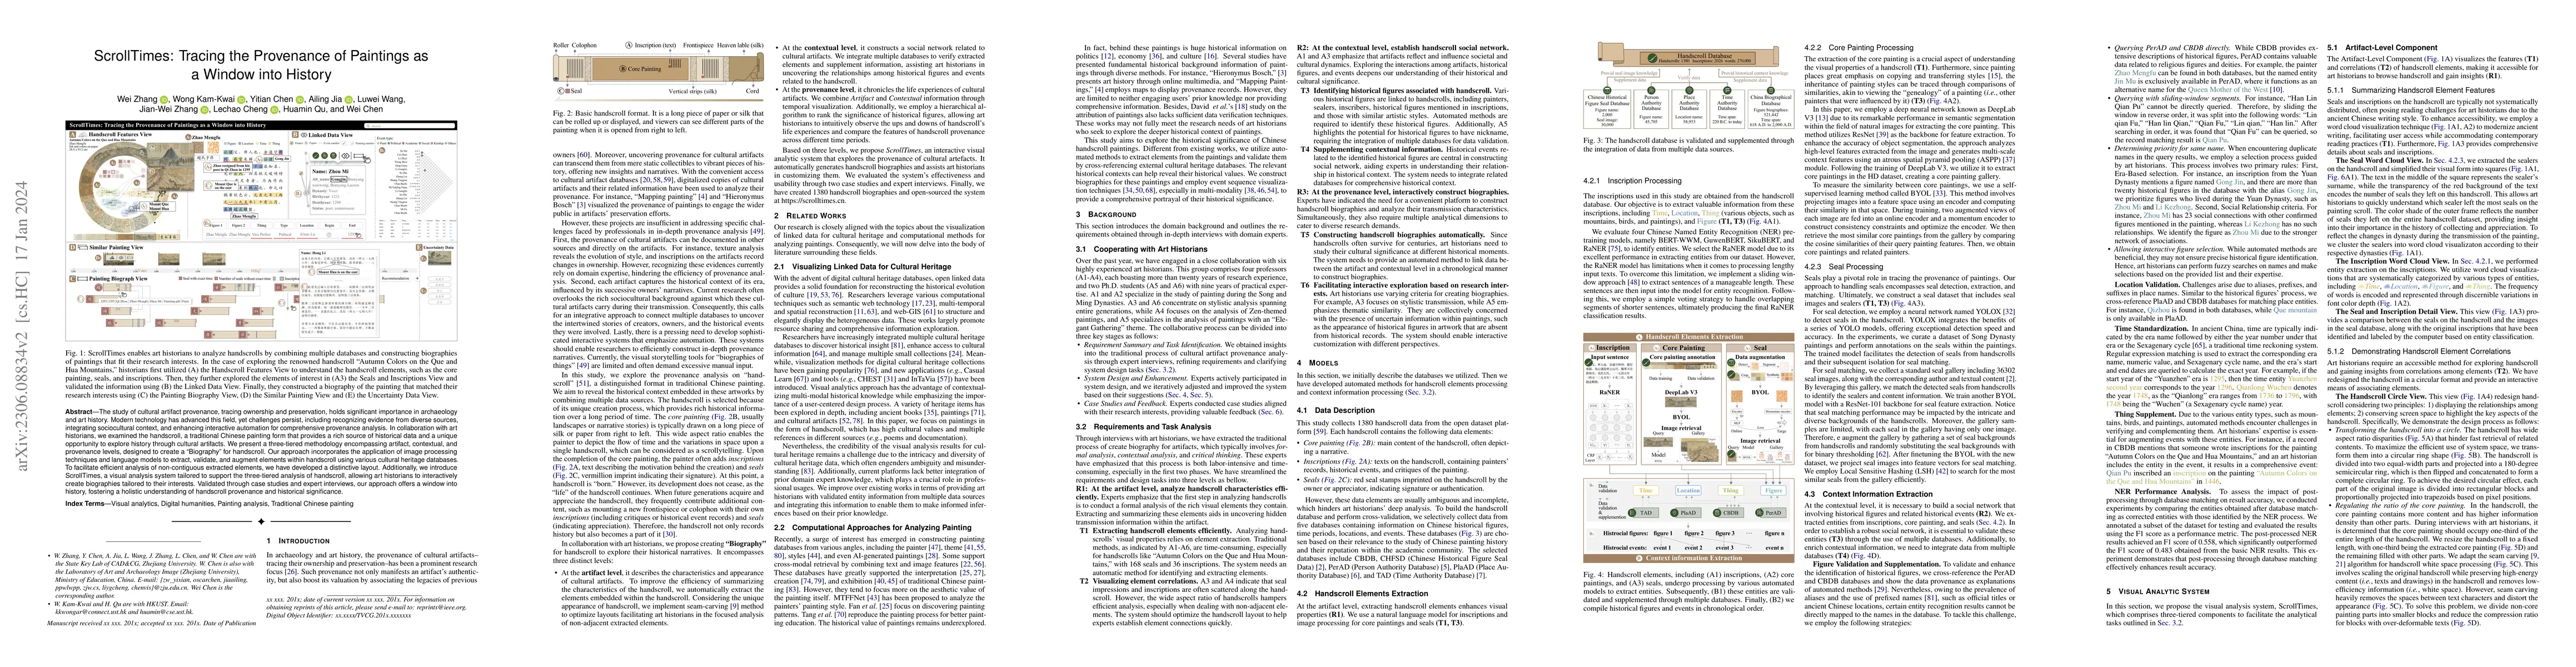
The study of cultural artifact provenance, tracing ownership and preservation, holds significant importance in archaeology and art history. Modern technology has advanced this field, yet challenges ...
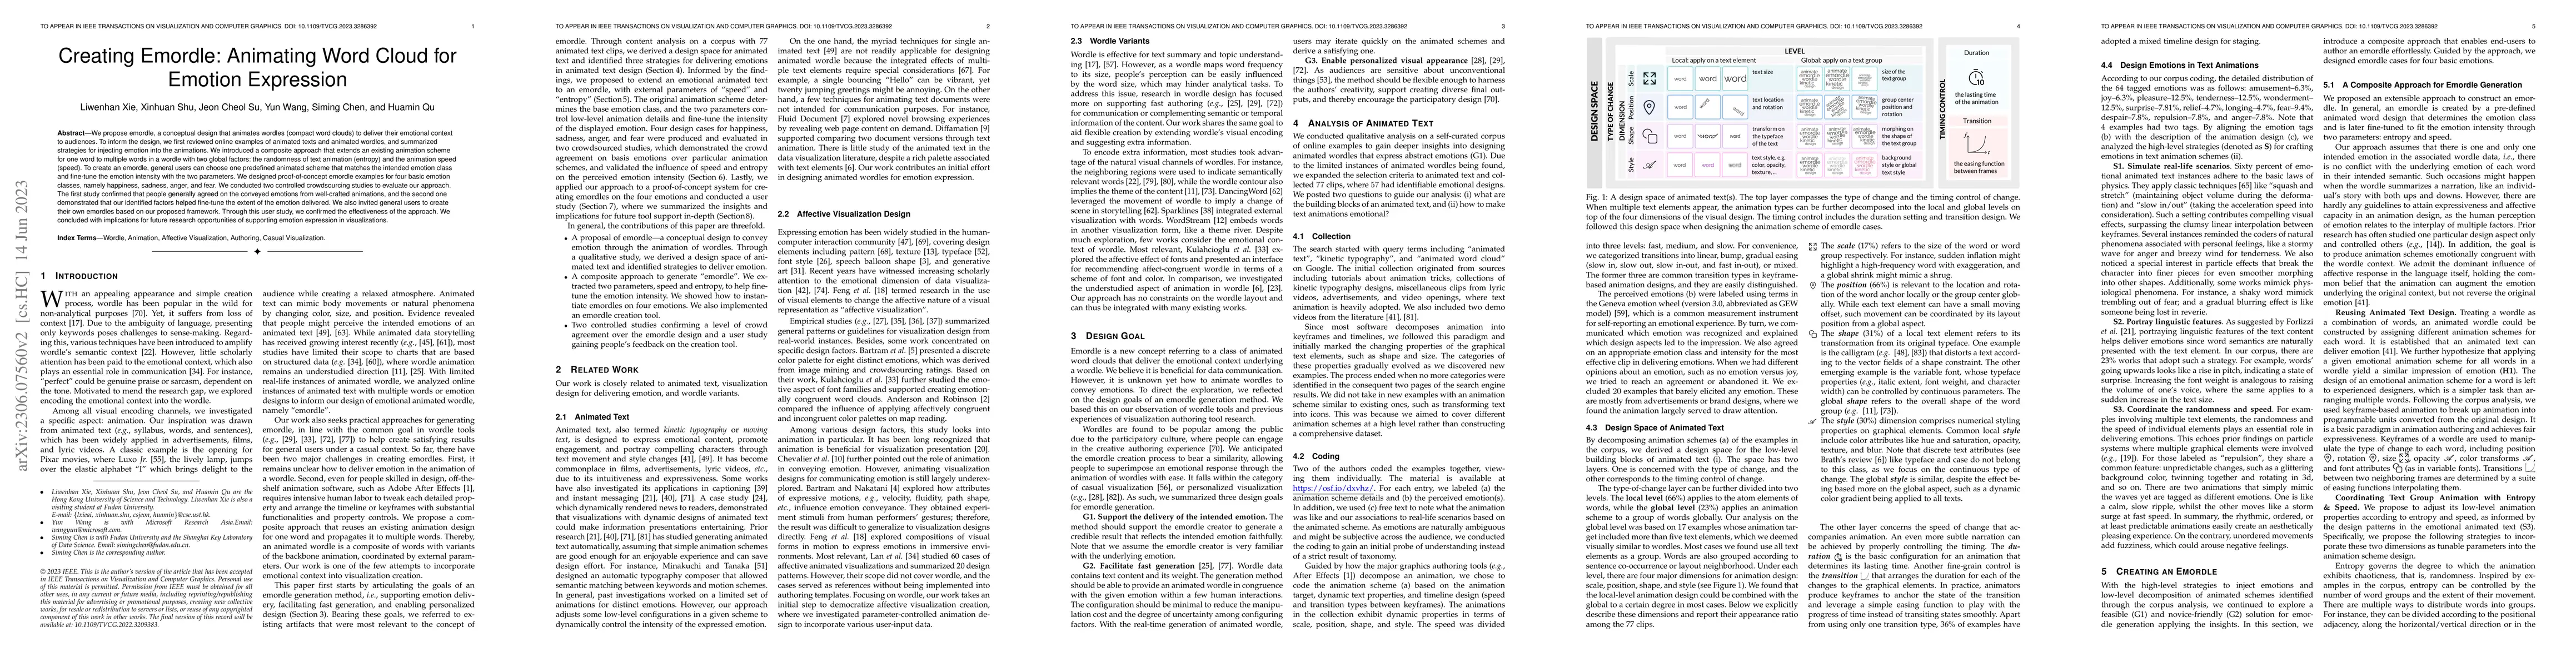
We propose emordle, a conceptual design that animates wordles (compact word clouds) to deliver their emotional context to the audiences. To inform the design, we first reviewed online examples of an...
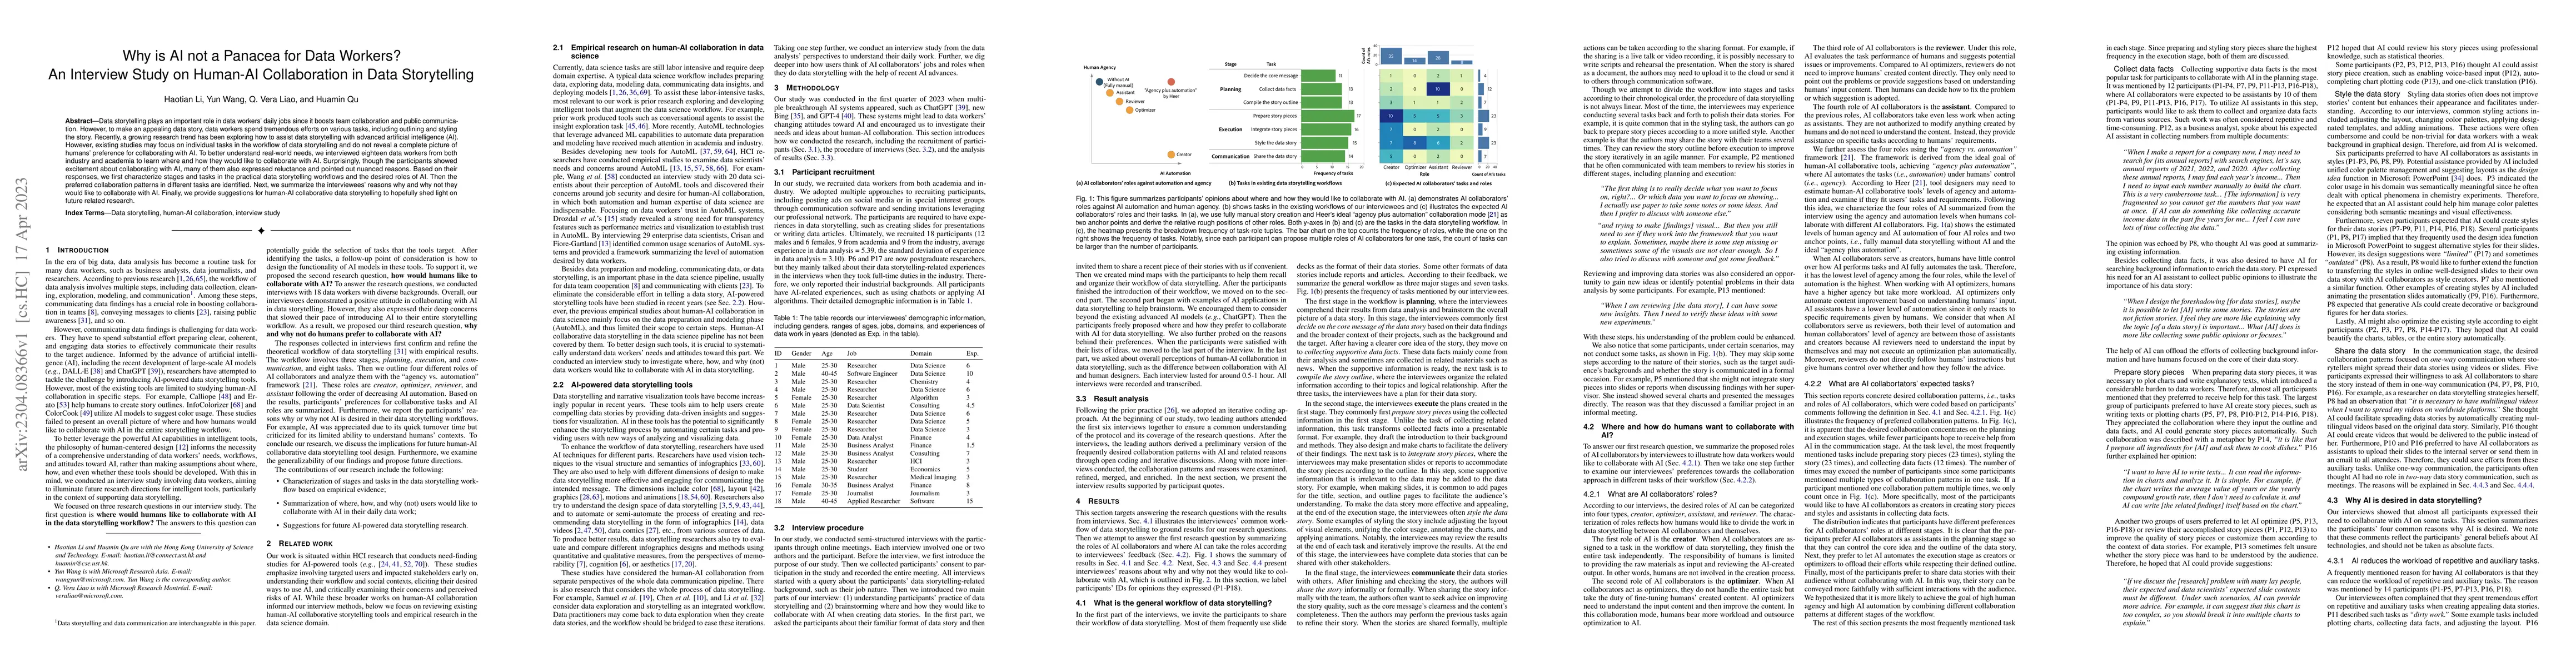
Data storytelling plays an important role in data workers' daily jobs since it boosts team collaboration and public communication. However, to make an appealing data story, data workers spend tremen...
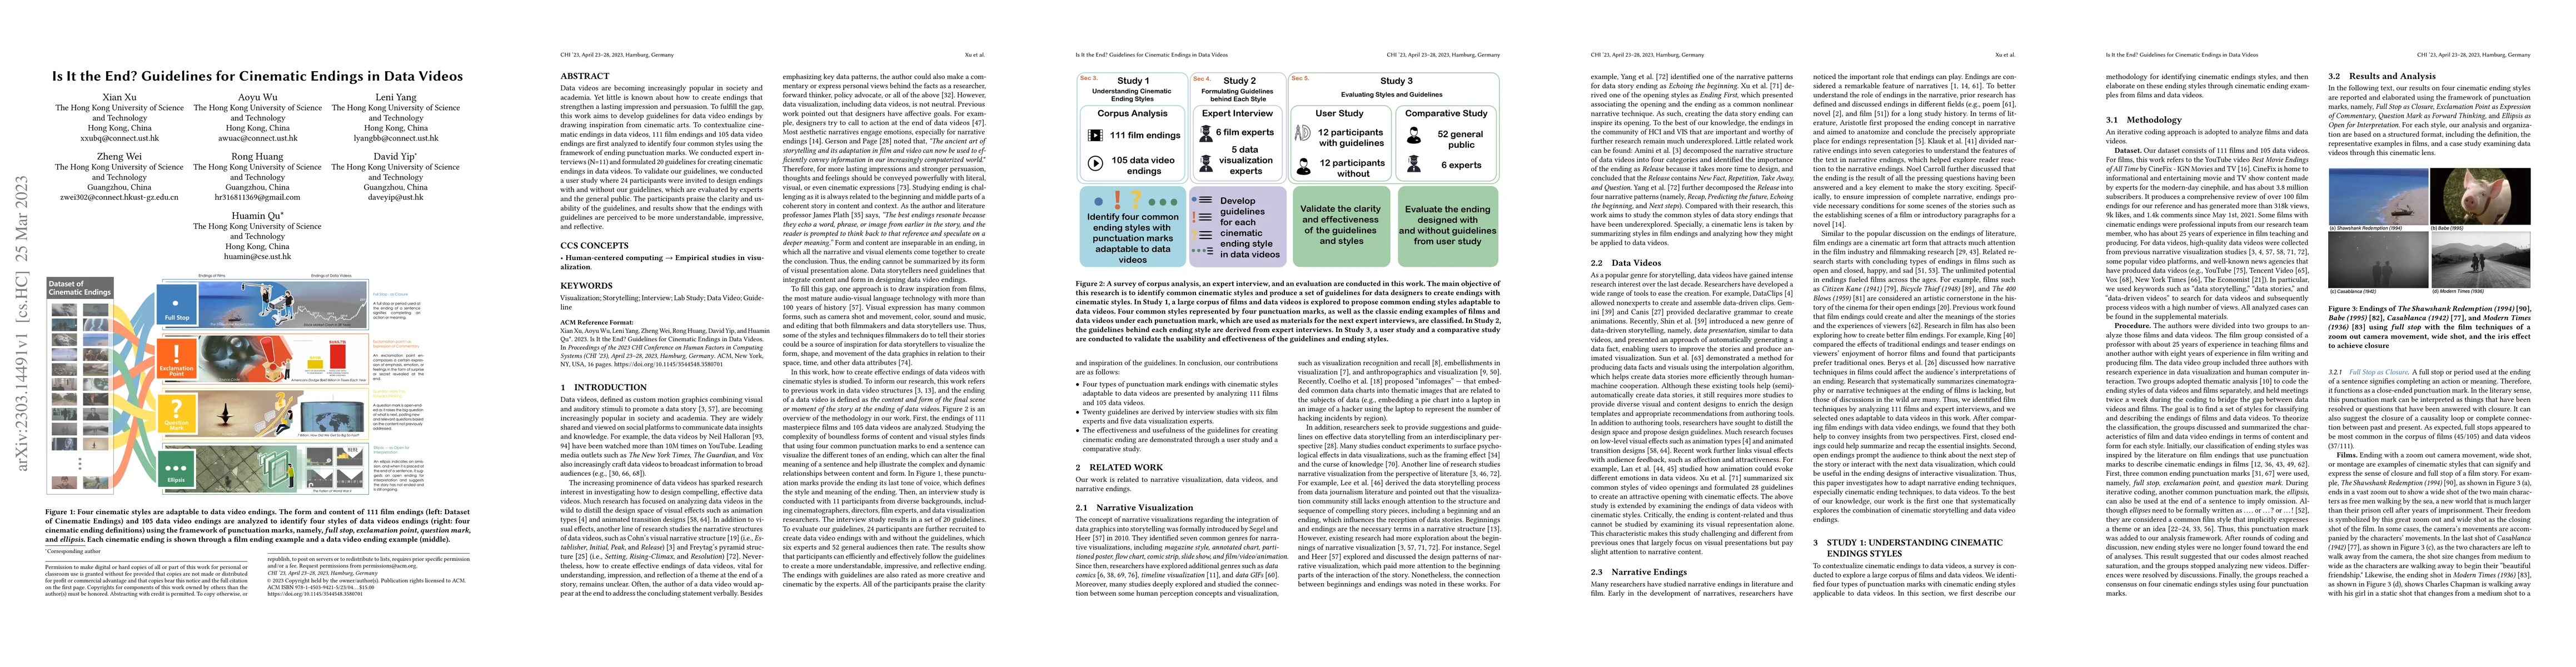
Data videos are becoming increasingly popular in society and academia. Yet little is known about how to create endings that strengthen a lasting impression and persuasion. To fulfill the gap, this w...
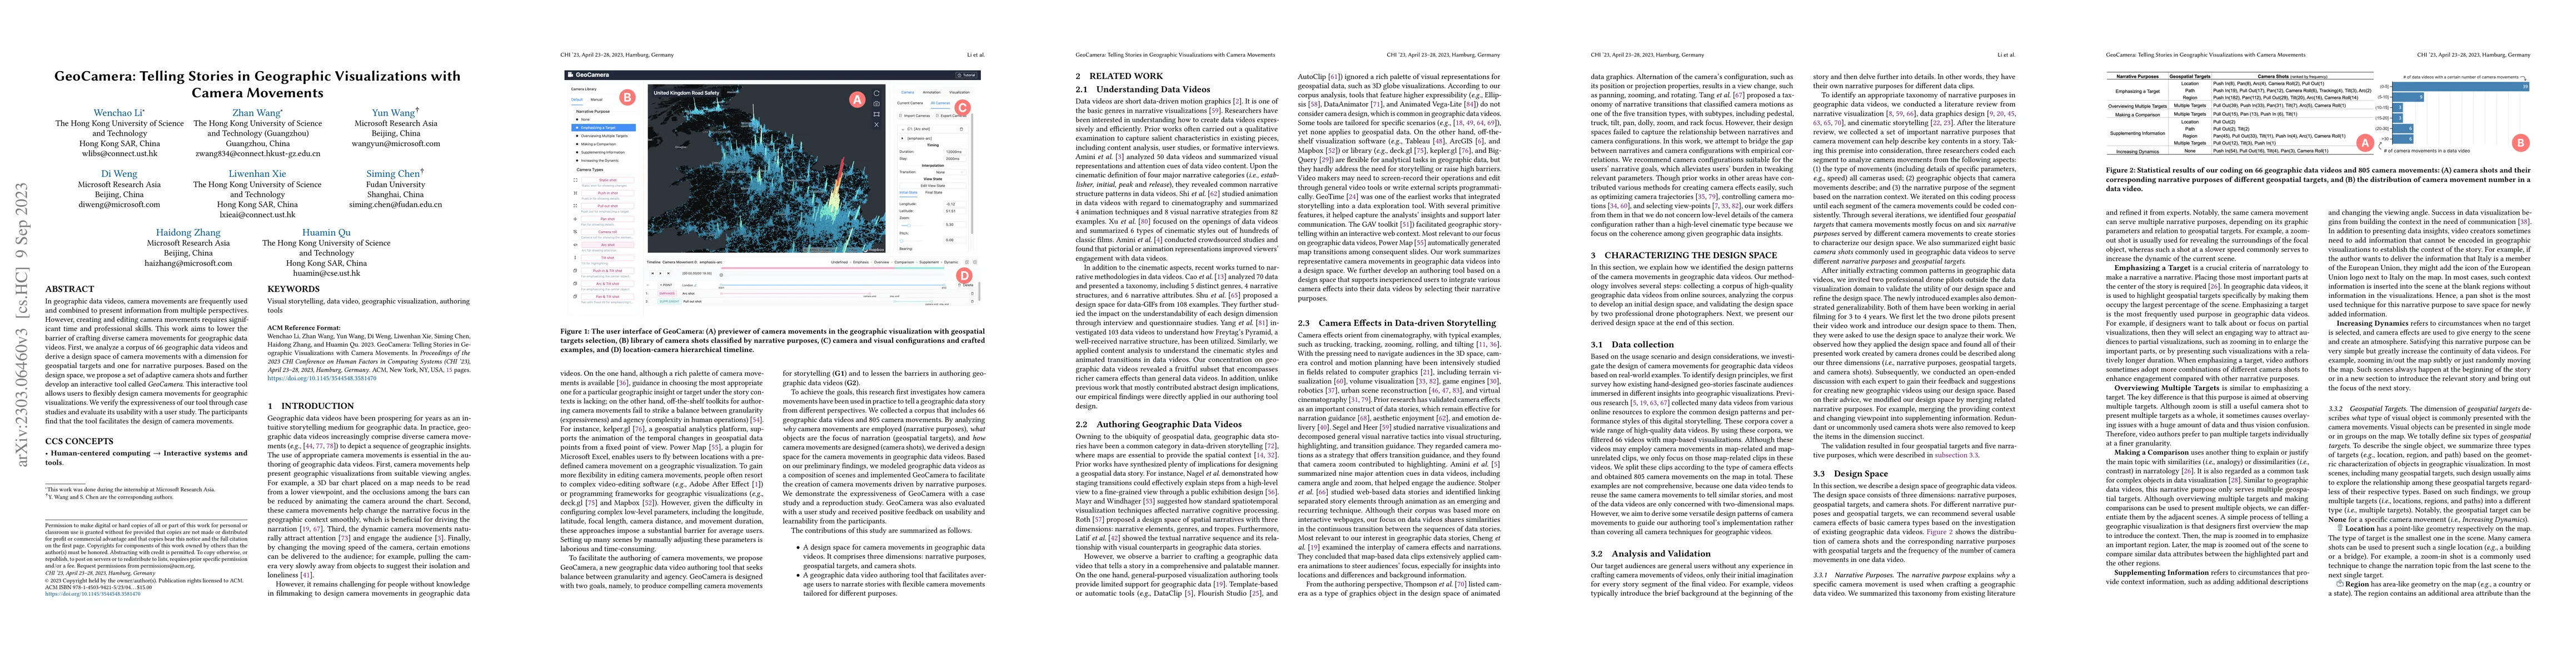
In geographic data videos, camera movements are frequently used and combined to present information from multiple perspectives. However, creating and editing camera movements requires significant ti...
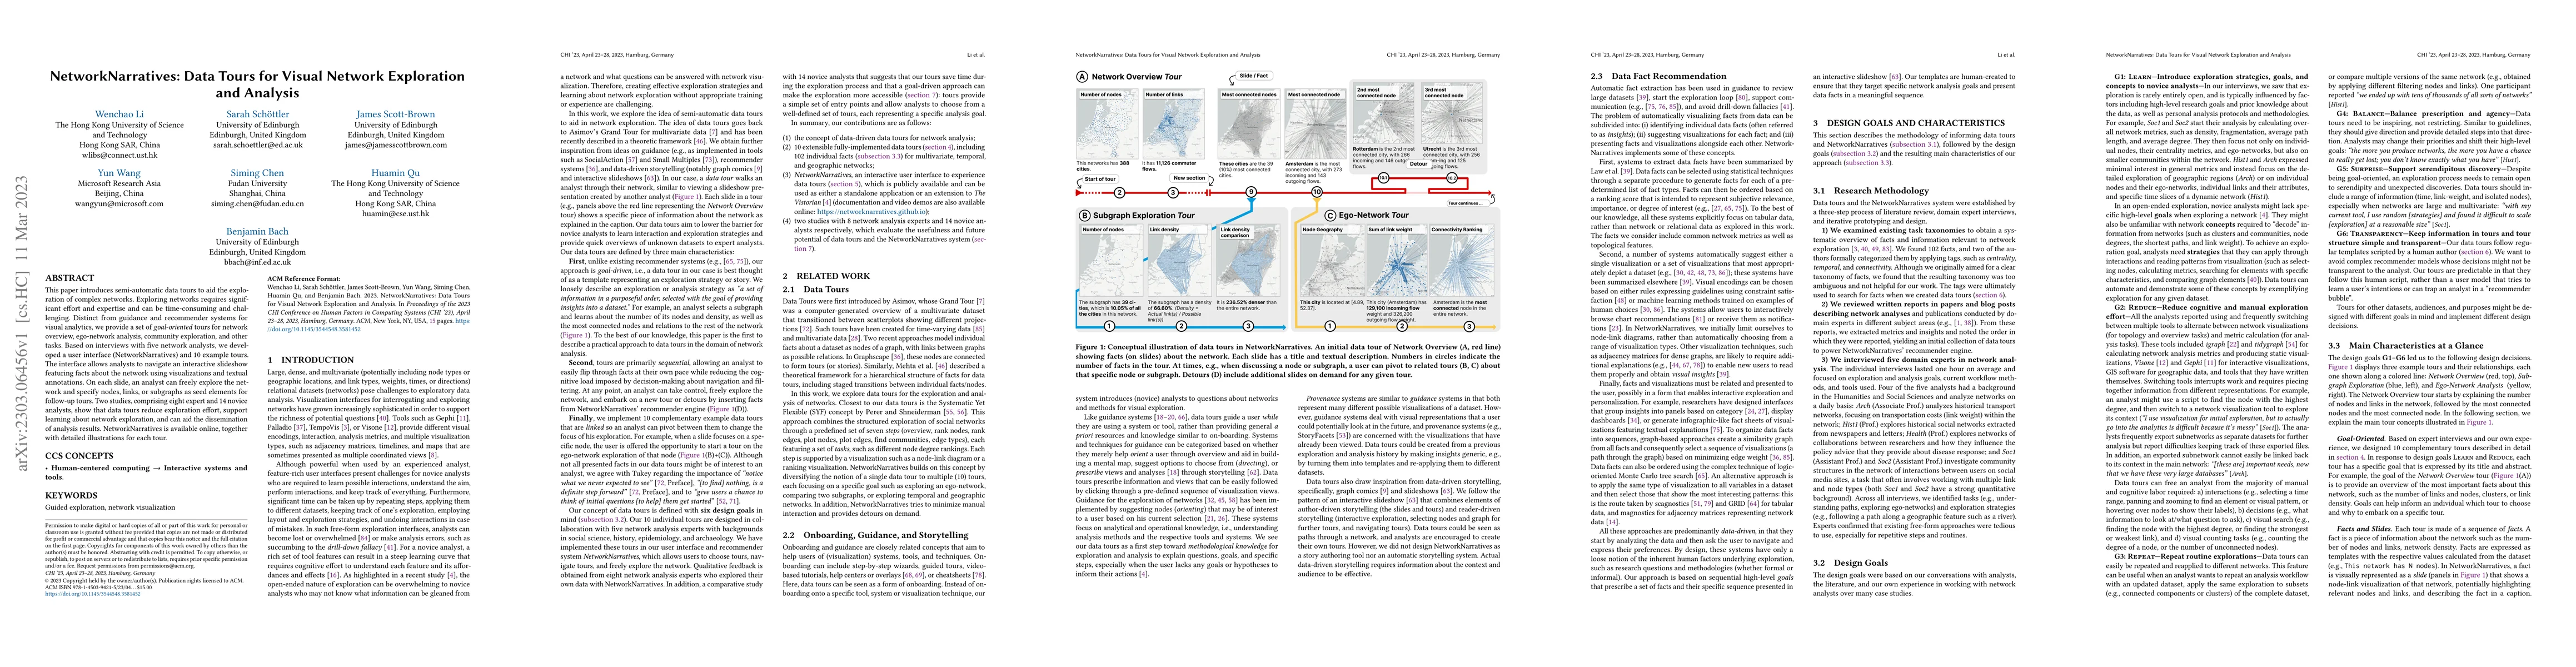
This paper introduces semi-automatic data tours to aid the exploration of complex networks. Exploring networks requires significant effort and expertise and can be time-consuming and challenging. Di...
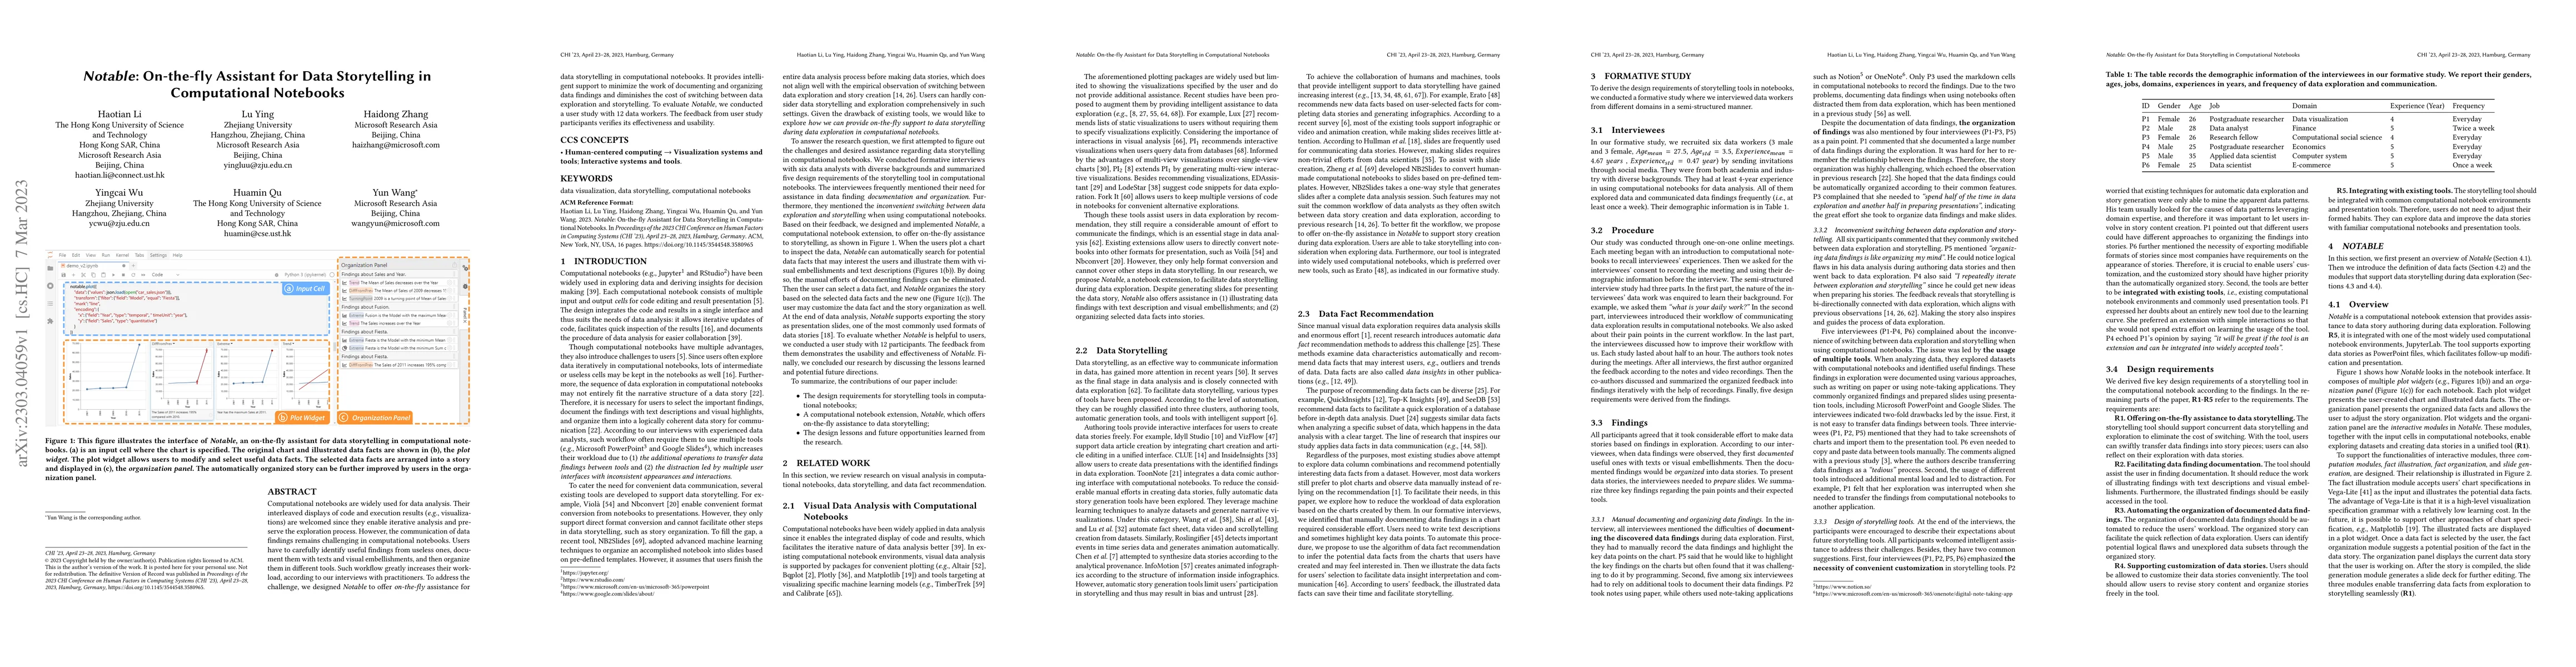
Computational notebooks are widely used for data analysis. Their interleaved displays of code and execution results (e.g., visualizations) are welcomed since they enable iterative analysis and prese...
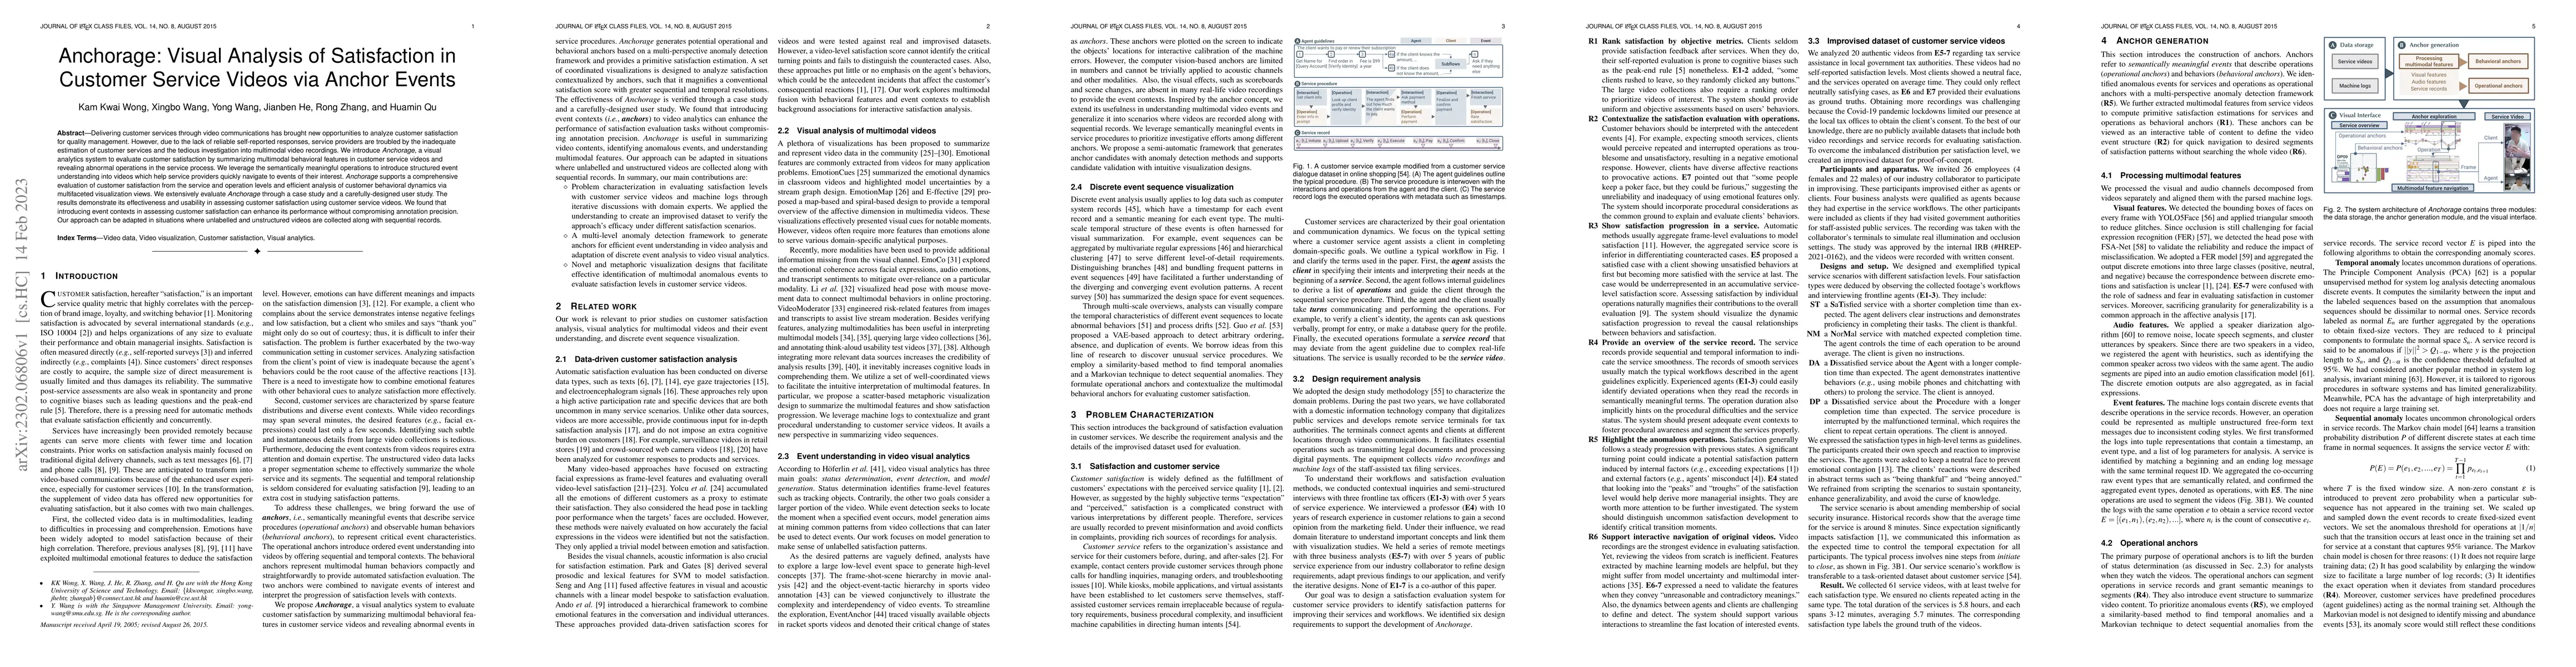
Delivering customer services through video communications has brought new opportunities to analyze customer satisfaction for quality management. However, due to the lack of reliable self-reported re...
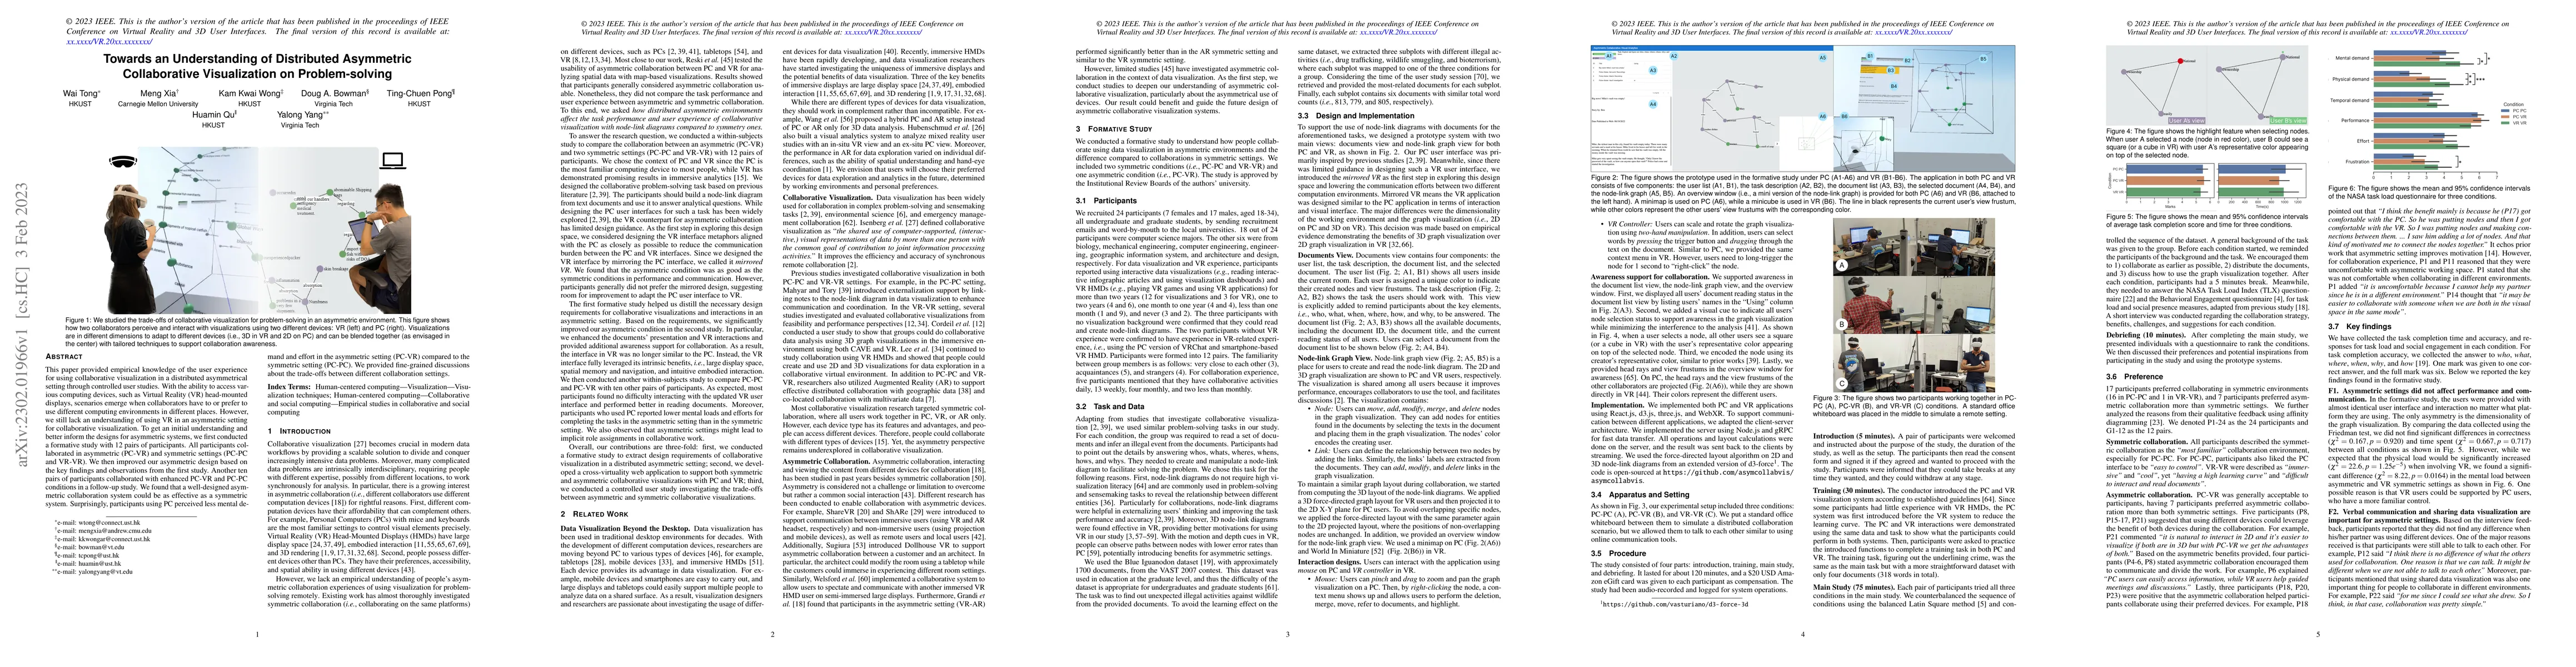
This paper provided empirical knowledge of the user experience for using collaborative visualization in a distributed asymmetrical setting through controlled user studies. With the ability to access...
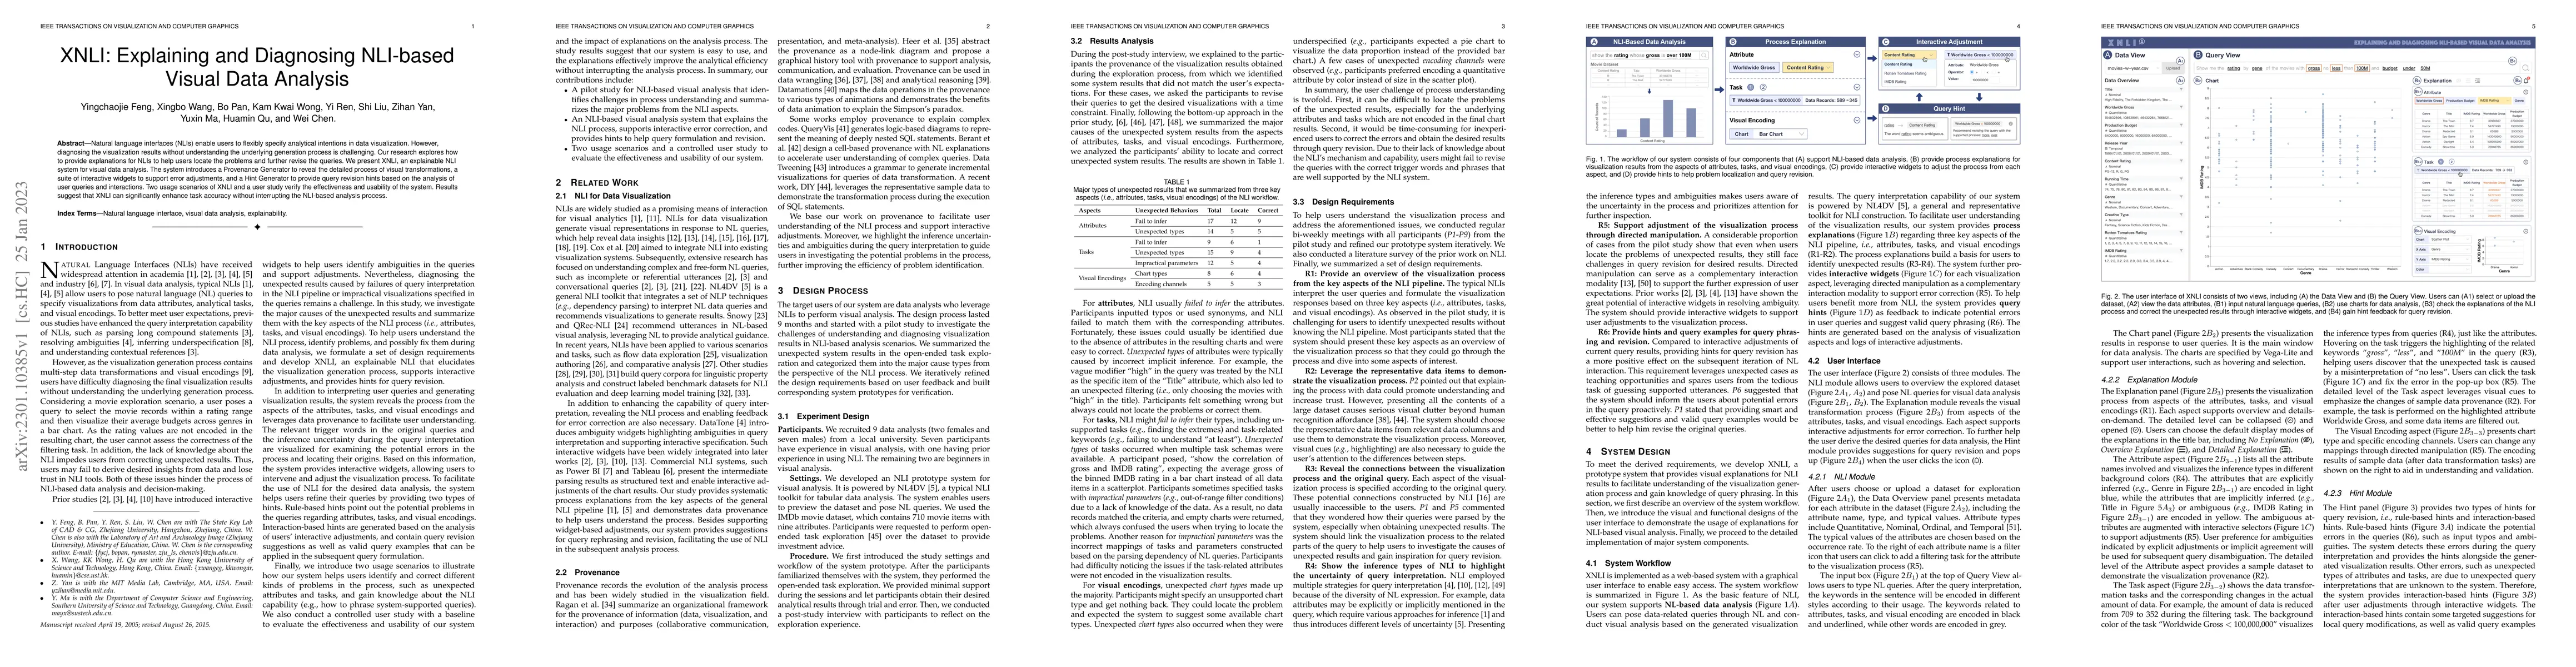
Natural language interfaces (NLIs) enable users to flexibly specify analytical intentions in data visualization. However, diagnosing the visualization results without understanding the underlying ge...
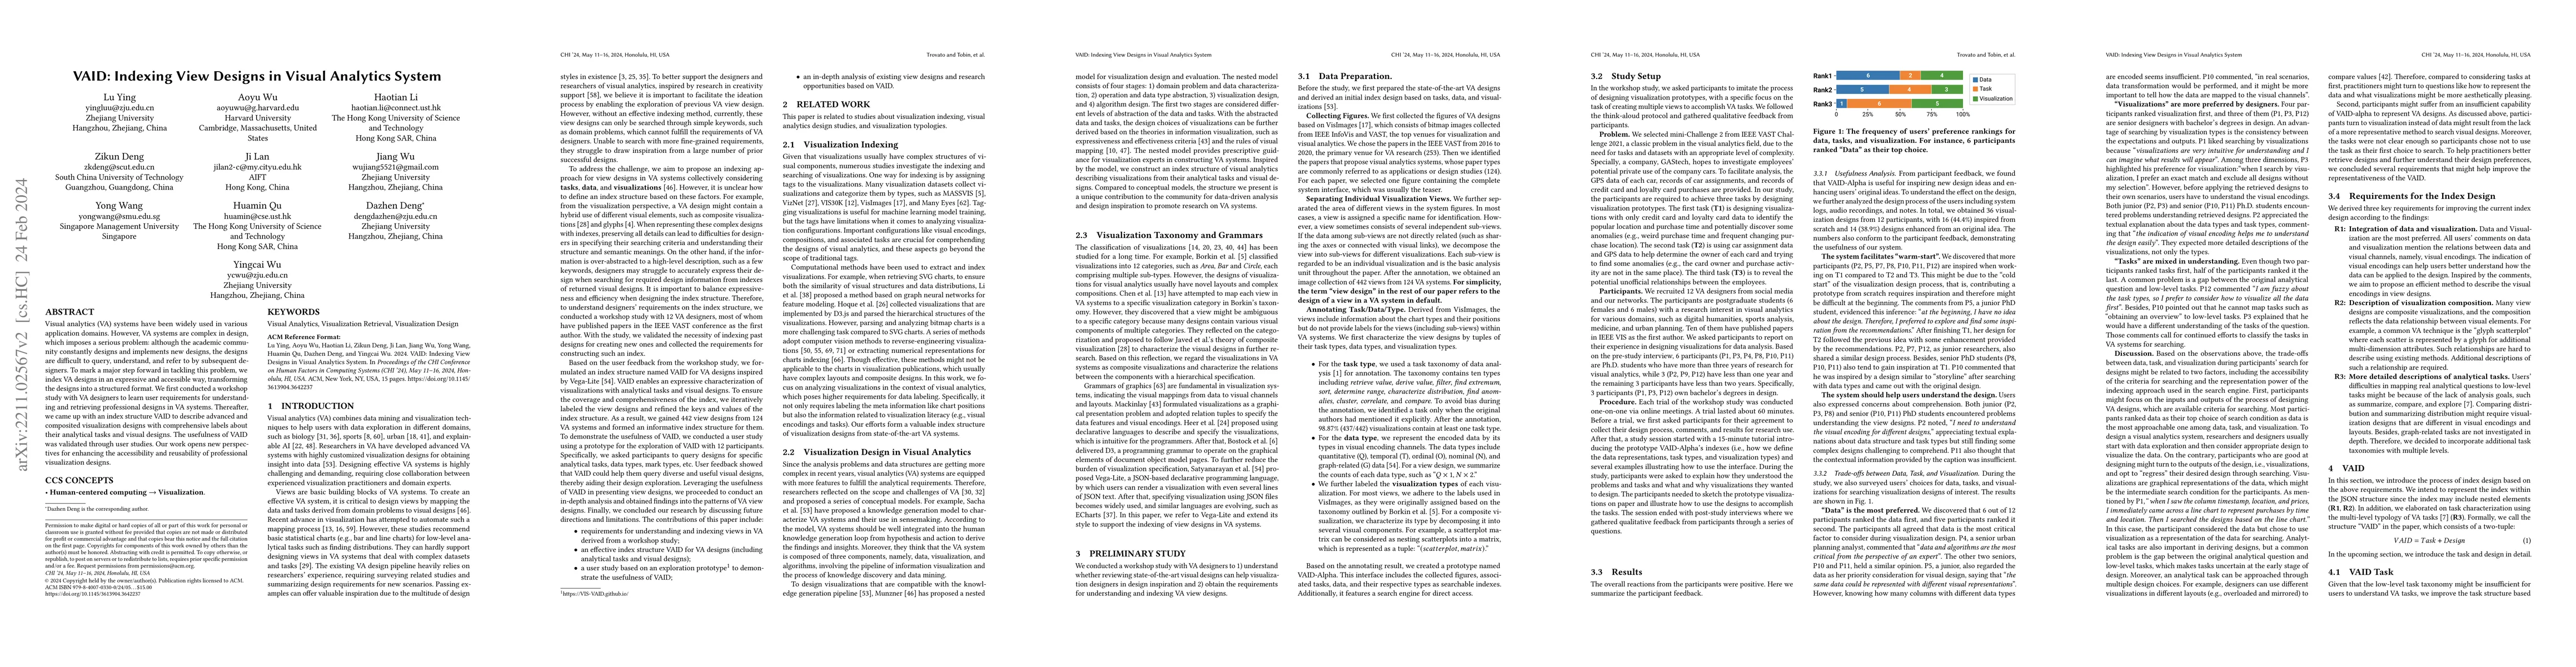
Visual analytics (VA) systems have been widely used in various application domains. However, VA systems are complex in design, which imposes a serious problem: although the academic community consta...
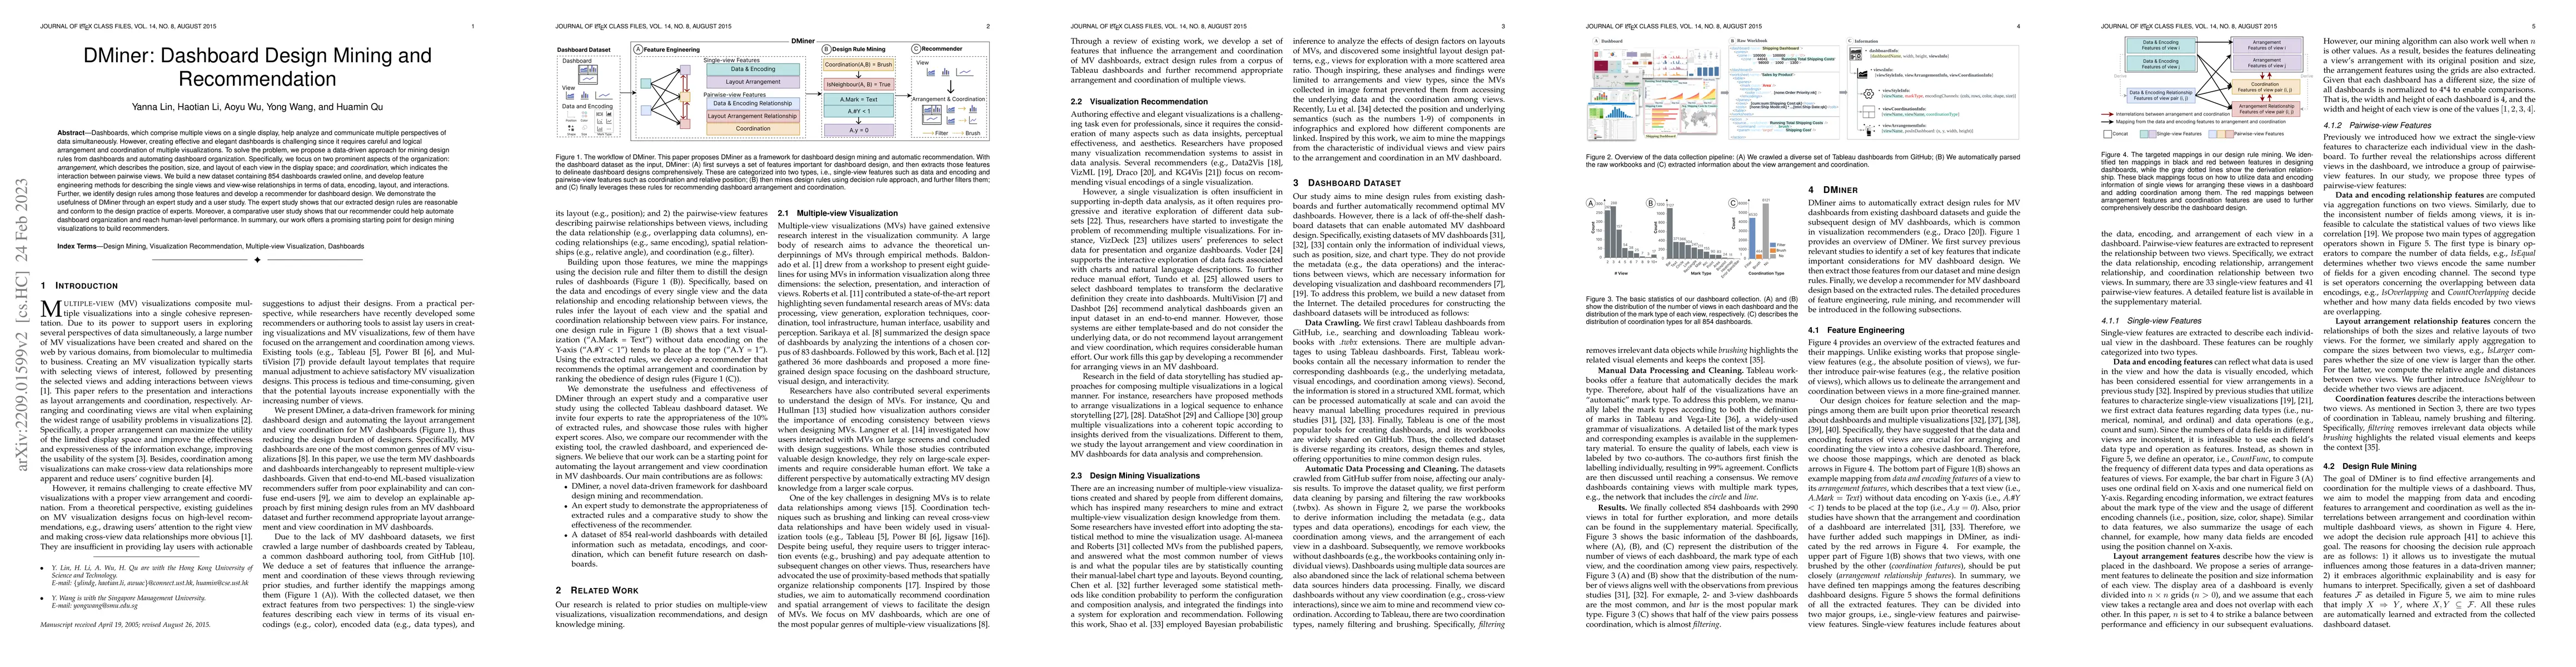
Dashboards, which comprise multiple views on a single display, help analyze and communicate multiple perspectives of data simultaneously. However, creating effective and elegant dashboards is challe...
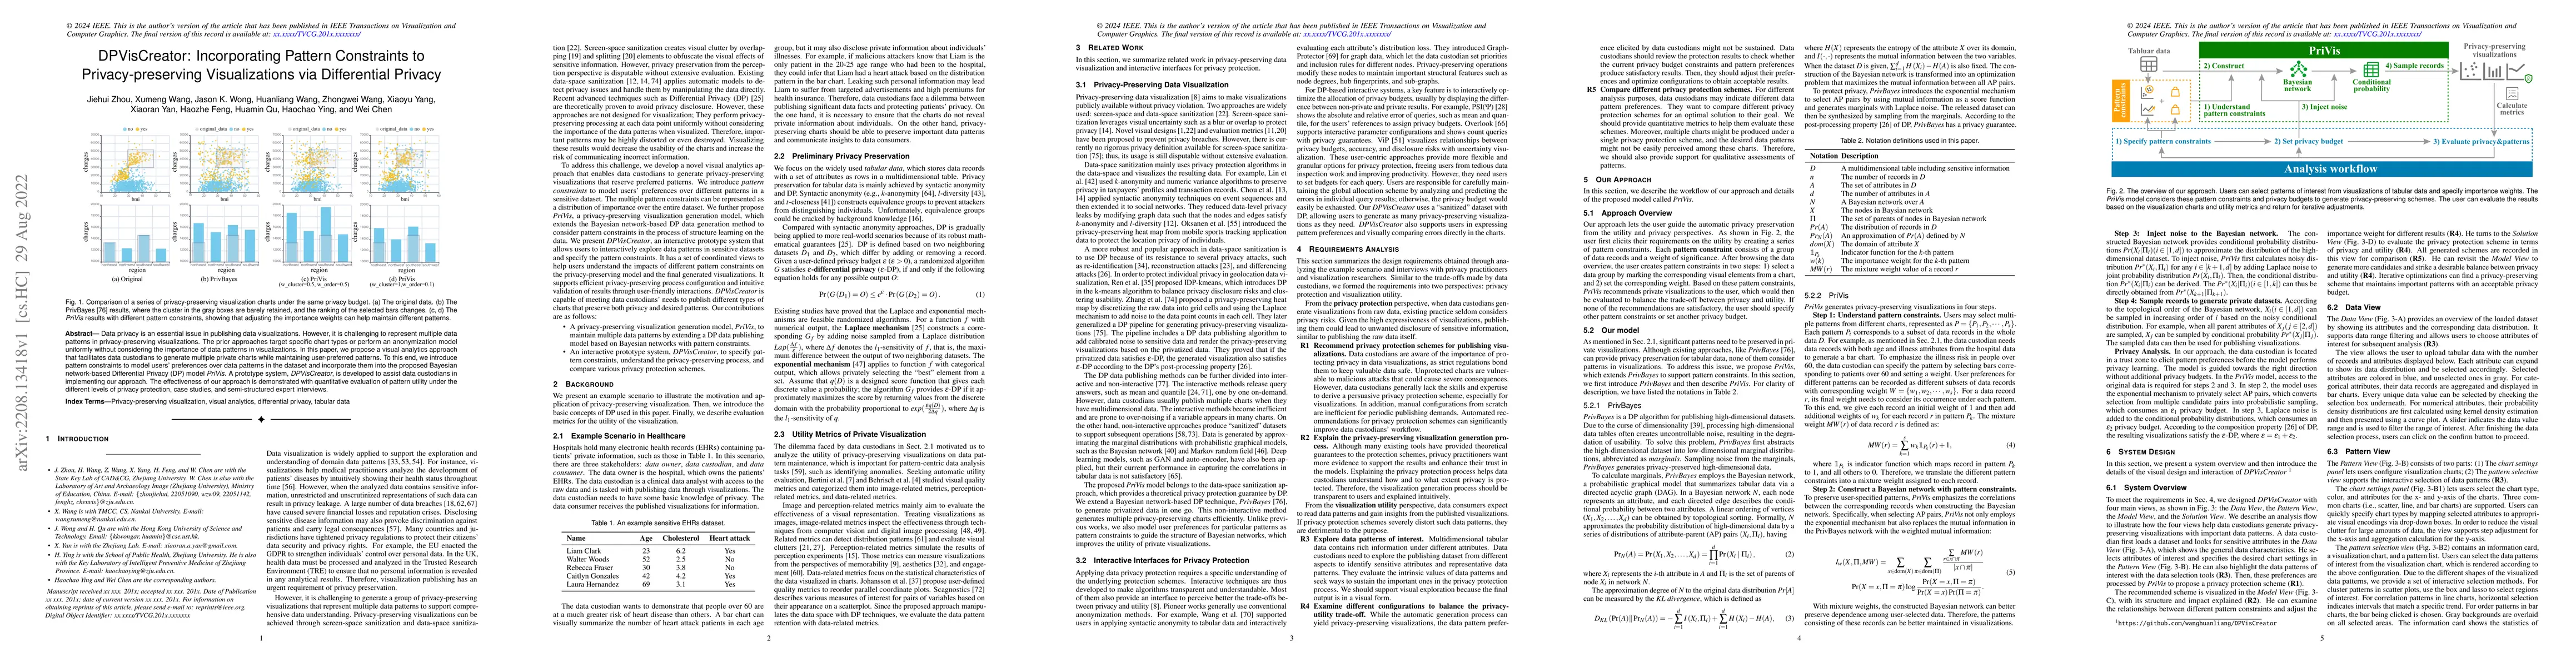
Data privacy is an essential issue in publishing data visualizations. However, it is challenging to represent multiple data patterns in privacy-preserving visualizations. The prior approaches target...
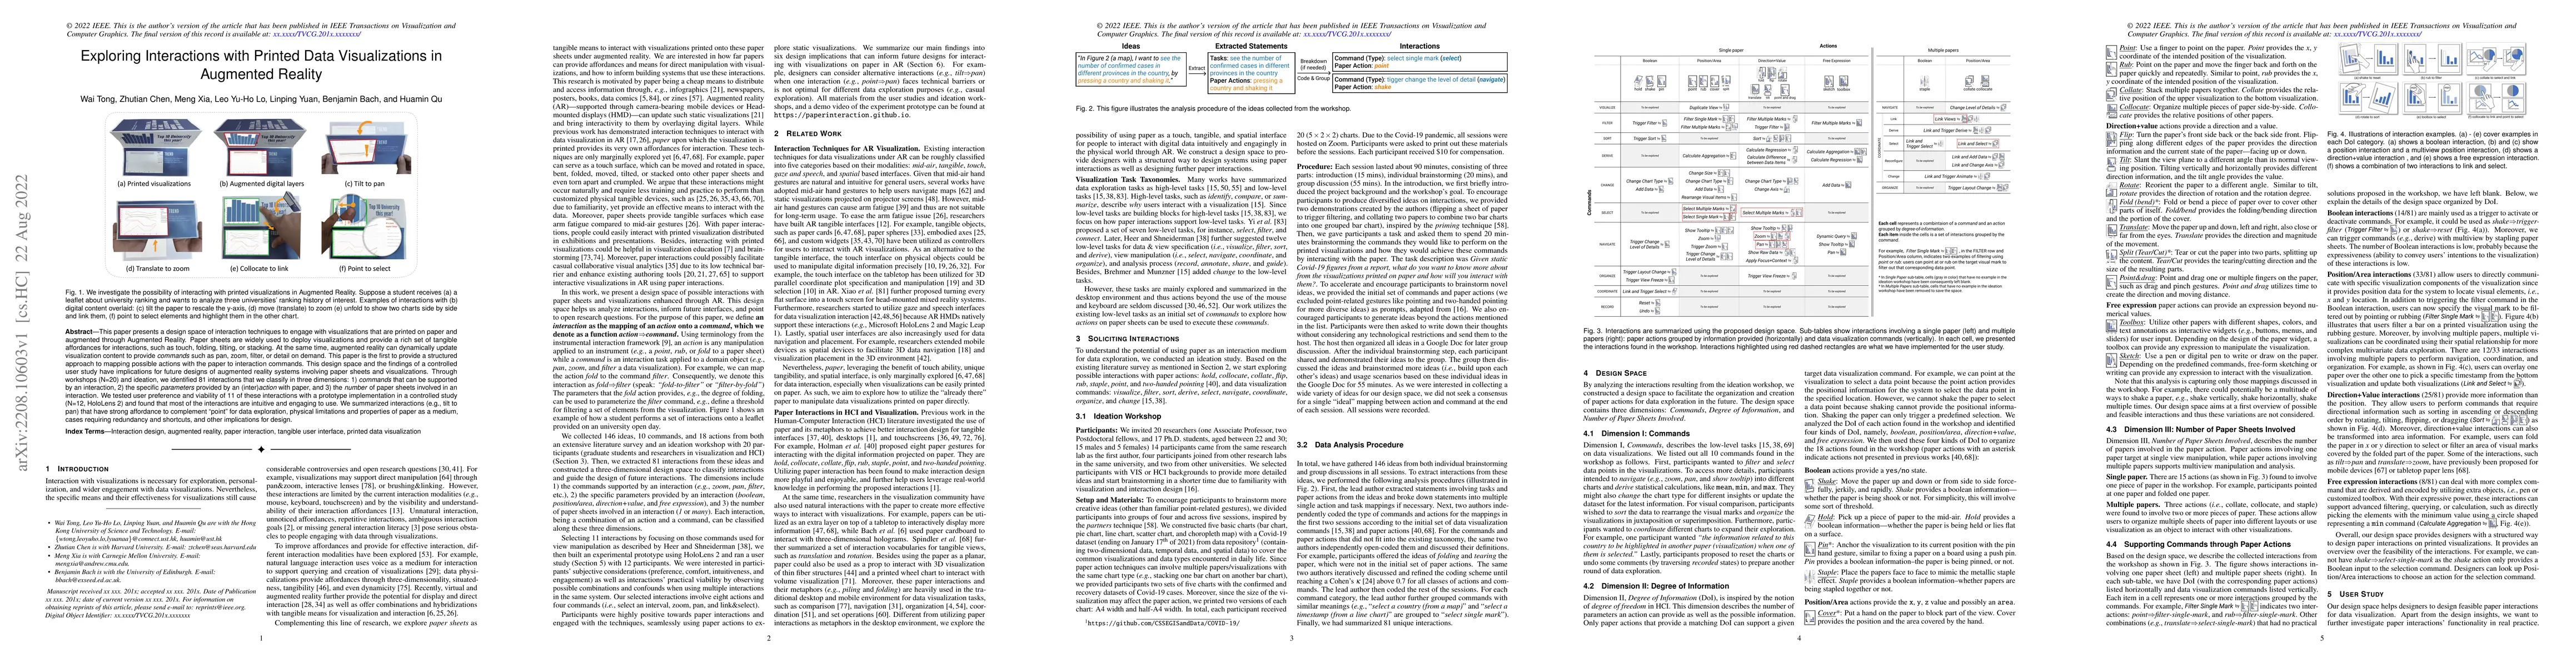
This paper presents a design space of interaction techniques to engage with visualizations that are printed on paper and augmented through Augmented Reality. Paper sheets are widely used to deploy v...
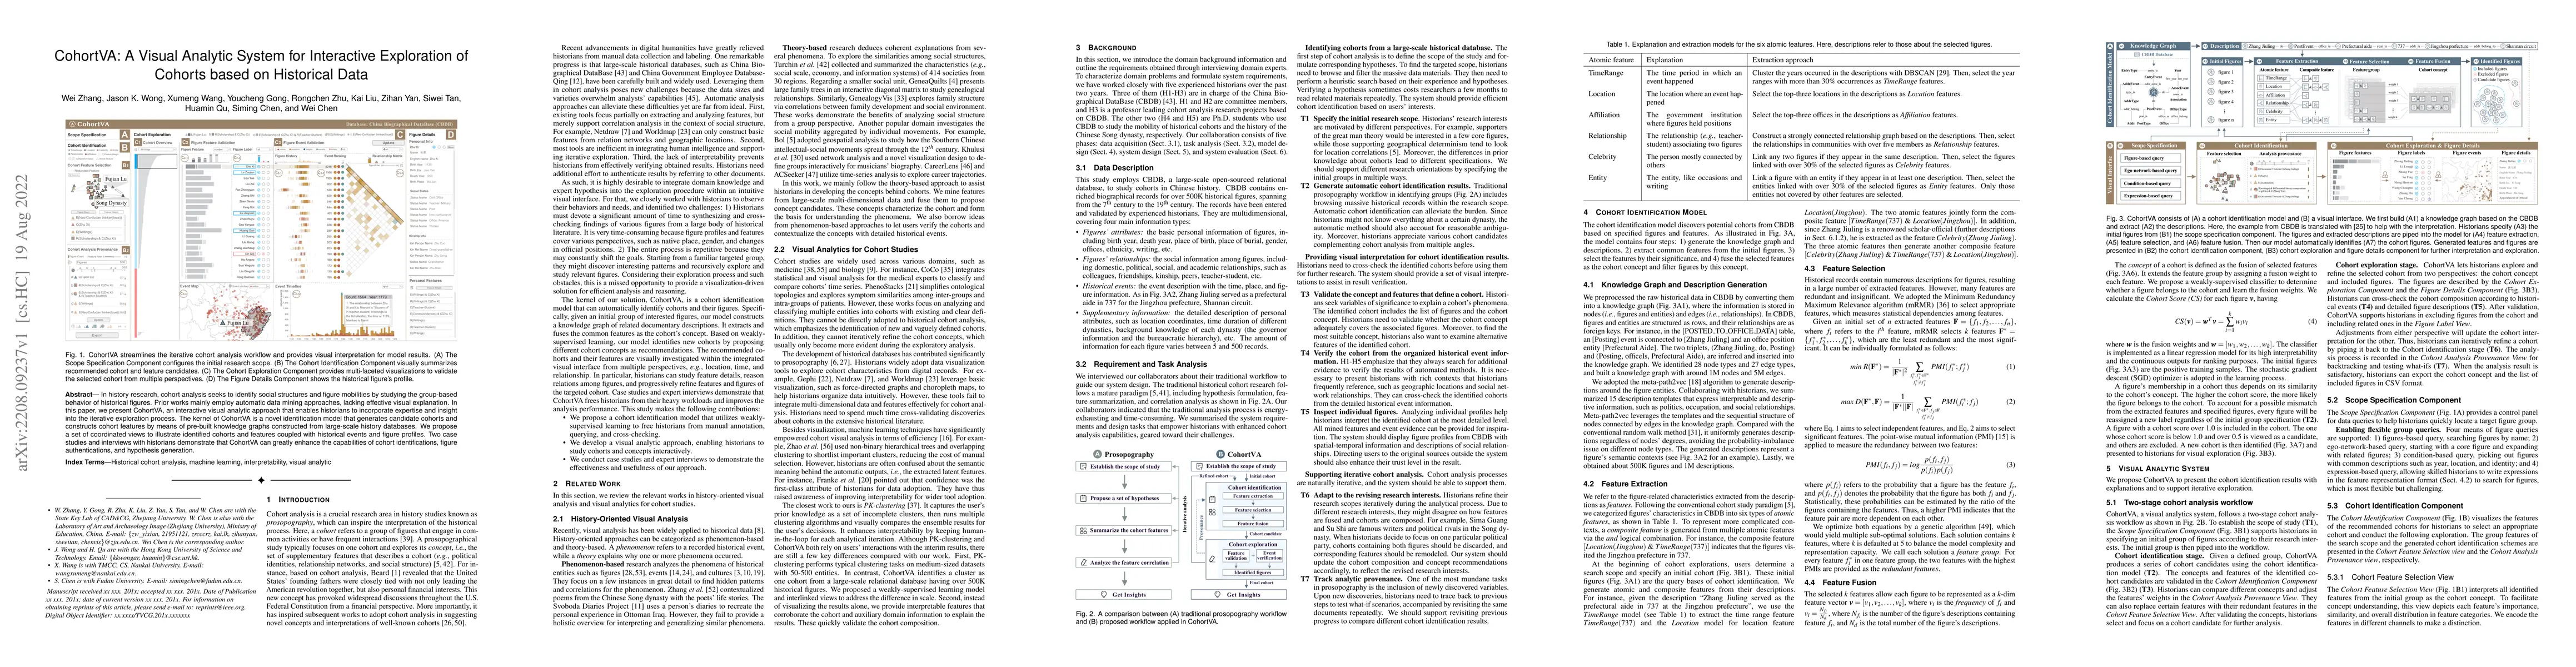
In history research, cohort analysis seeks to identify social structures and figure mobilities by studying the group-based behavior of historical figures. Prior works mainly employ automatic data mi...
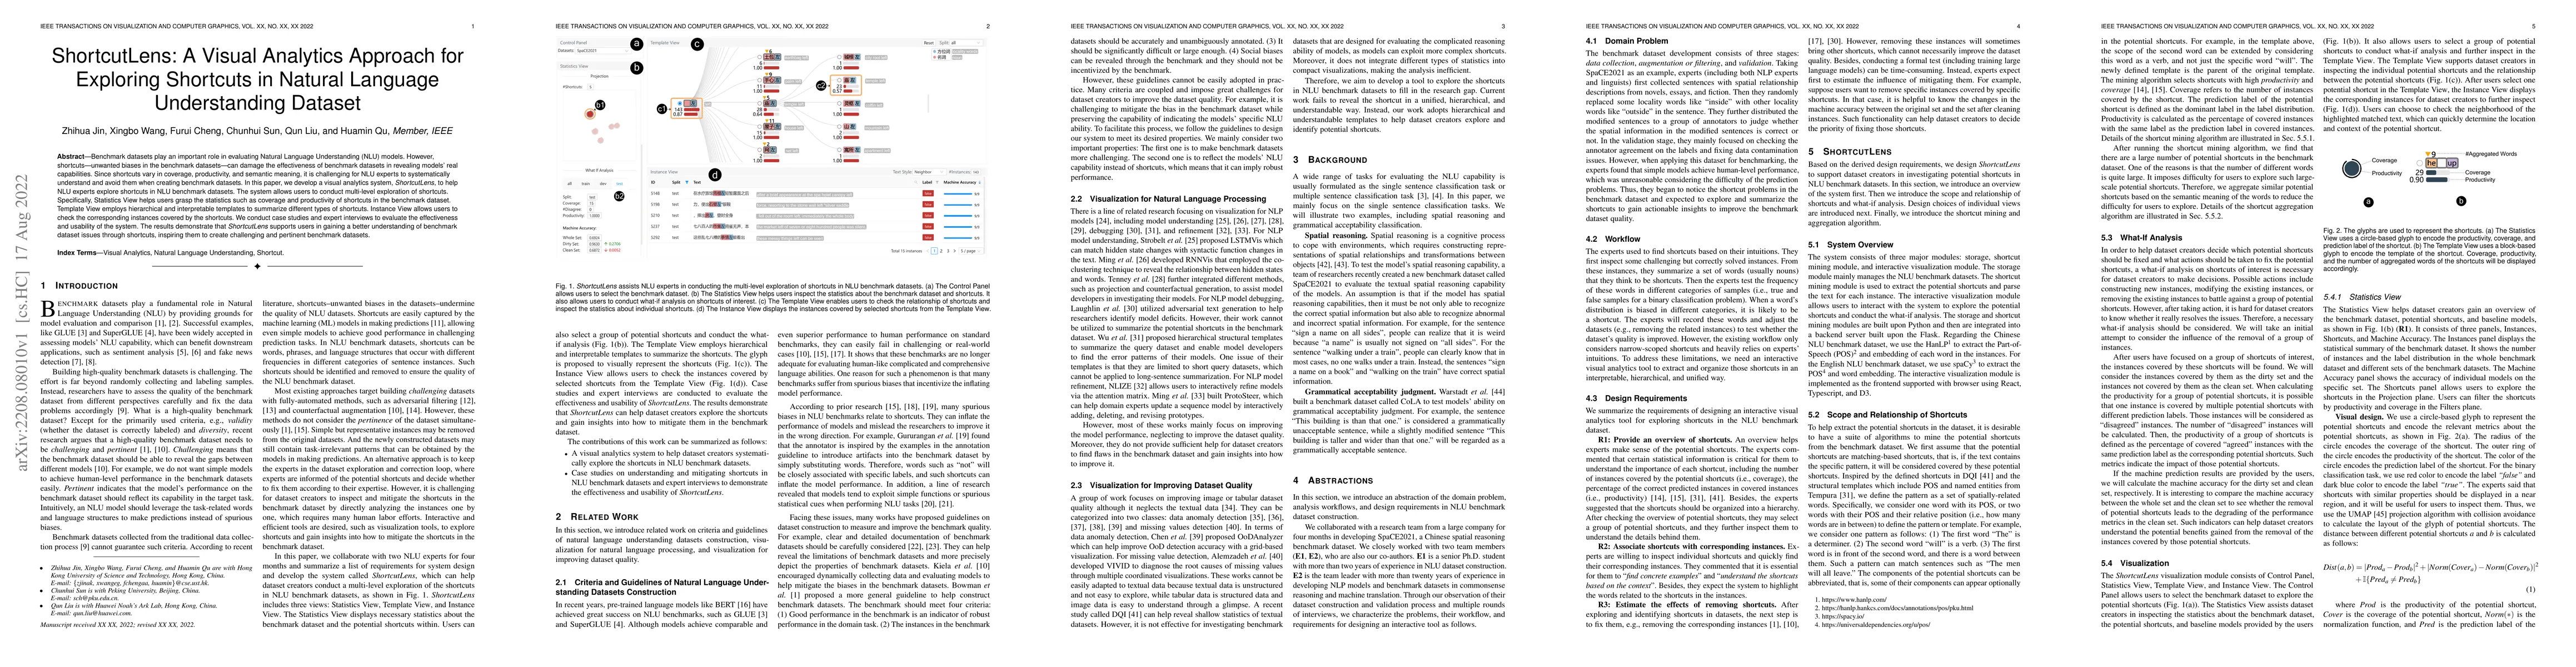
Benchmark datasets play an important role in evaluating Natural Language Understanding (NLU) models. However, shortcuts -- unwanted biases in the benchmark datasets -- can damage the effectiveness o...
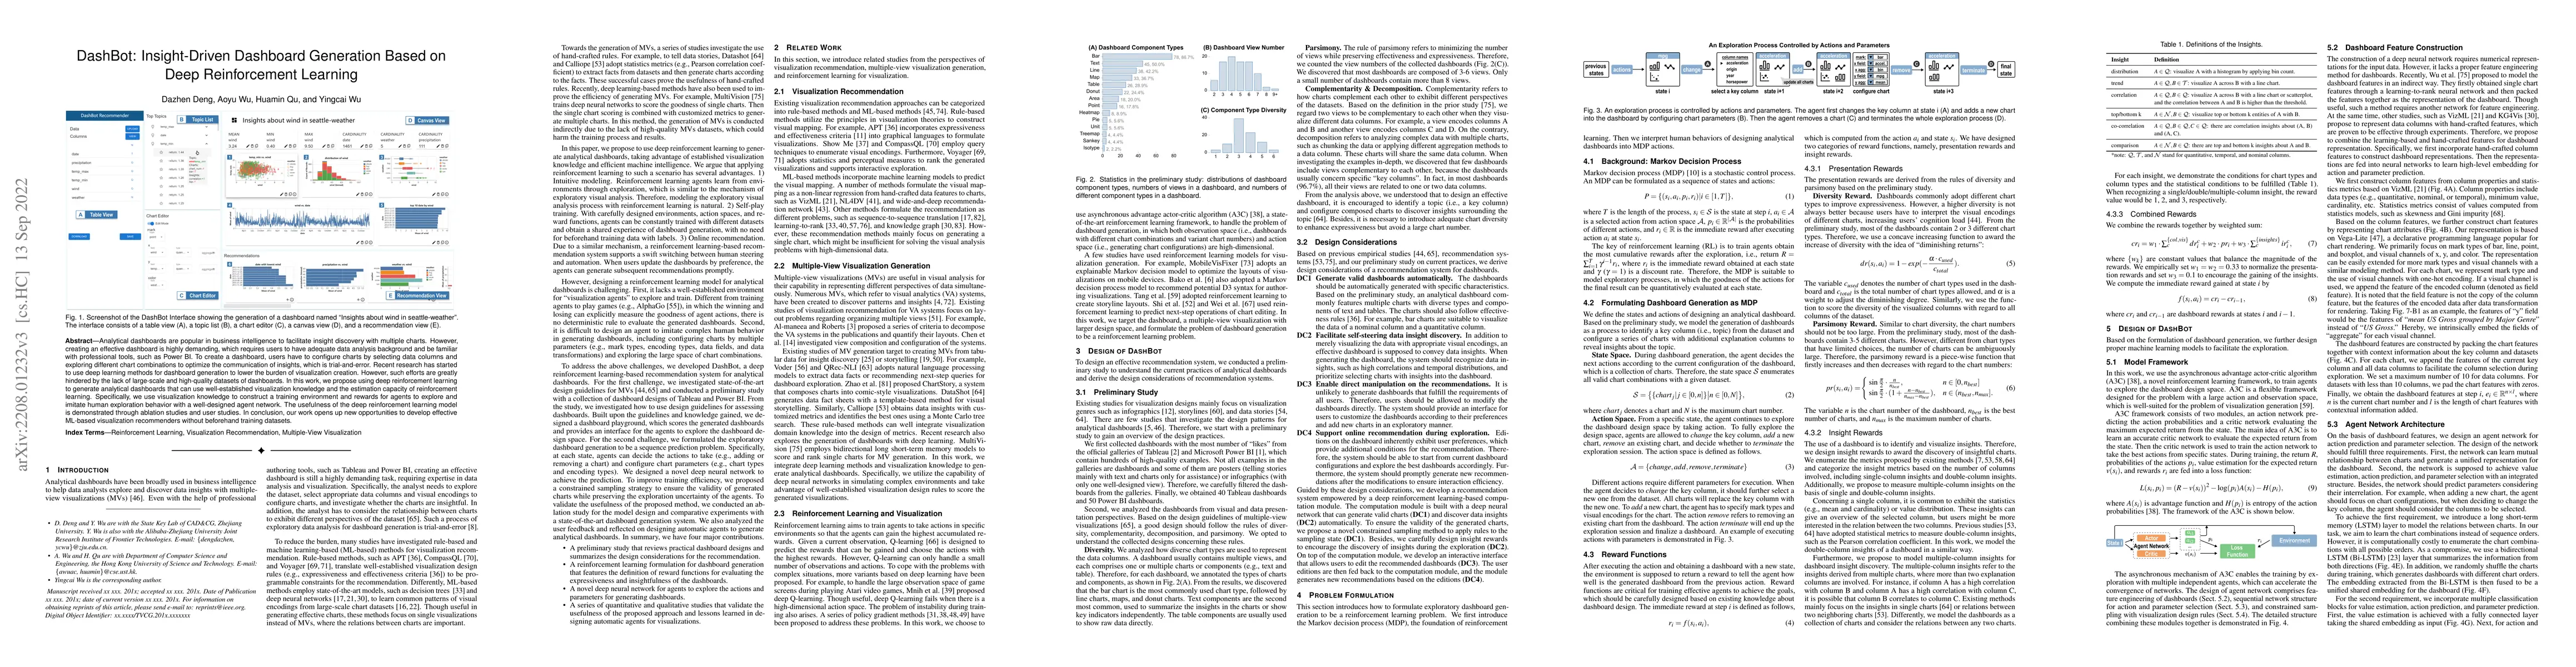
Analytical dashboards are popular in business intelligence to facilitate insight discovery with multiple charts. However, creating an effective dashboard is highly demanding, which requires users to...
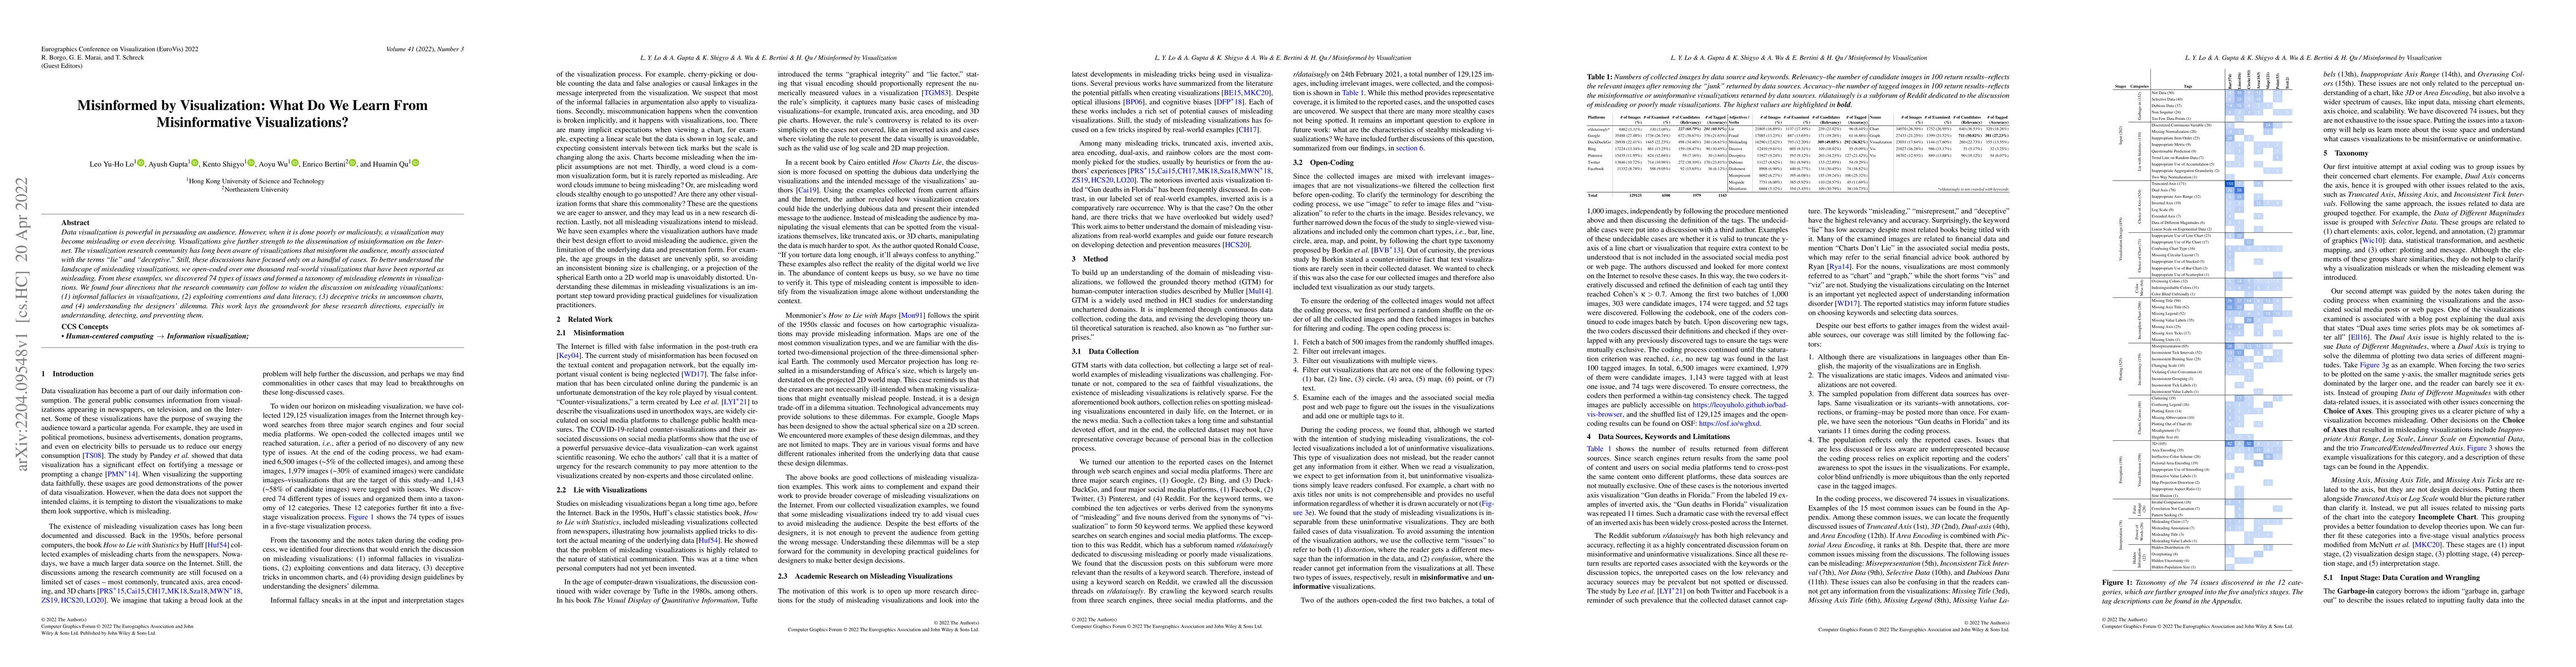
Data visualization is powerful in persuading an audience. However, when it is done poorly or maliciously, a visualization may become misleading or even deceiving. Visualizations give further strengt...
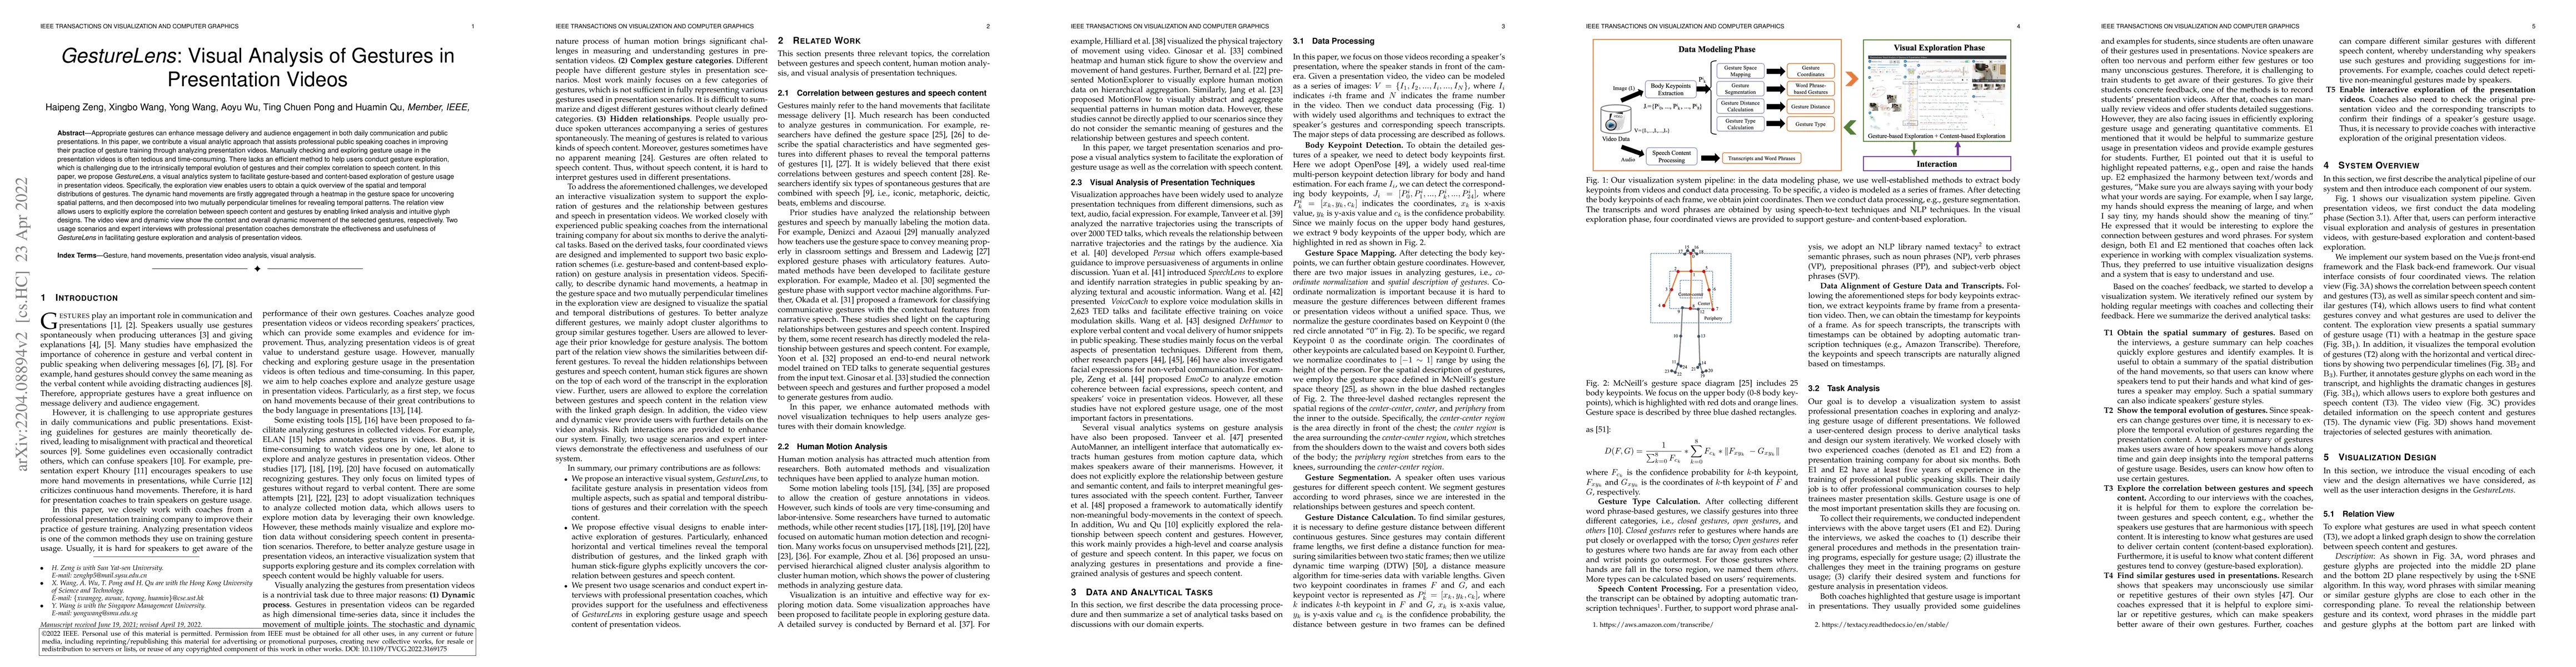
Appropriate gestures can enhance message delivery and audience engagement in both daily communication and public presentations. In this paper, we contribute a visual analytic approach that assists p...
Persuading people to change their opinions is a common practice in online discussion forums on topics ranging from political campaigns to relationship consultation. Enhancing people's ability to wri...
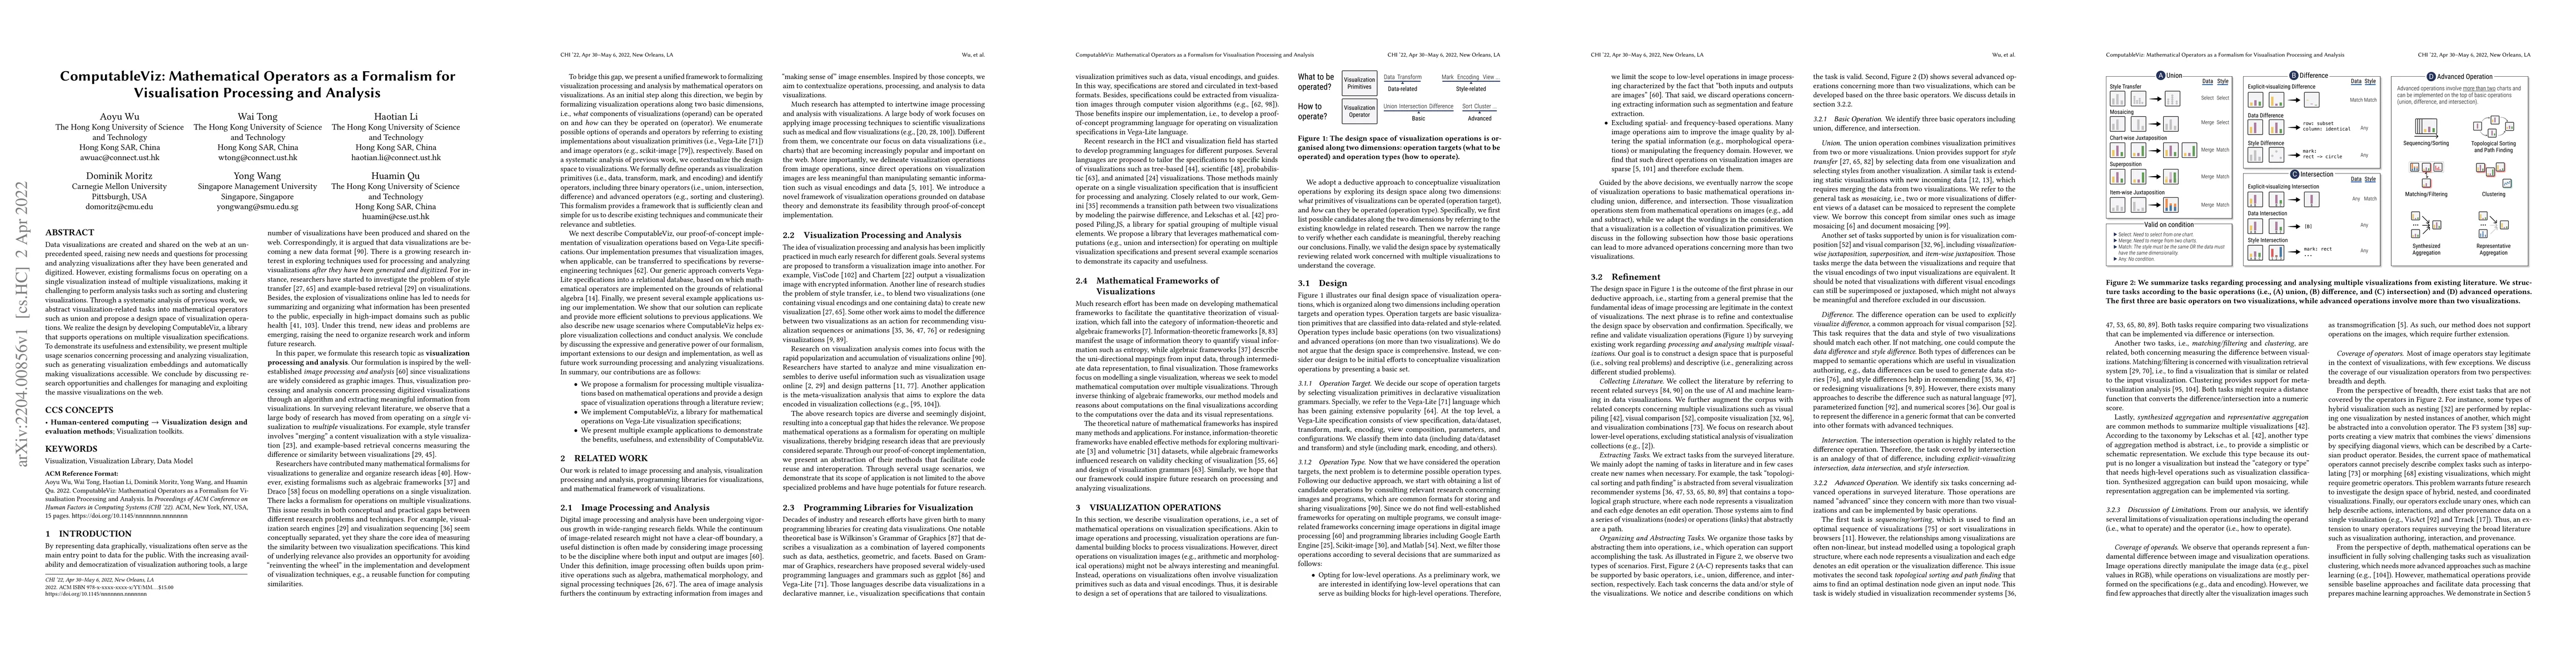
Data visualizations are created and shared on the web at an unprecedented speed, raising new needs and questions for processing and analyzing visualizations after they have been generated and digiti...
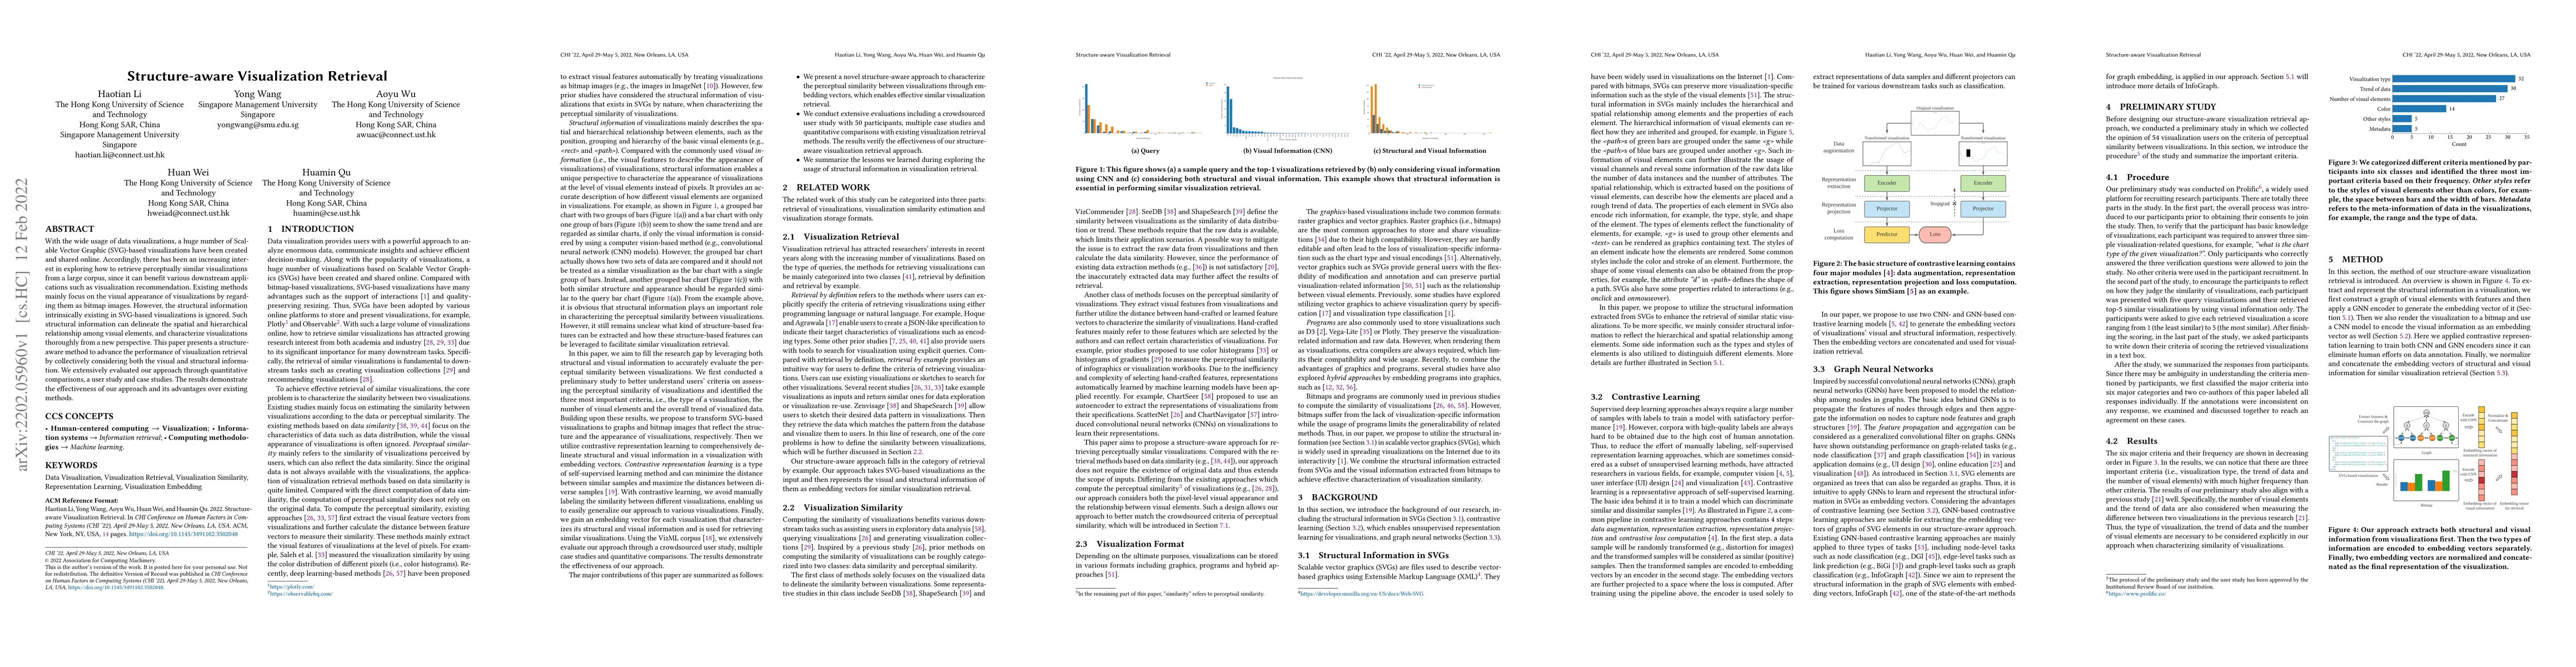
With the wide usage of data visualizations, a huge number of Scalable Vector Graphic (SVG)-based visualizations have been created and shared online. Accordingly, there has been an increasing interes...
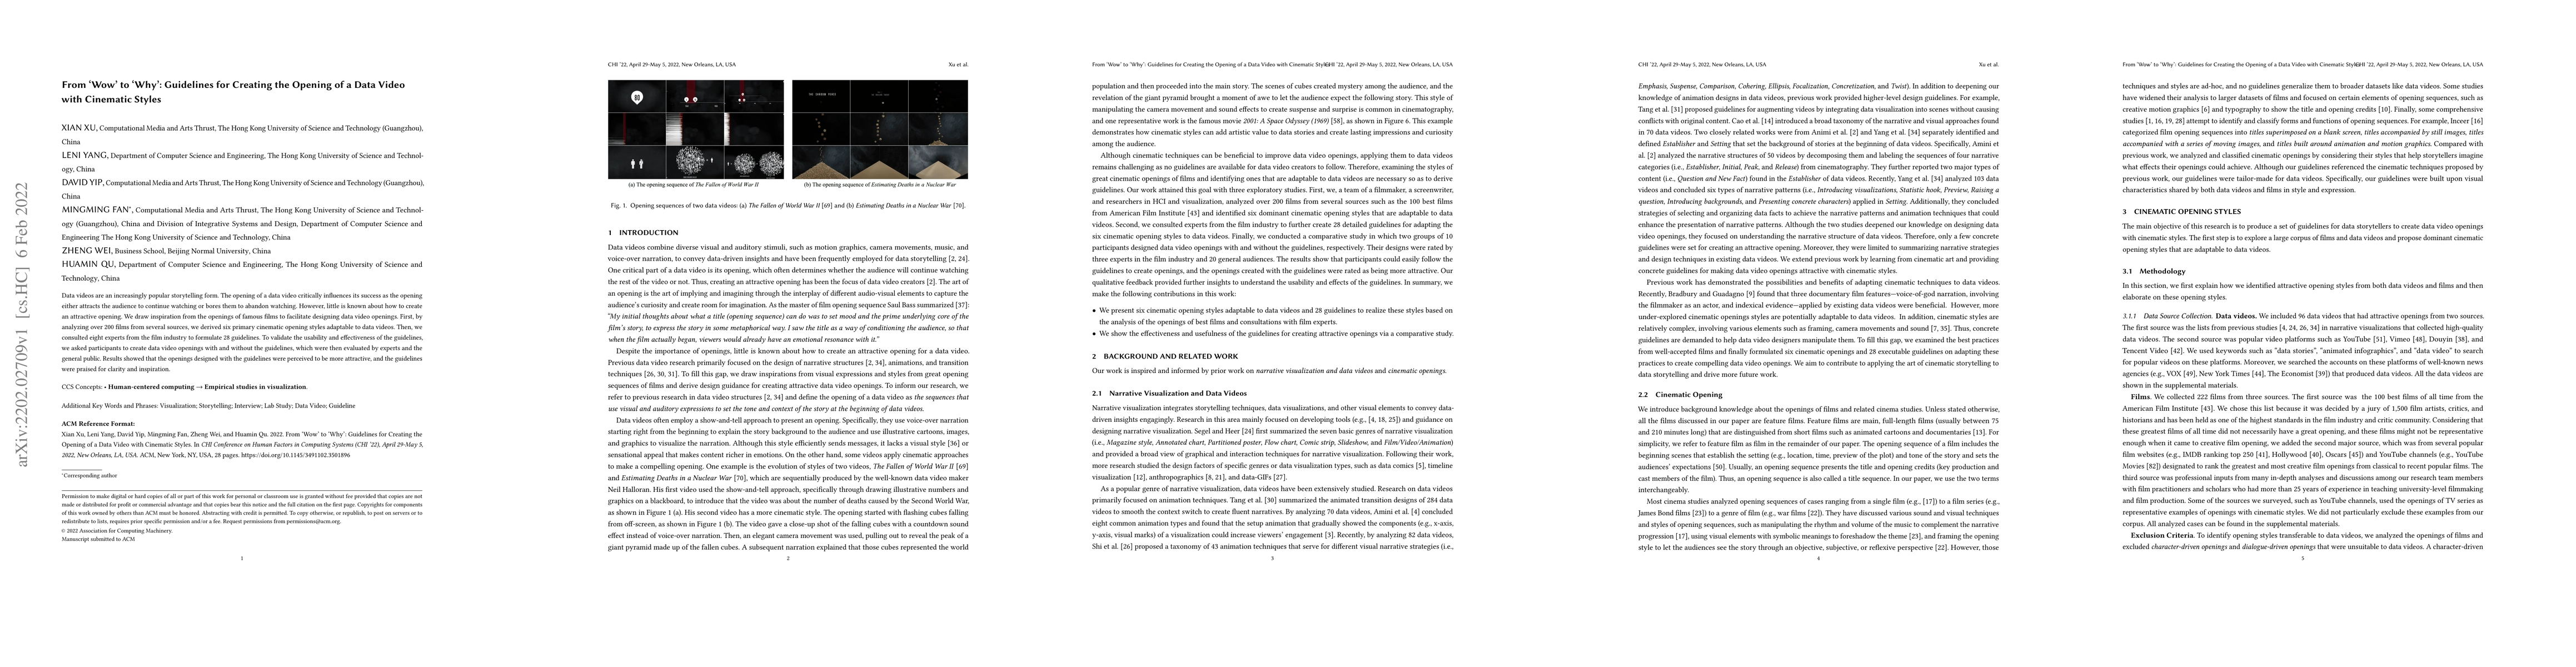
Data videos are an increasingly popular storytelling form. The opening of a data video critically influences its success as the opening either attracts the audience to continue watching or bores the...
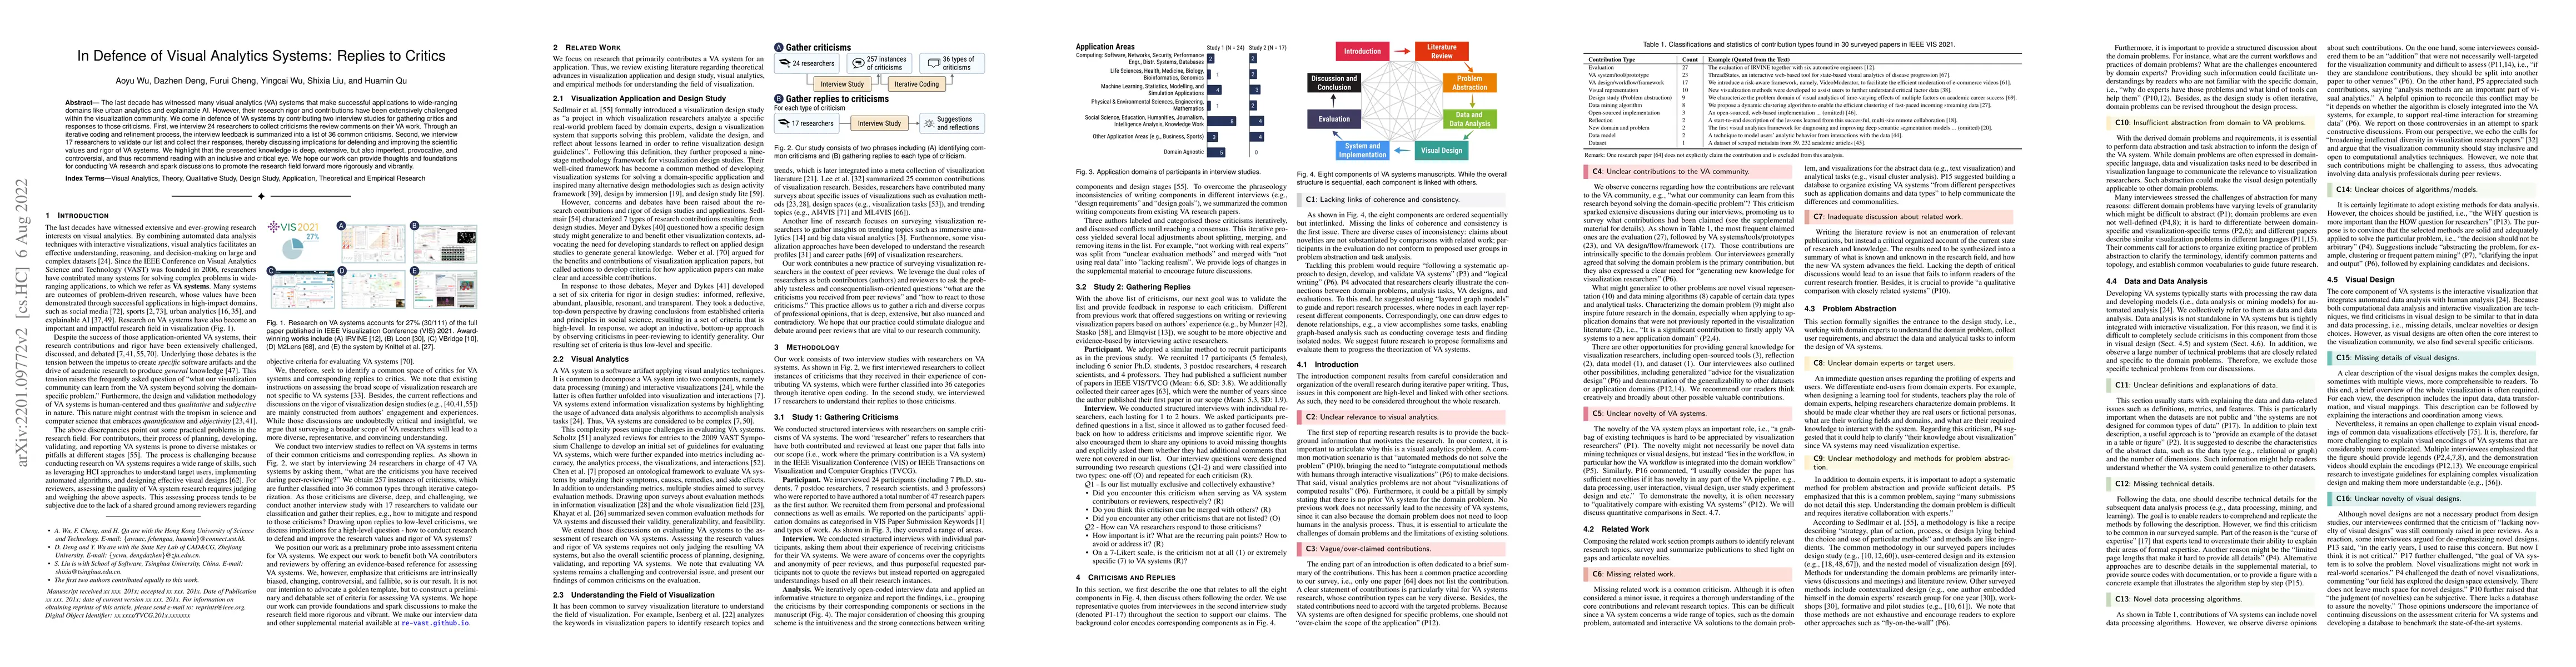
The last decade has witnessed many visual analytics (VA) systems that make successful applications to wide-ranging domains like urban analytics and explainable AI. However, their research rigor and ...

Natural language interfaces (NLIs) provide users with a convenient way to interactively analyze data through natural language queries. Nevertheless, interactive data analysis is a demanding process,...
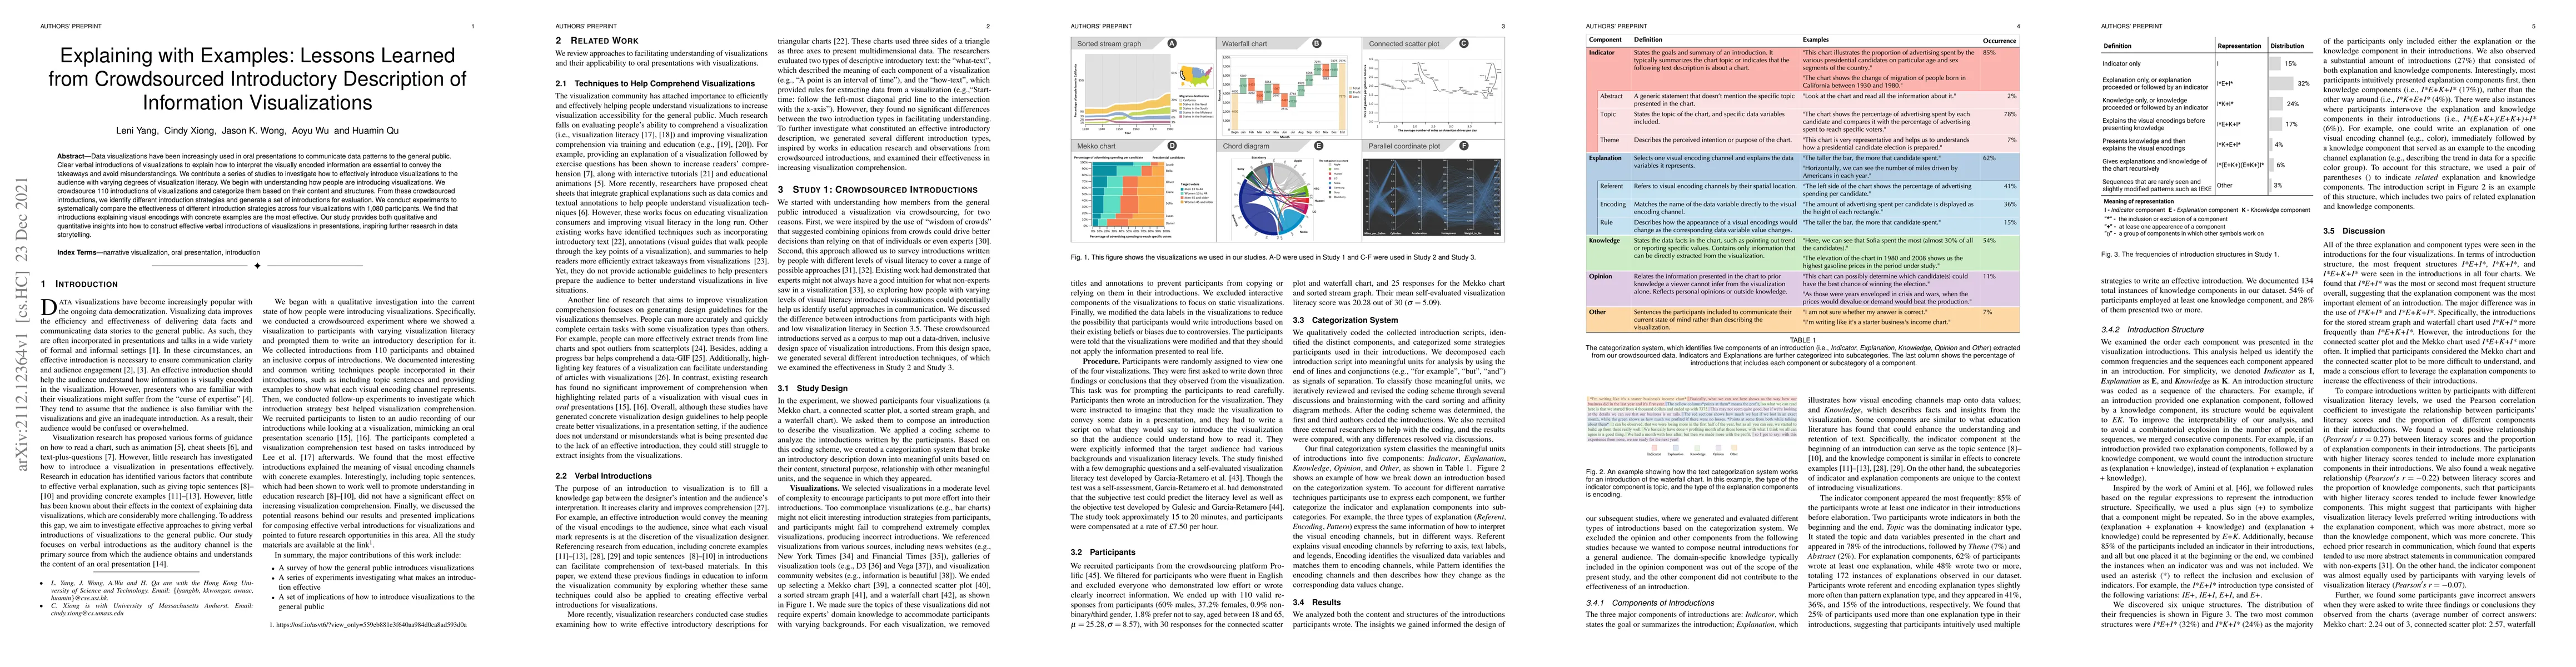
Data visualizations have been increasingly used in oral presentations to communicate data patterns to the general public. Clear verbal introductions of visualizations to explain how to interpret the...
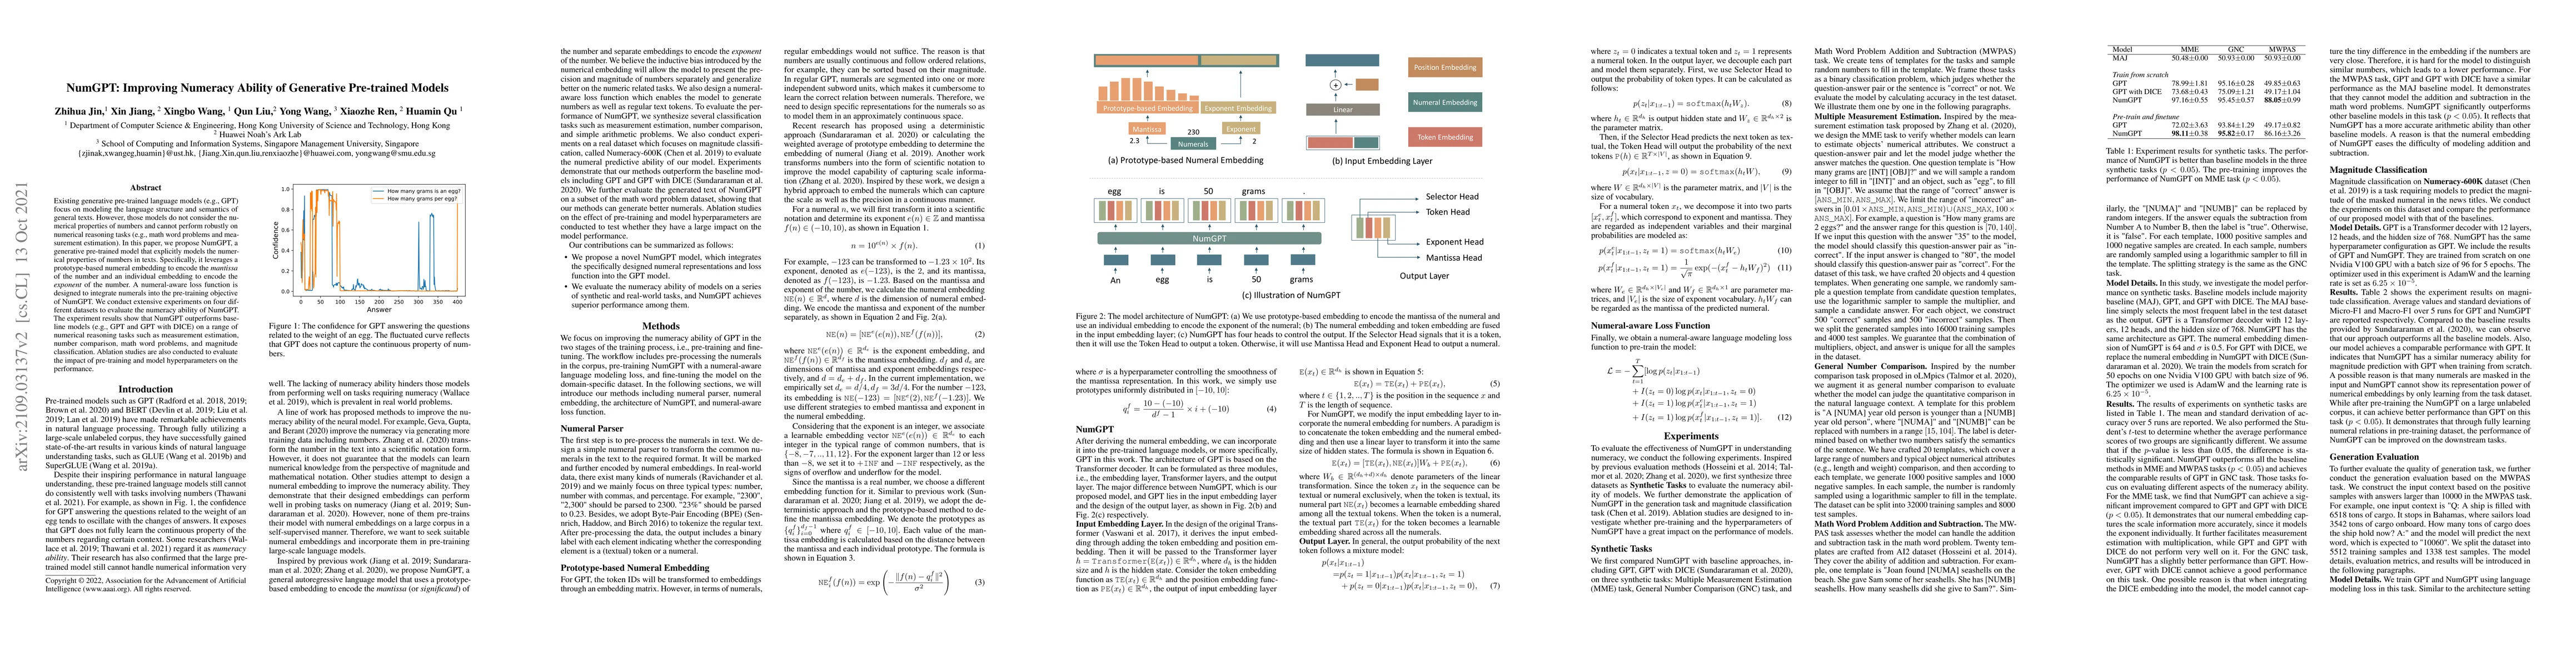
Existing generative pre-trained language models (e.g., GPT) focus on modeling the language structure and semantics of general texts. However, those models do not consider the numerical properties of...
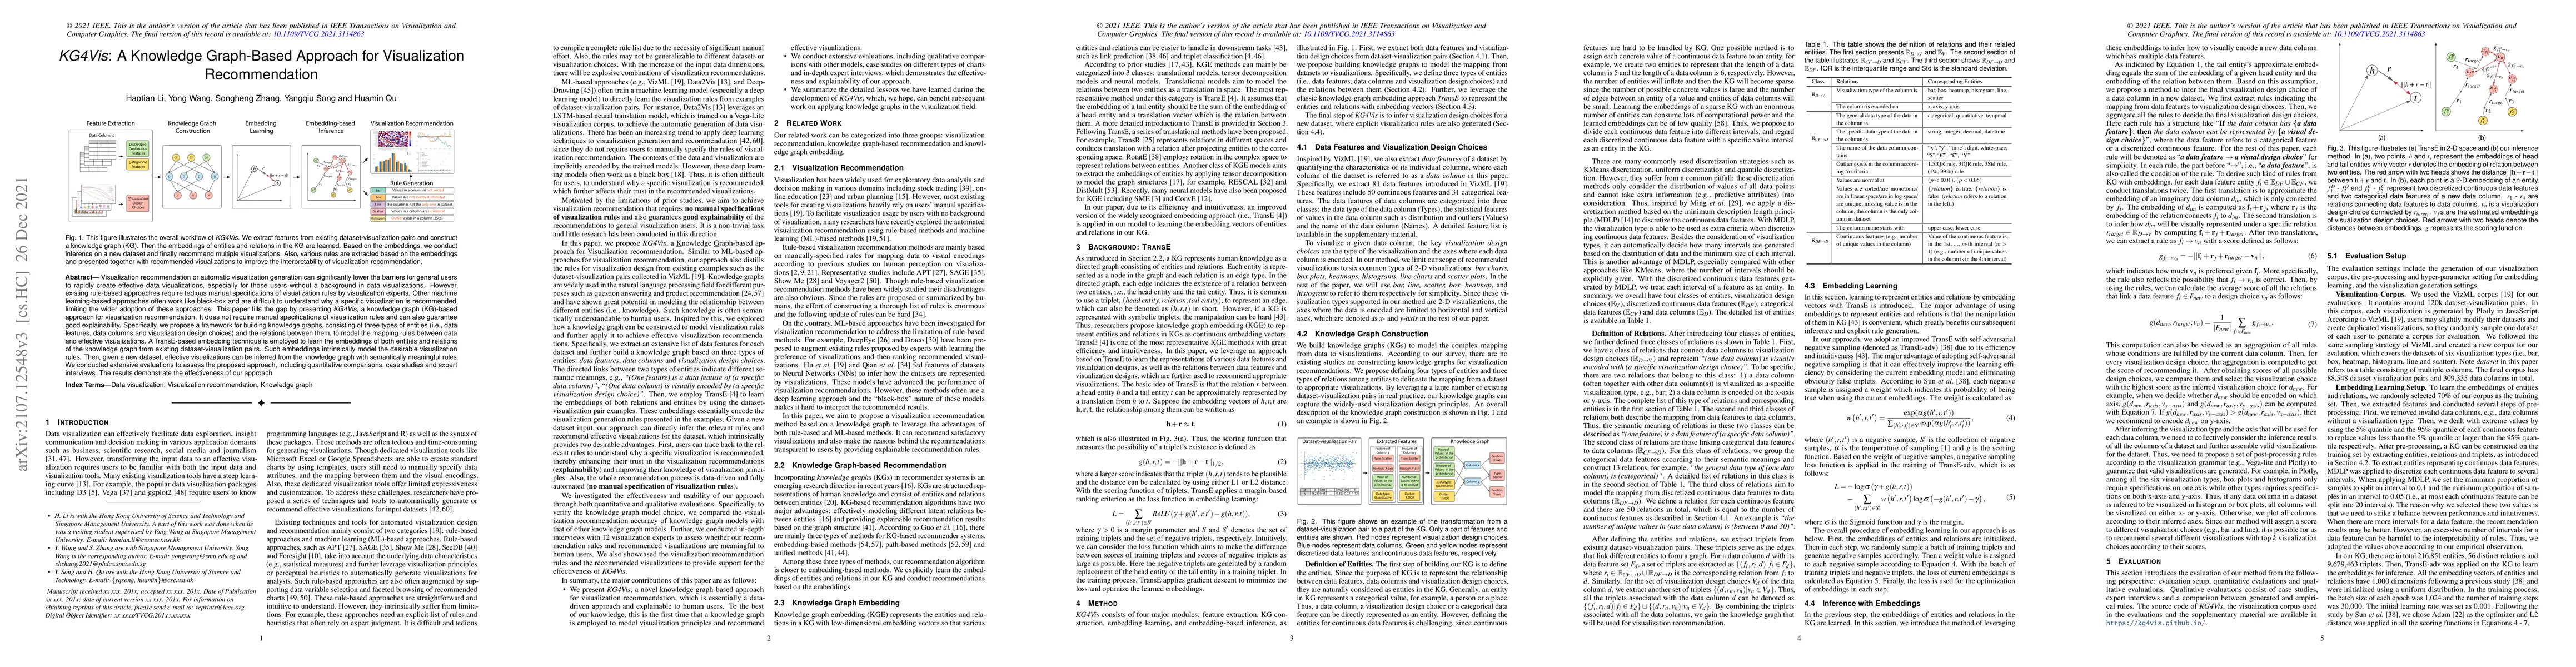
Visualization recommendation or automatic visualization generation can significantly lower the barriers for general users to rapidly create effective data visualizations, especially for those users ...
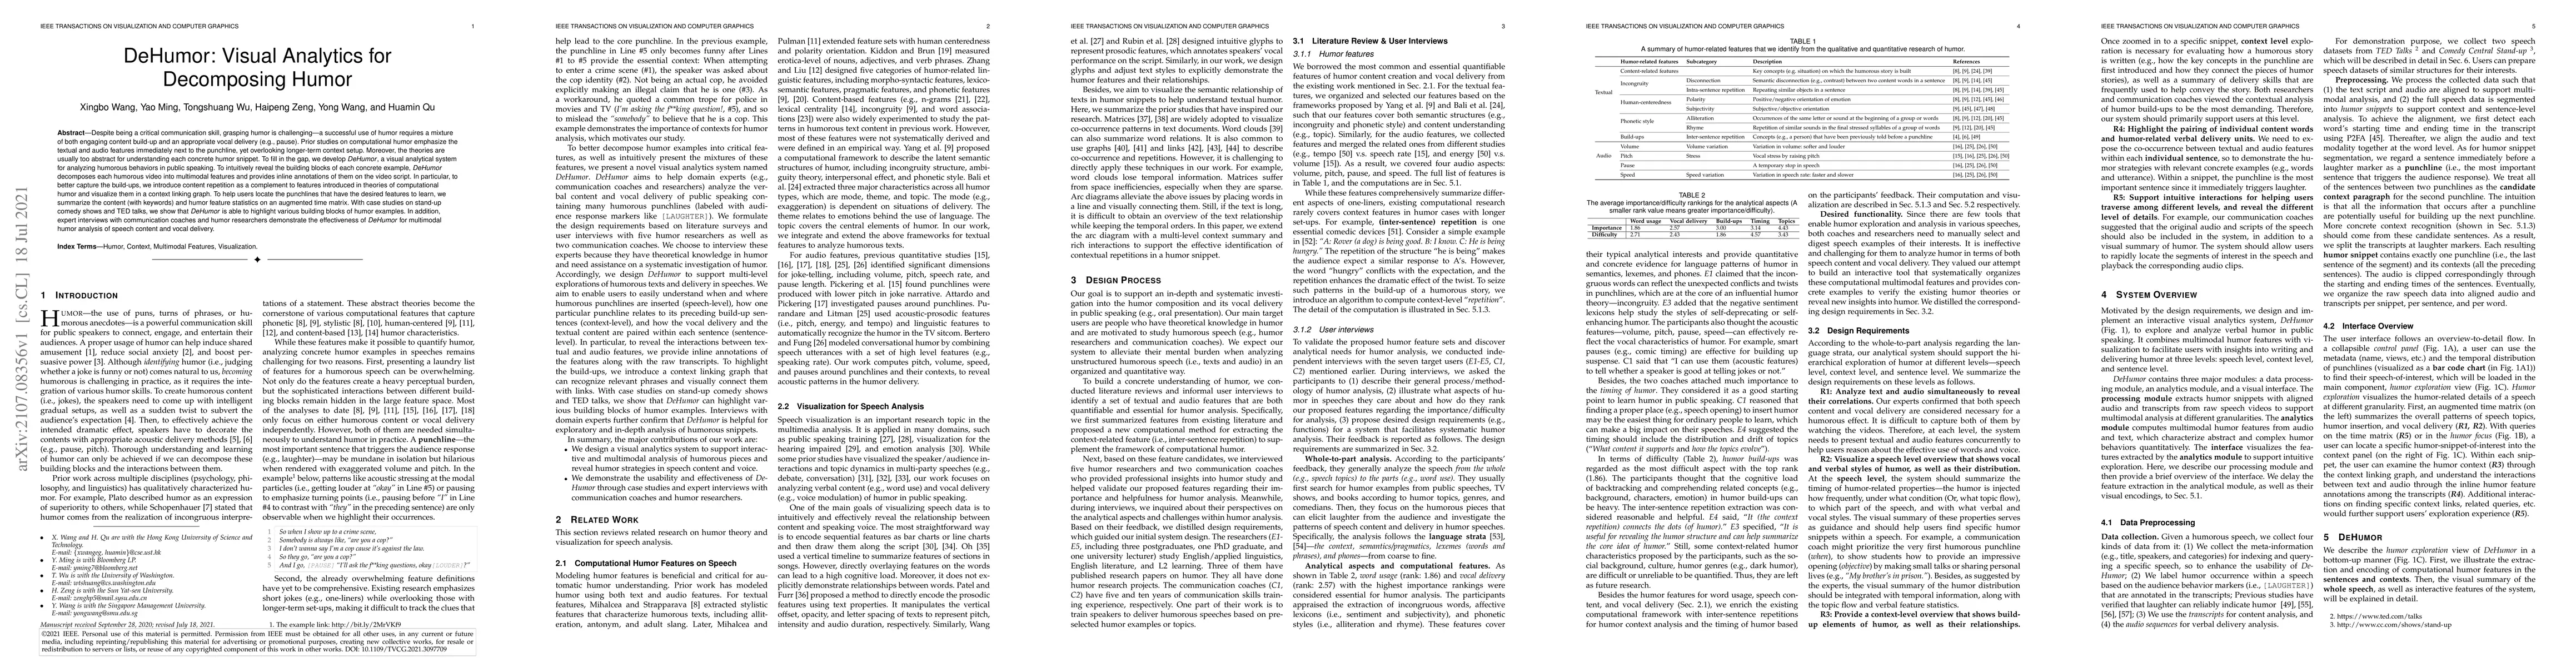
Despite being a critical communication skill, grasping humor is challenging -- a successful use of humor requires a mixture of both engaging content build-up and an appropriate vocal delivery (e.g.,...
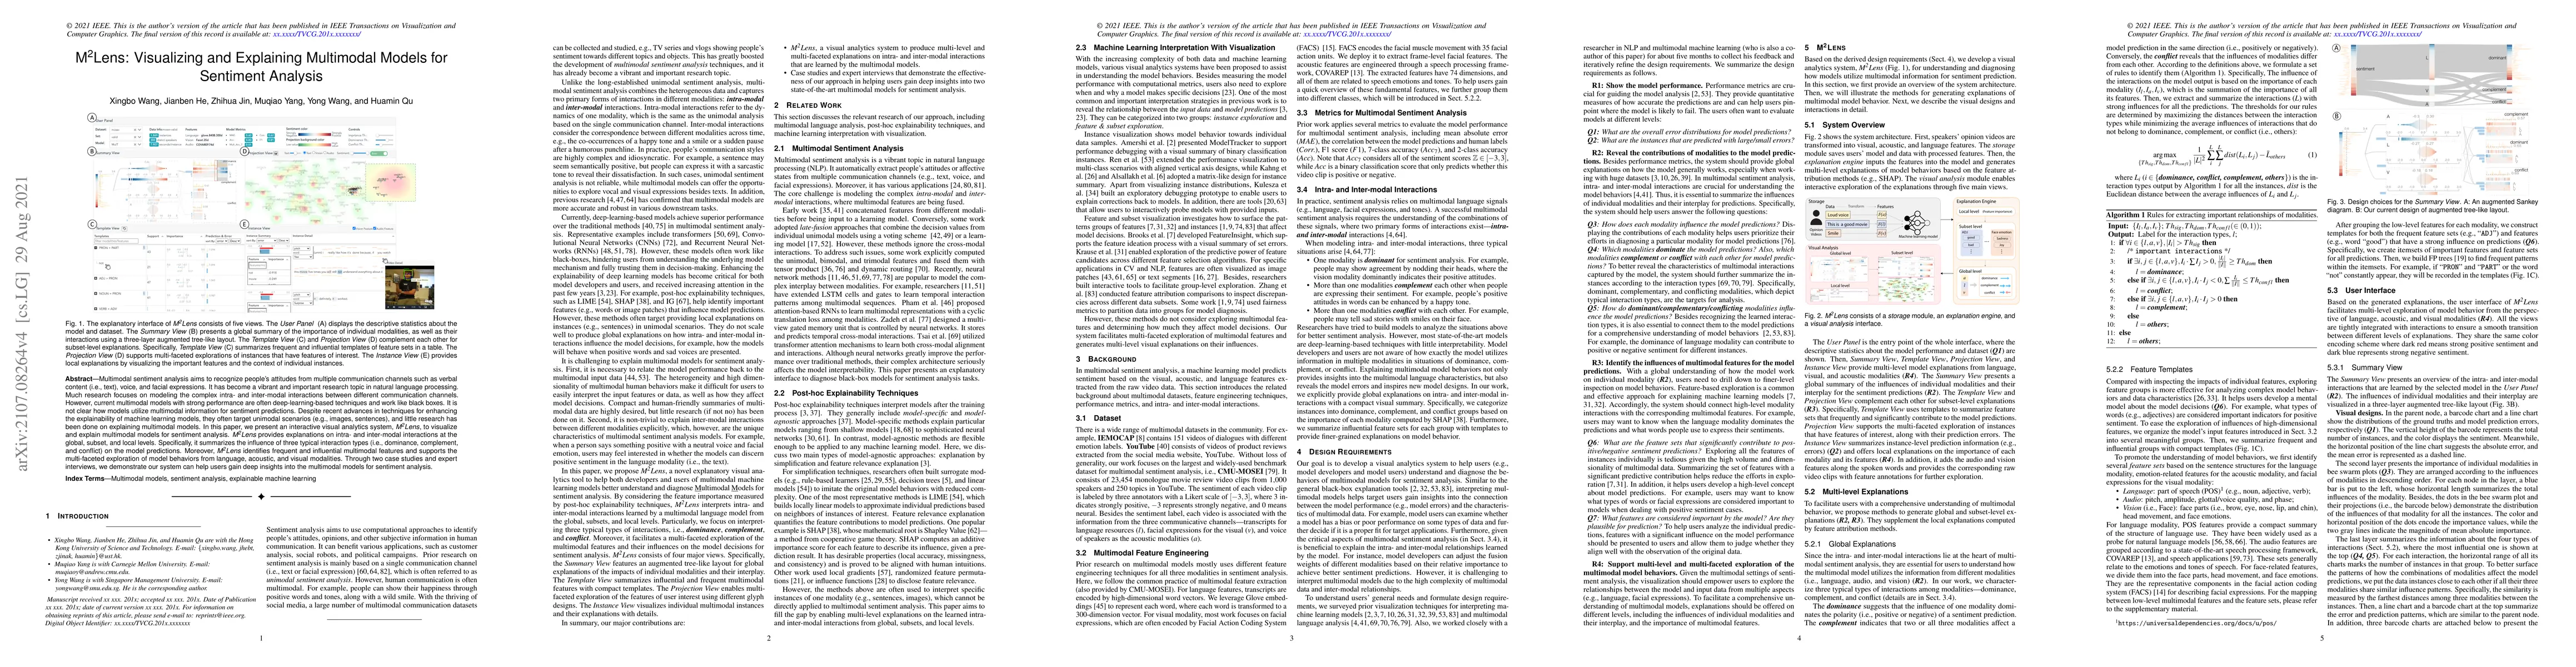
Multimodal sentiment analysis aims to recognize people's attitudes from multiple communication channels such as verbal content (i.e., text), voice, and facial expressions. It has become a vibrant an...
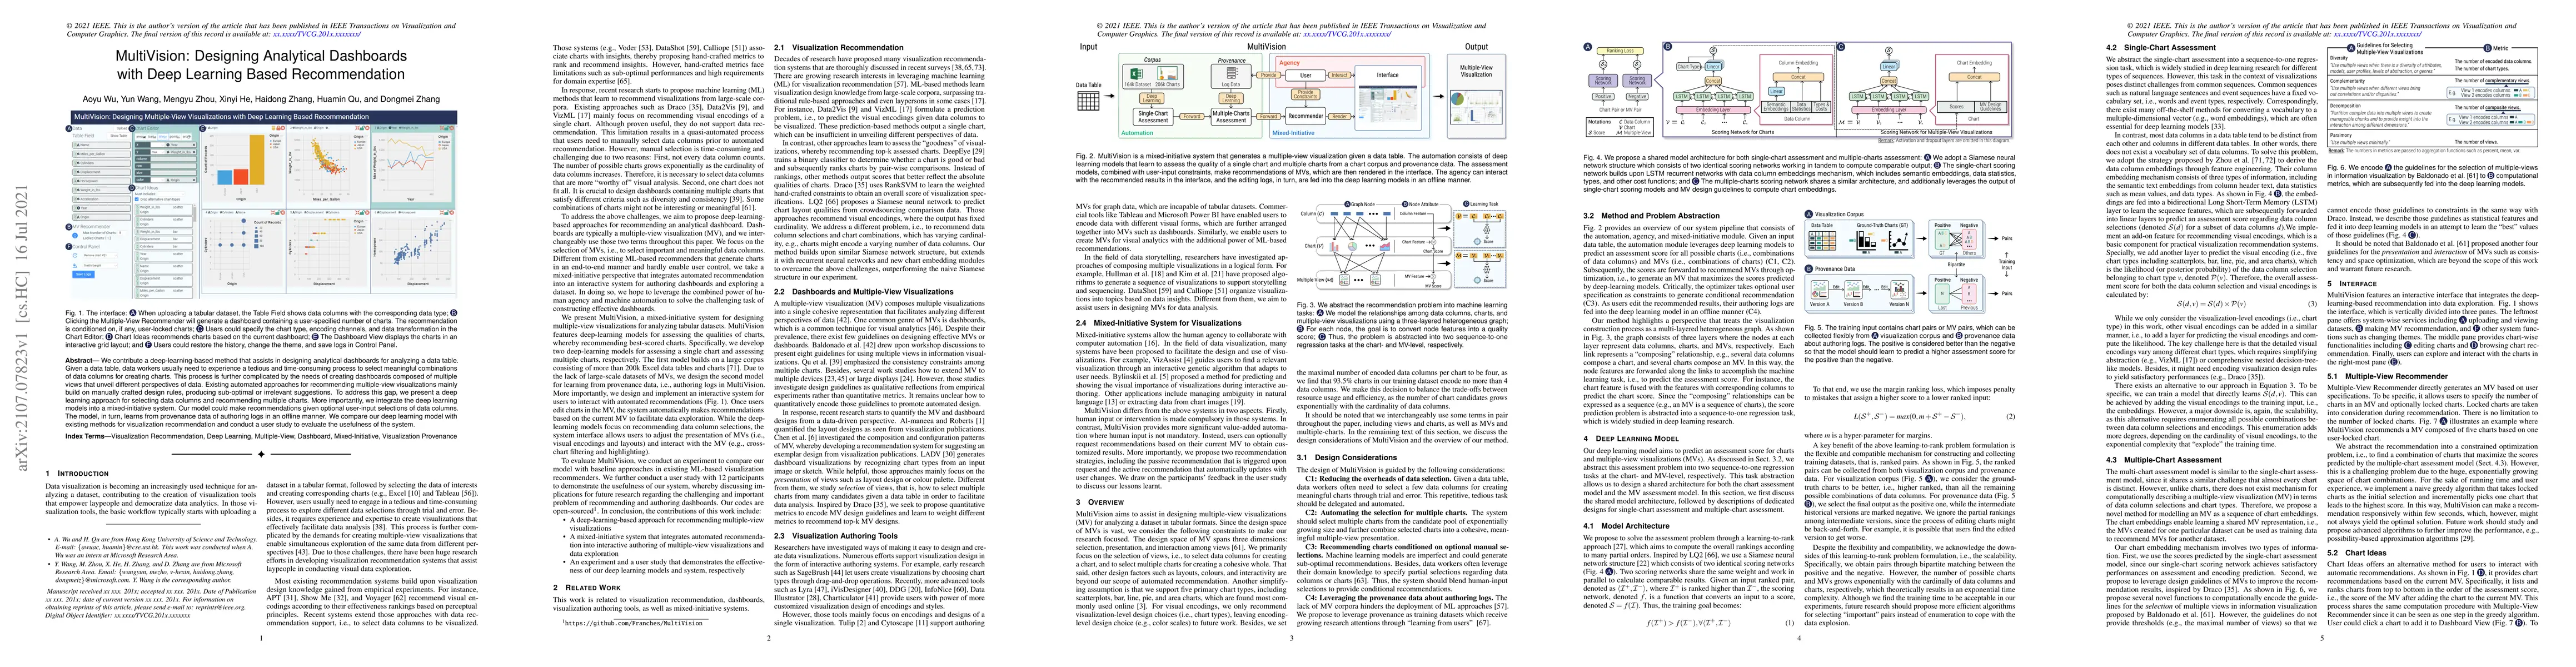
We contribute a deep-learning-based method that assists in designing analytical dashboards for analyzing a data table. Given a data table, data workers usually need to experience a tedious and time-...
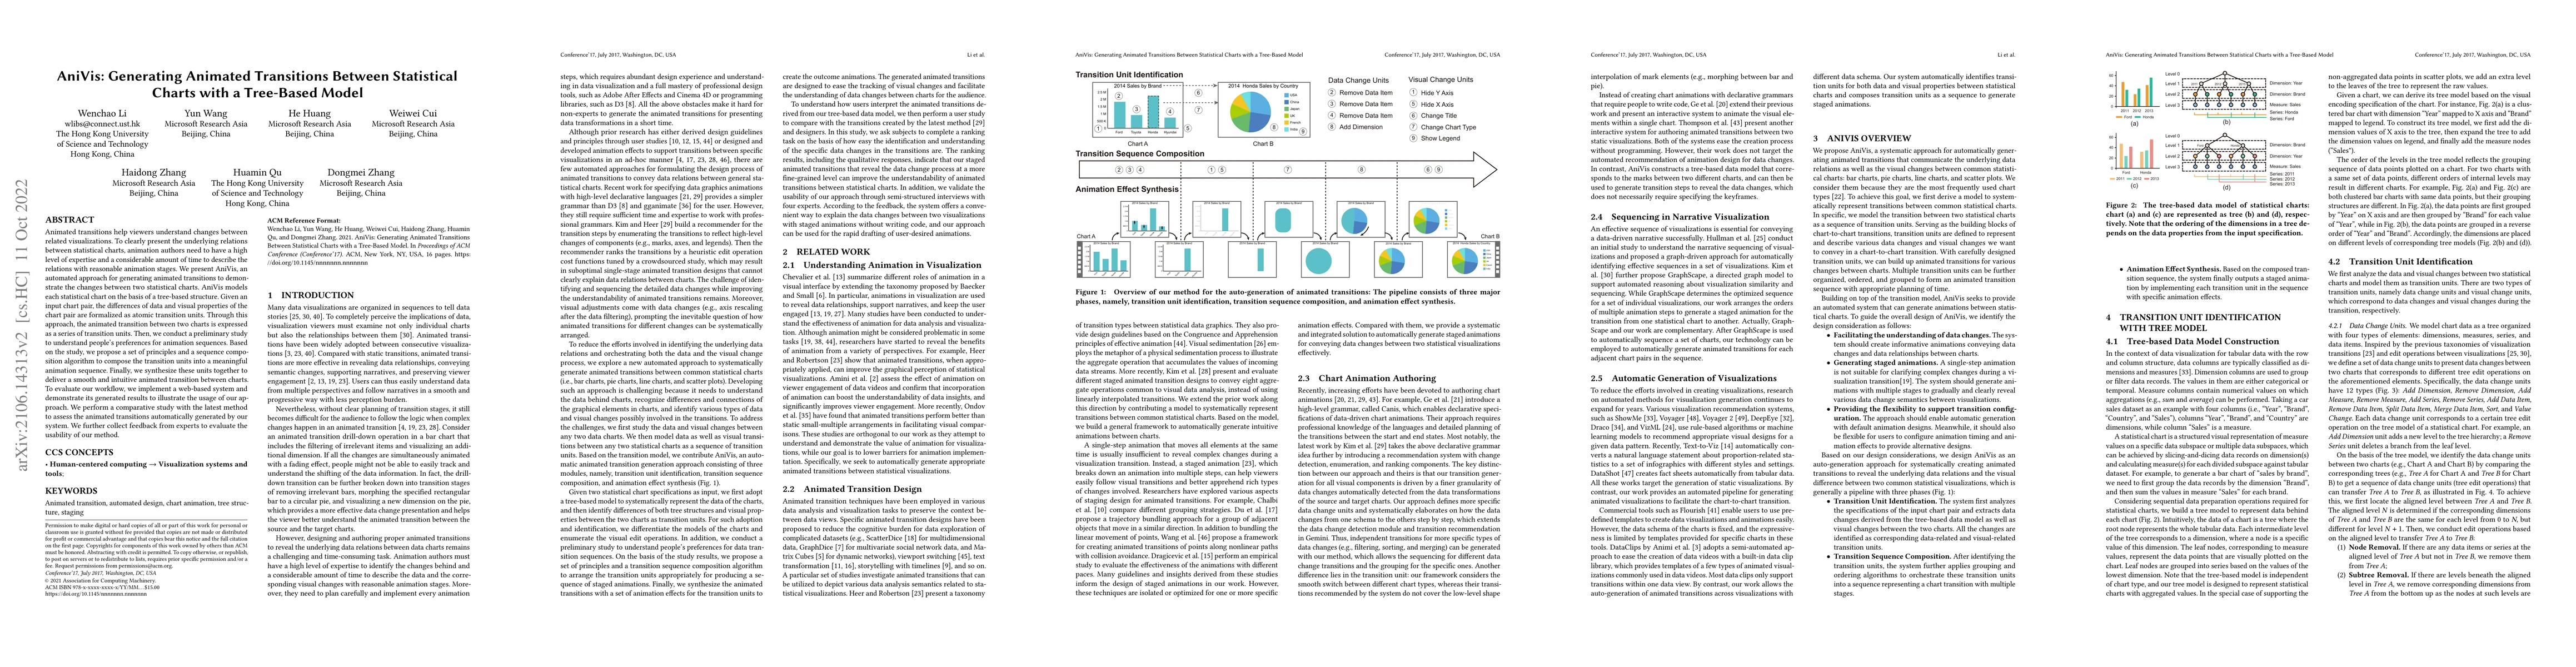
Animated transitions help viewers understand changes between related visualizations. To clearly present the underlying relations between statistical charts, animation authors need to have a high lev...
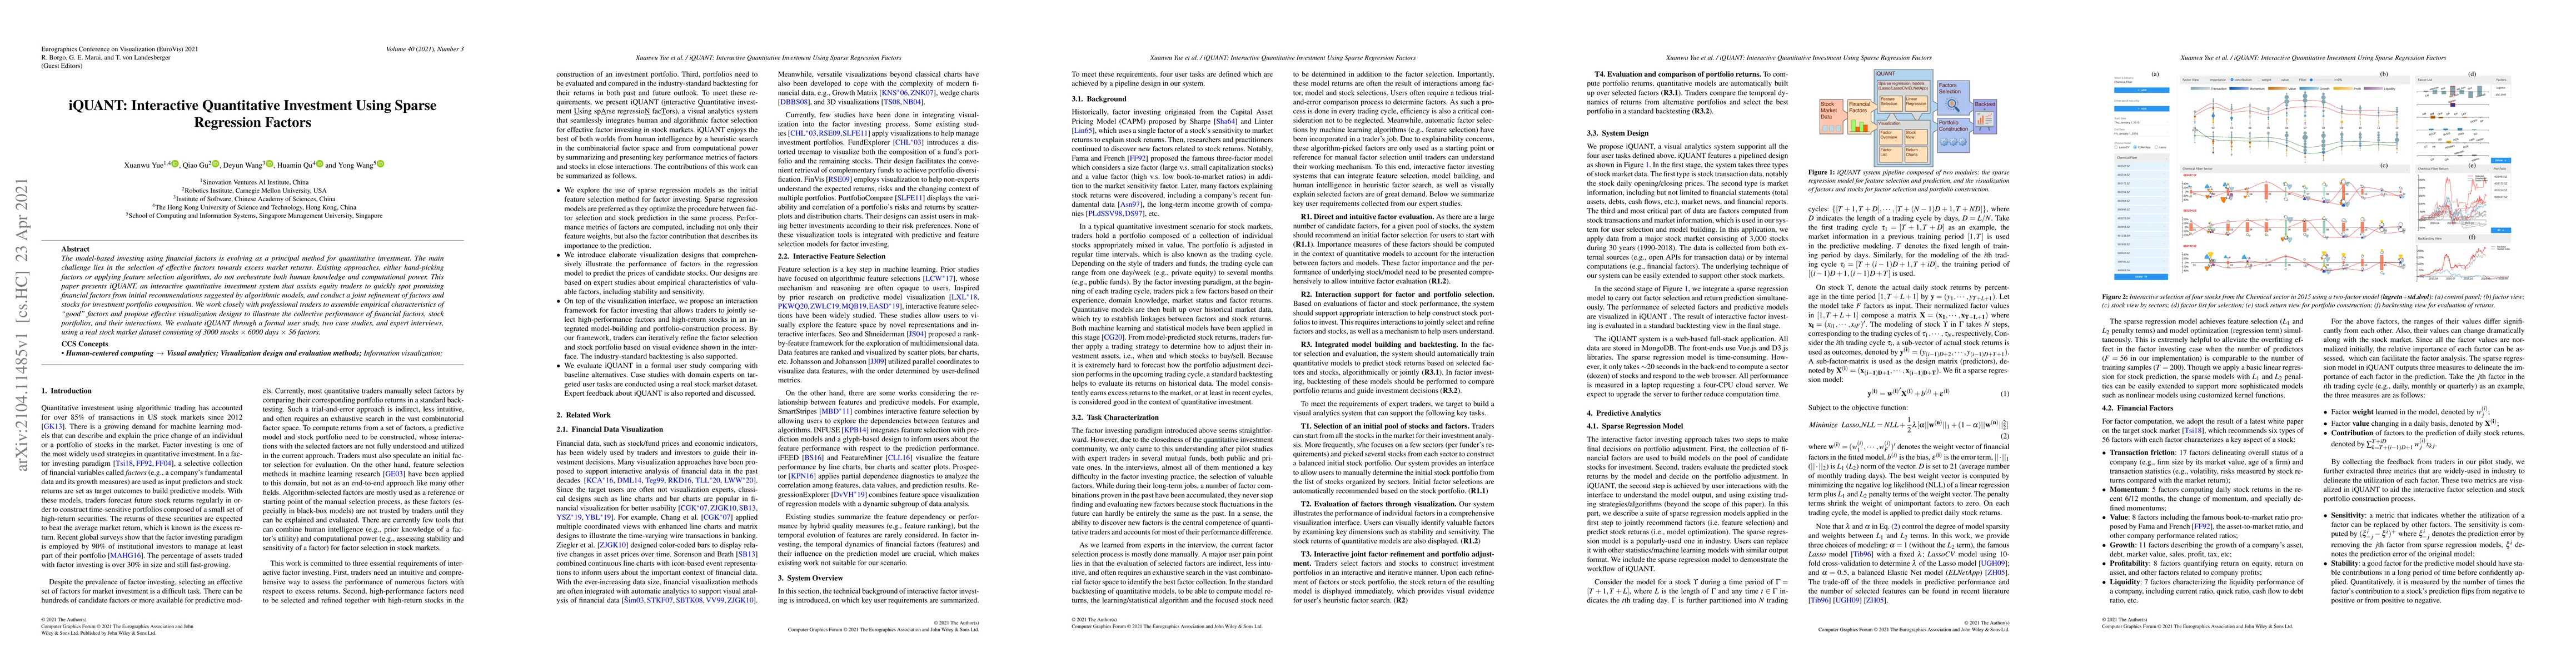
The model-based investing using financial factors is evolving as a principal method for quantitative investment. The main challenge lies in the selection of effective factors towards excess market r...
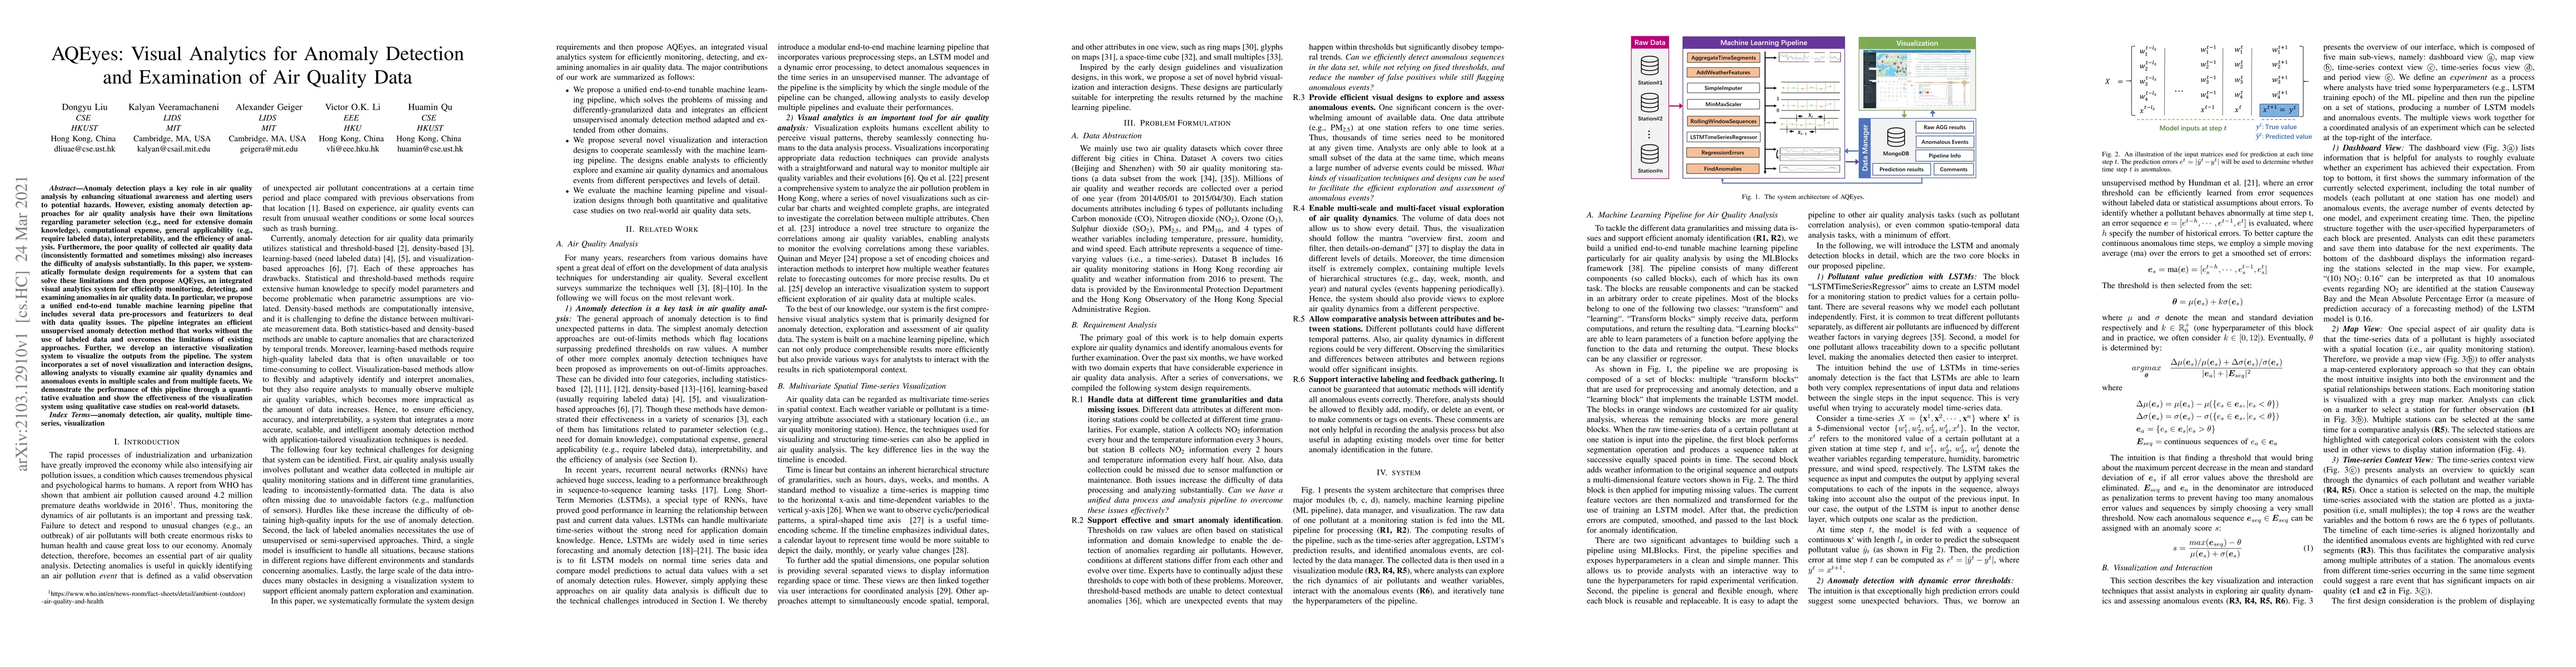
Anomaly detection plays a key role in air quality analysis by enhancing situational awareness and alerting users to potential hazards. However, existing anomaly detection approaches for air quality ...
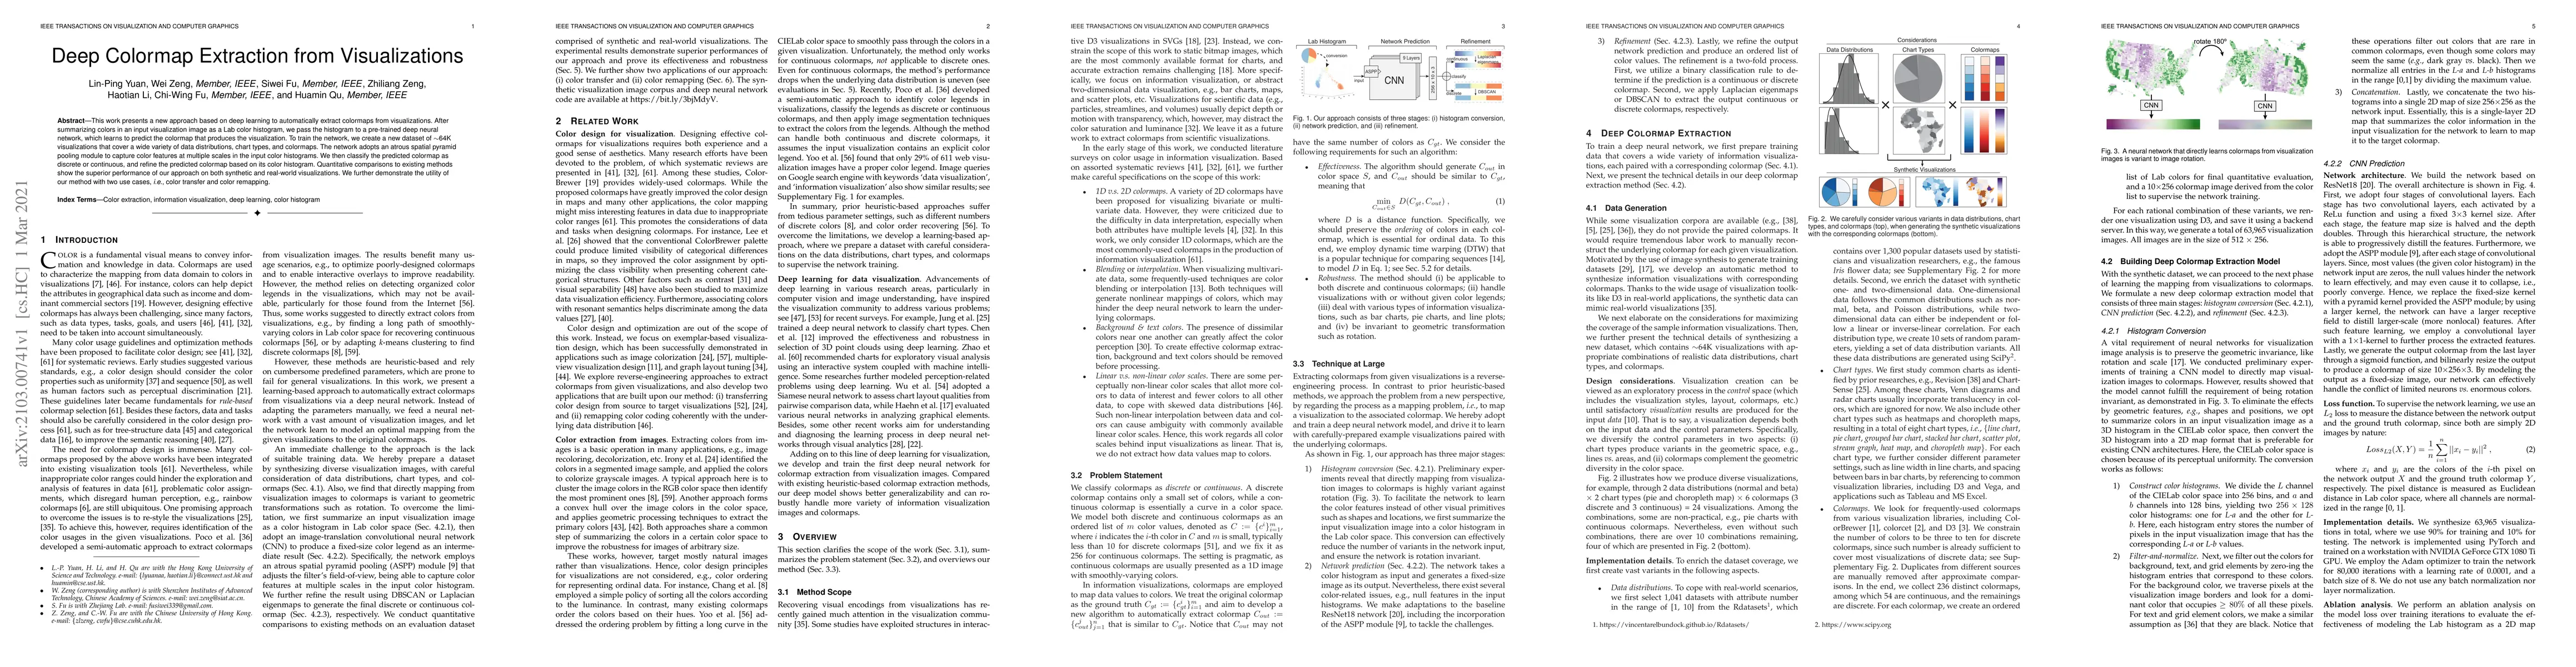
This work presents a new approach based on deep learning to automatically extract colormaps from visualizations. After summarizing colors in an input visualization image as a Lab color histogram, we...
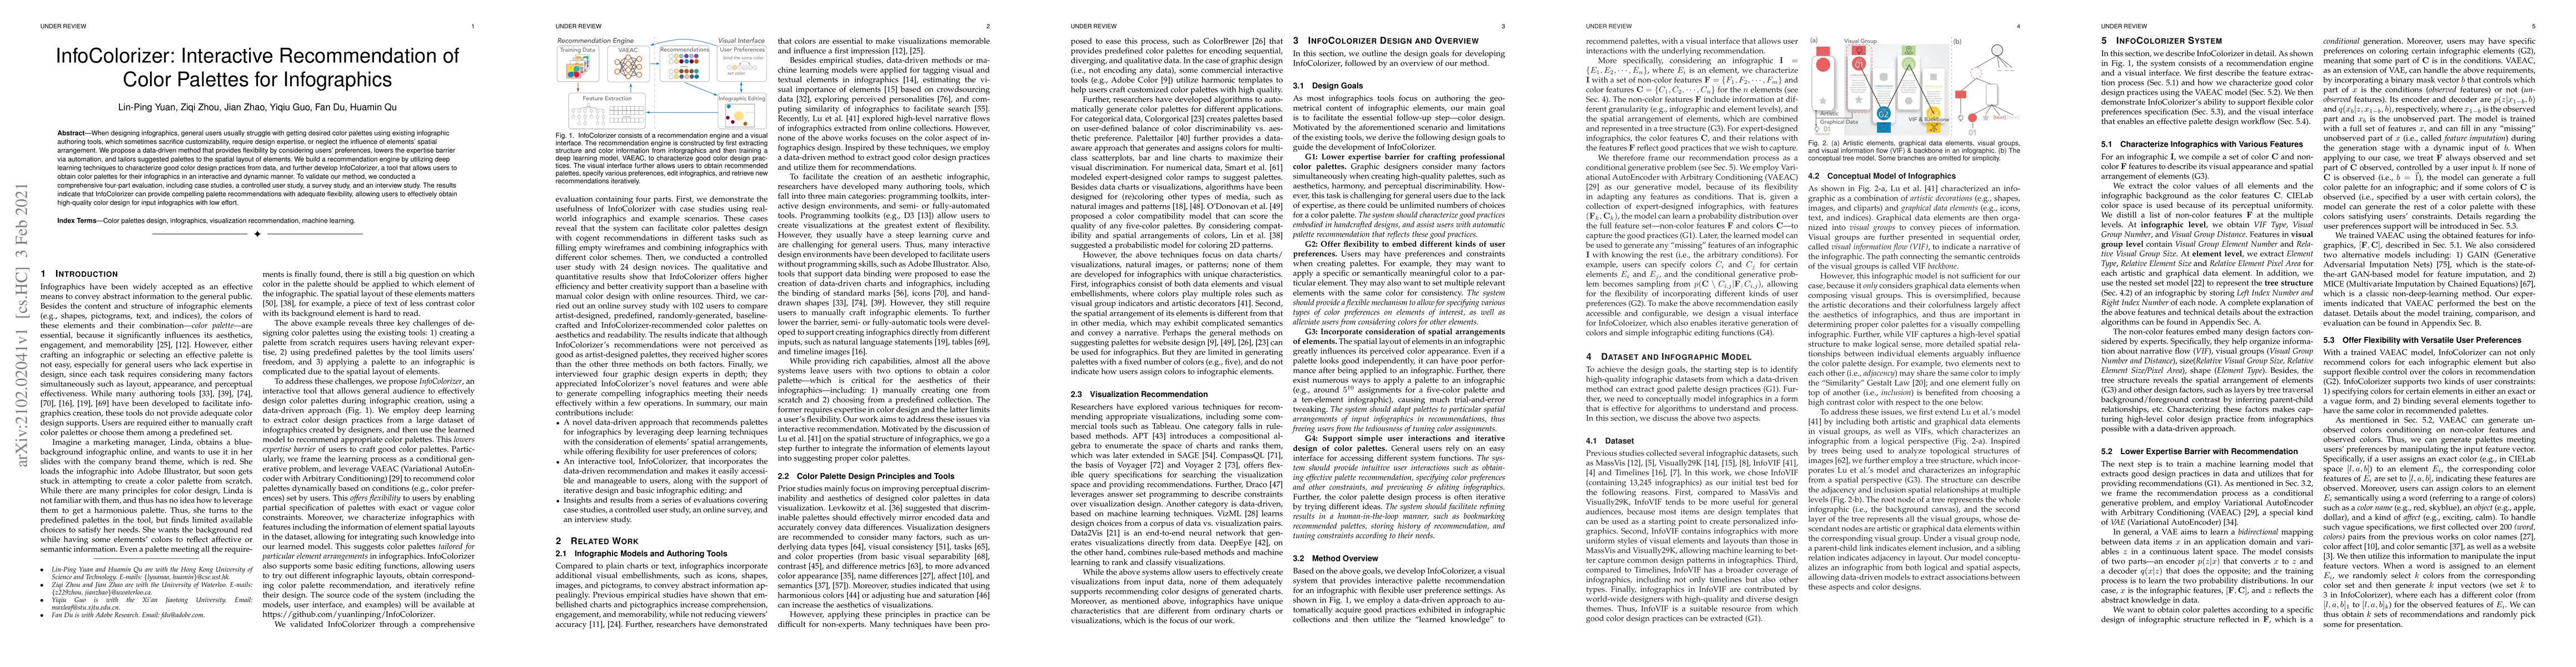
When designing infographics, general users usually struggle with getting desired color palettes using existing infographic authoring tools, which sometimes sacrifice customizability, require design ...
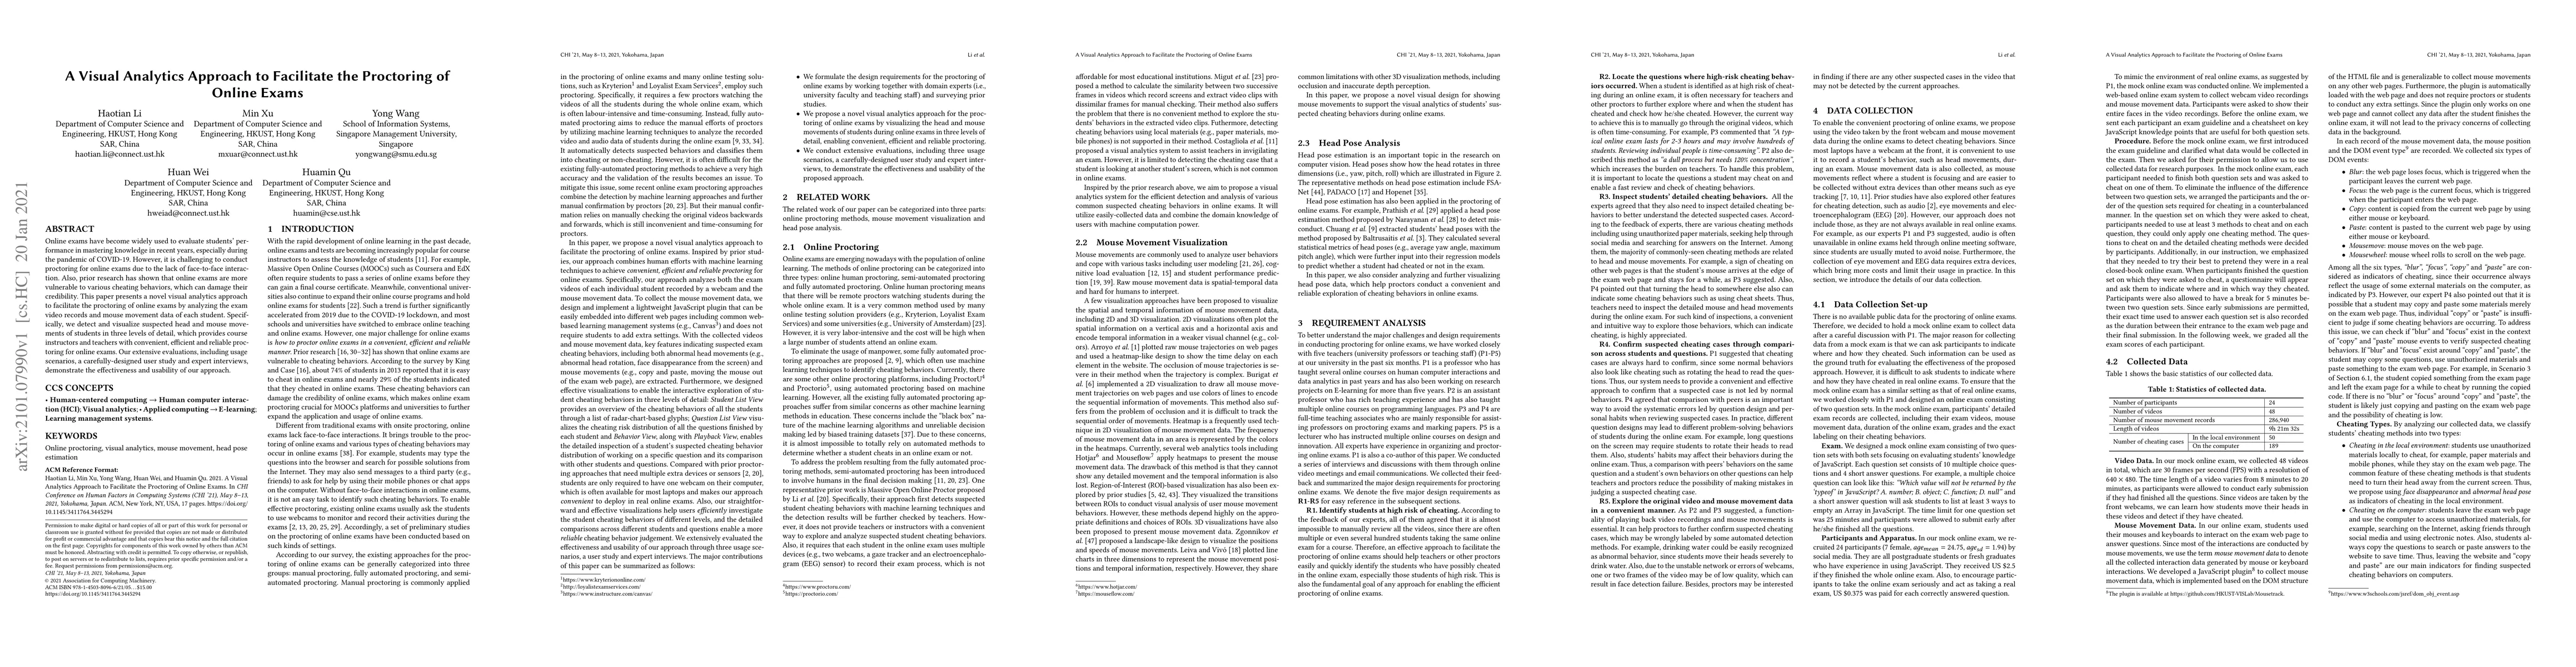
Online exams have become widely used to evaluate students' performance in mastering knowledge in recent years, especially during the pandemic of COVID-19. However, it is challenging to conduct proct...
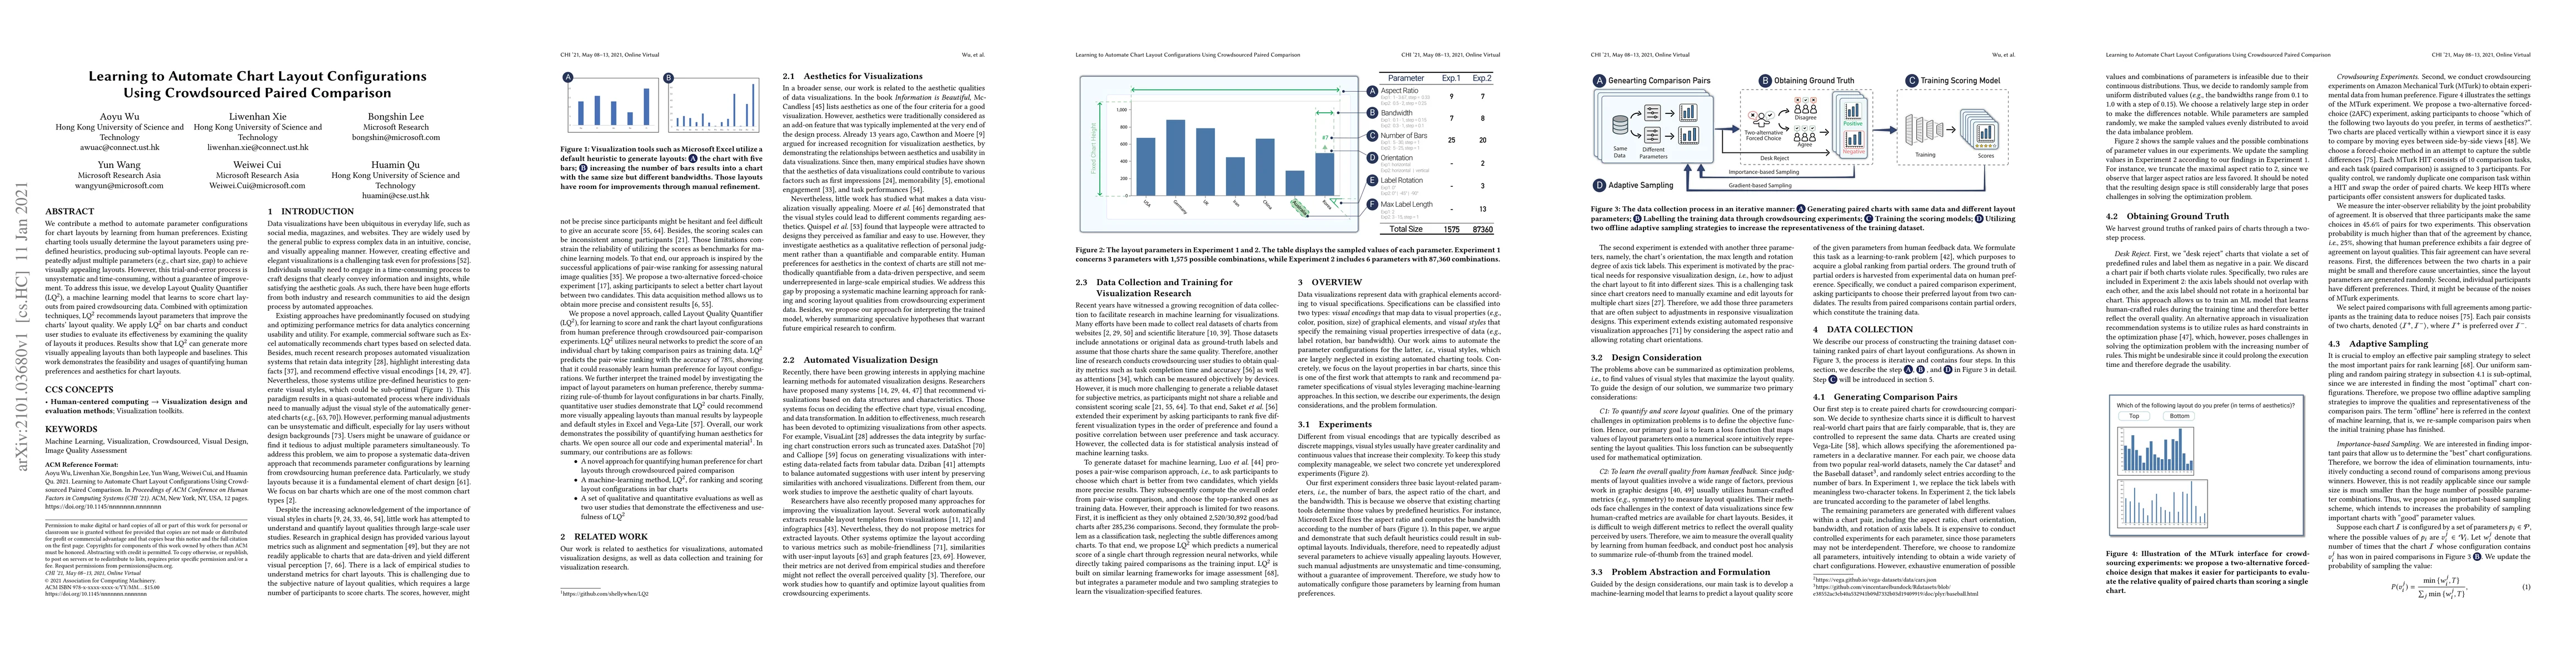
We contribute a method to automate parameter configurations for chart layouts by learning from human preferences. Existing charting tools usually determine the layout parameters using predefined heu...
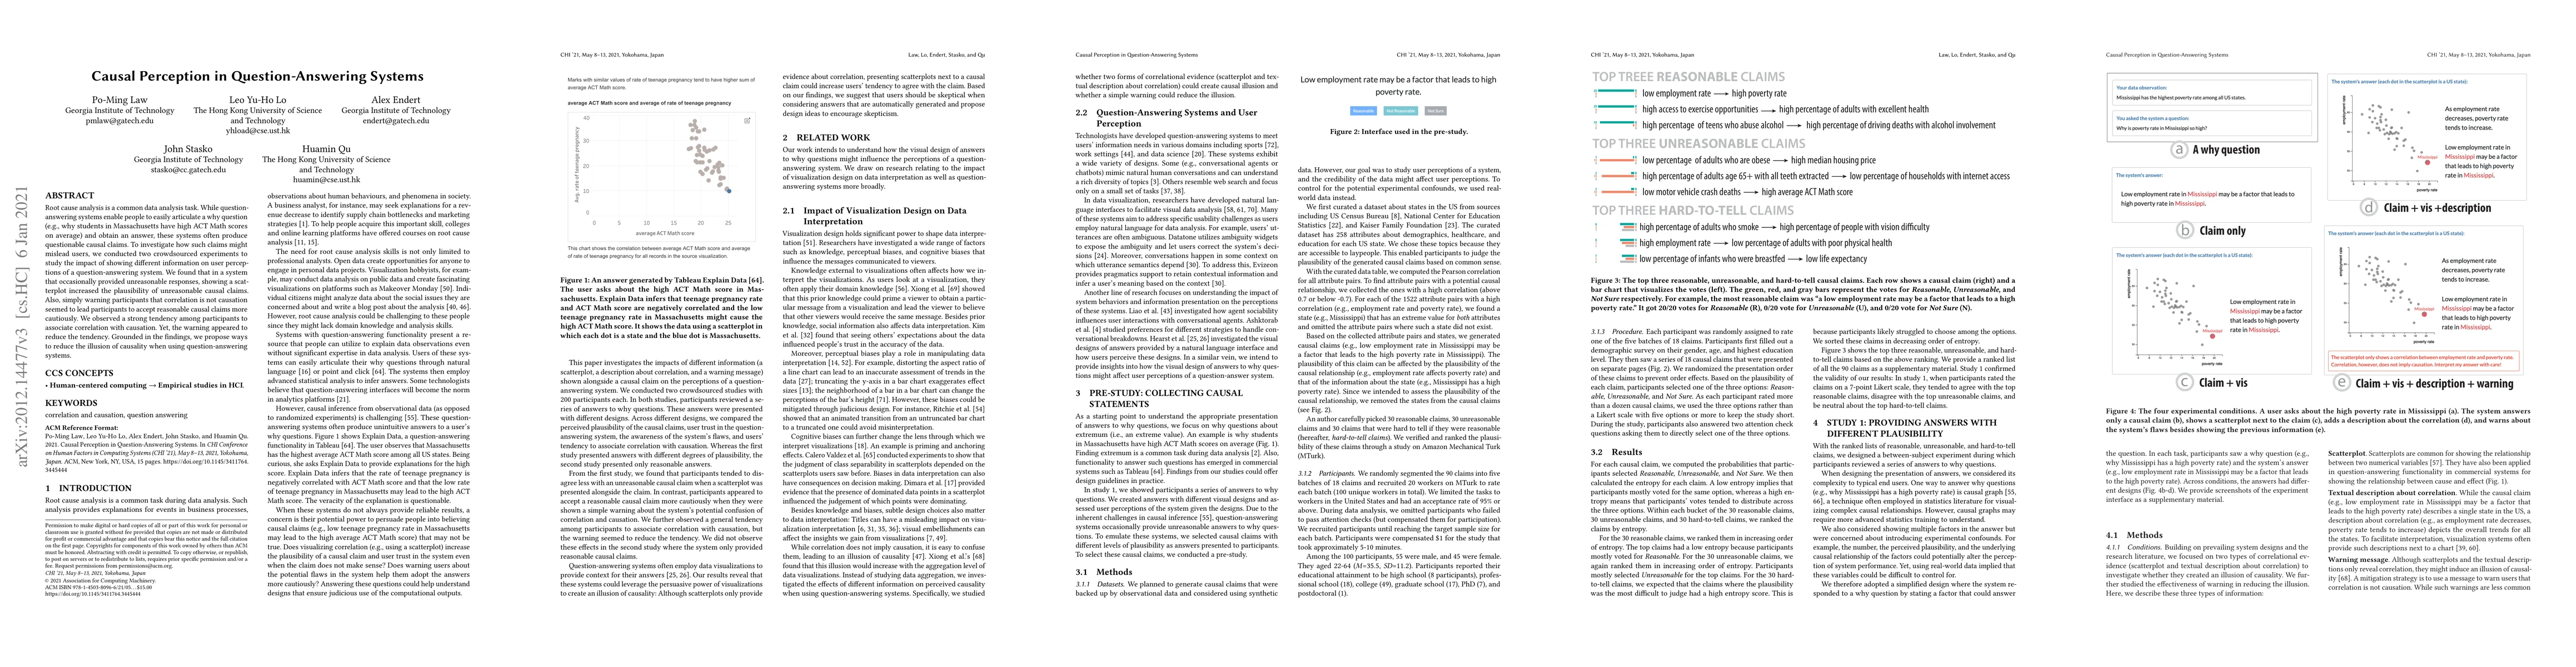
Root cause analysis is a common data analysis task. While question-answering systems enable people to easily articulate a why question (e.g., why students in Massachusetts have high ACT Math scores ...
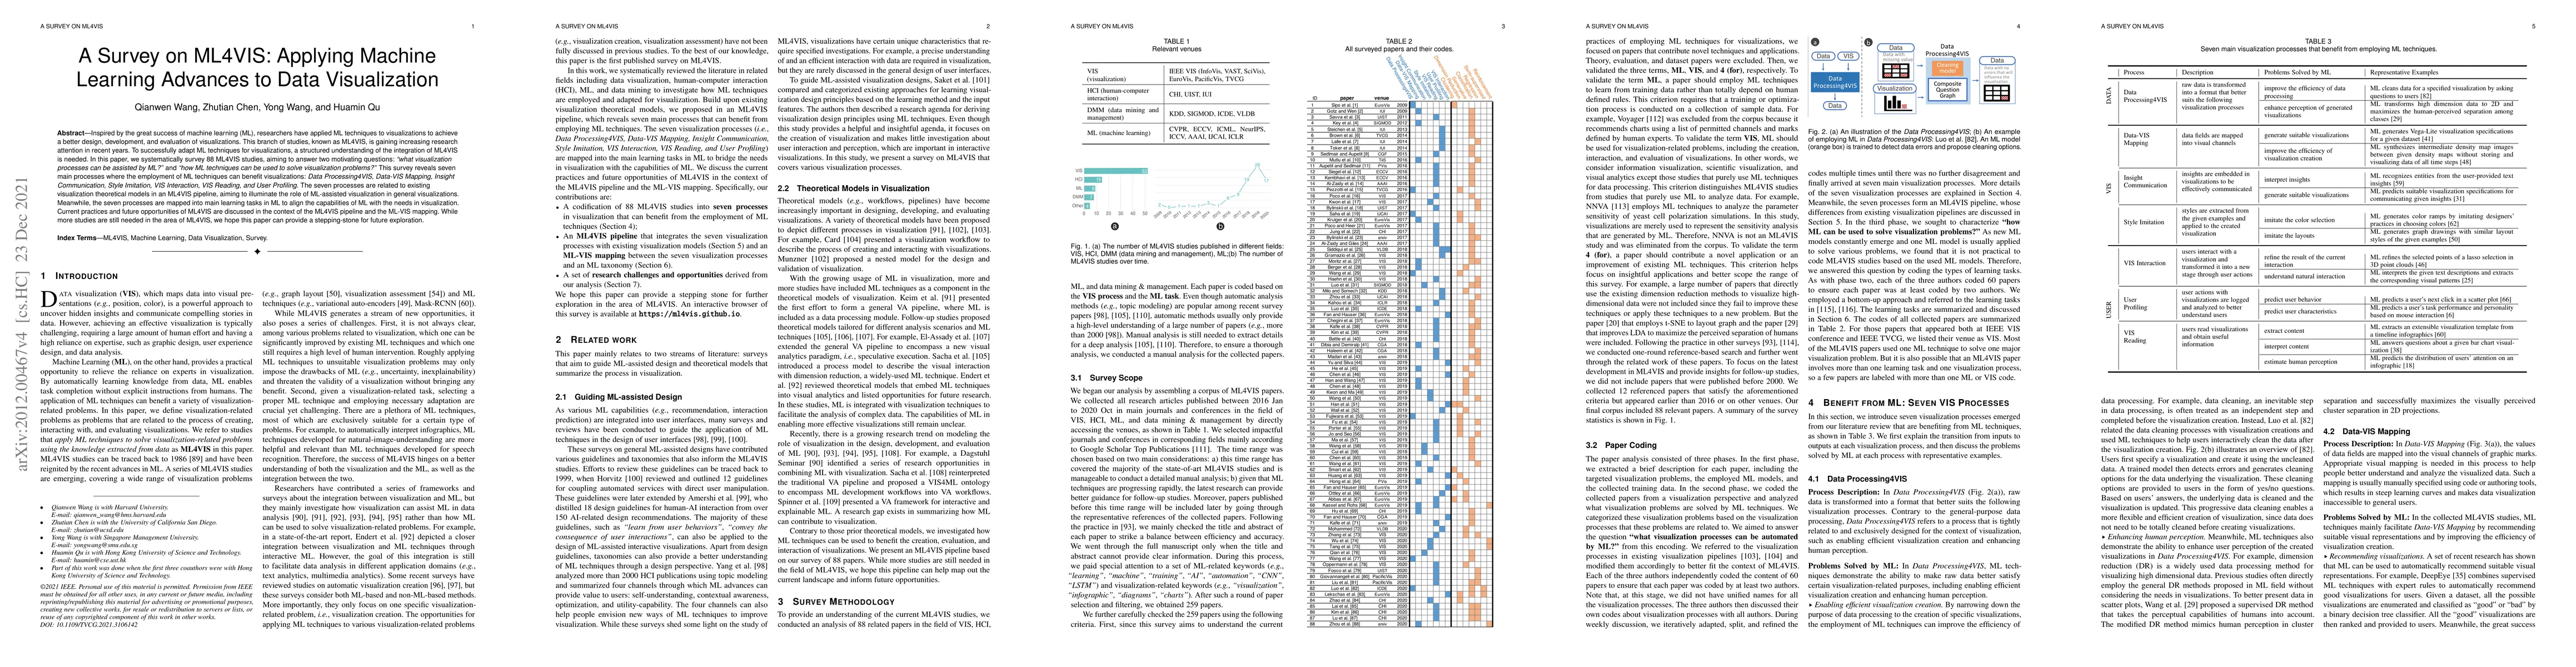
Inspired by the great success of machine learning (ML), researchers have applied ML techniques to visualizations to achieve a better design, development, and evaluation of visualizations. This branc...
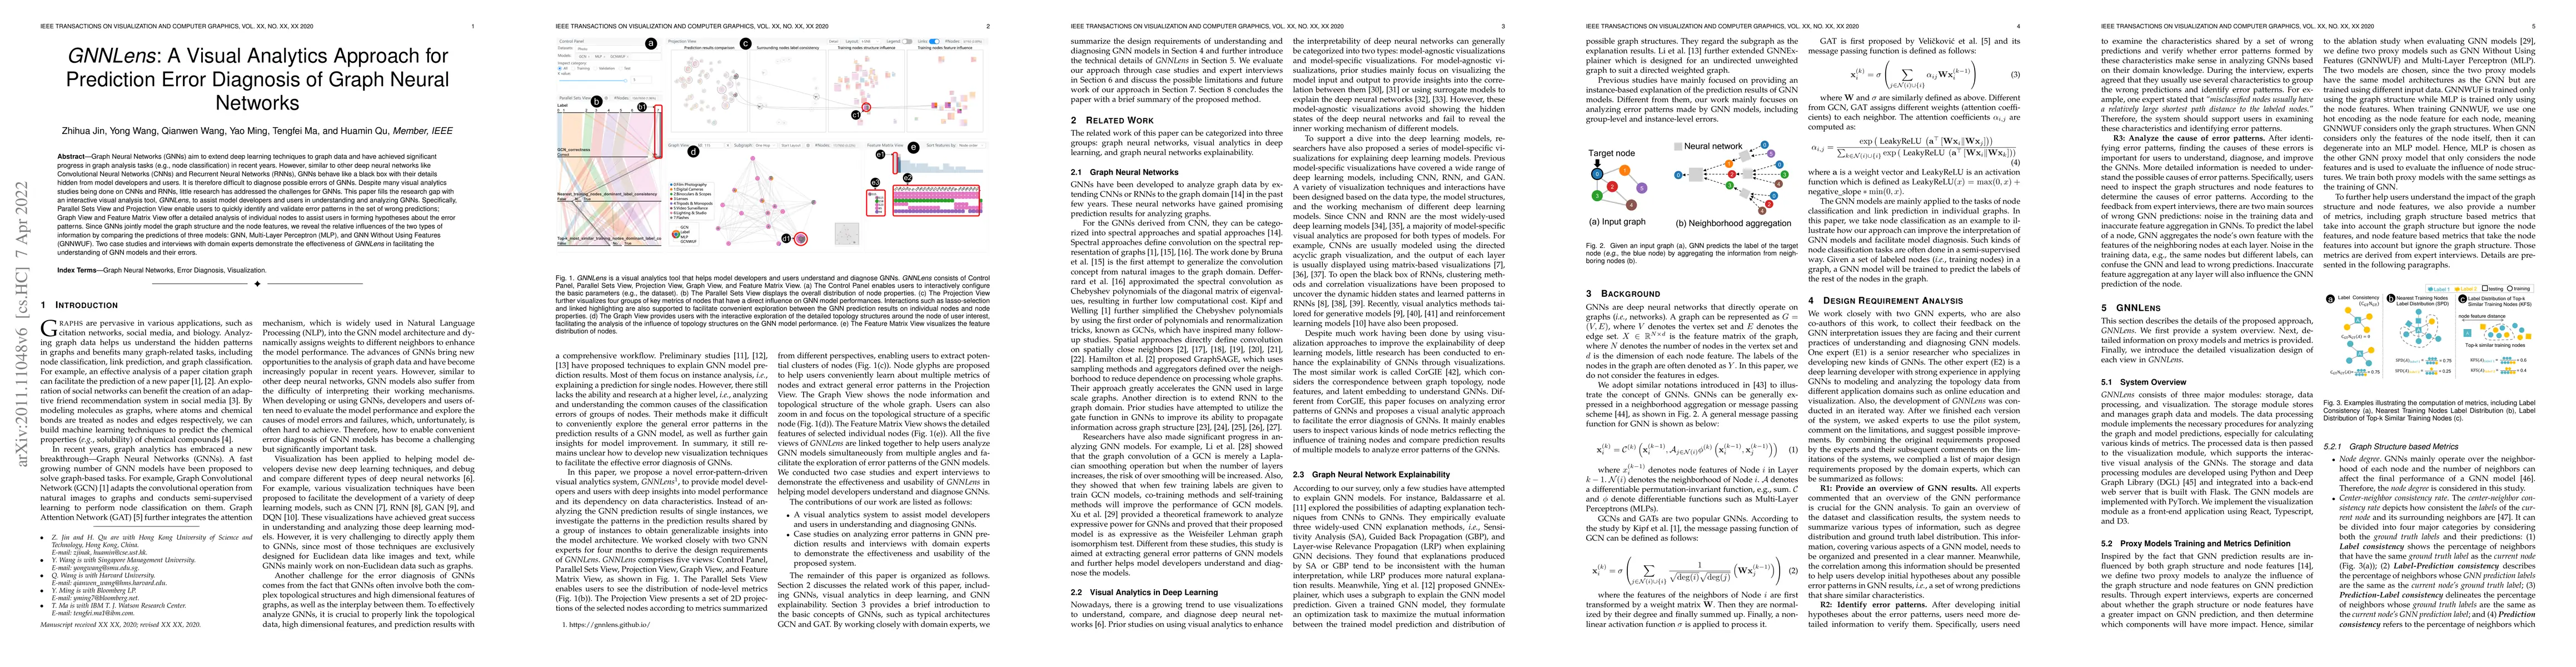
Graph Neural Networks (GNNs) aim to extend deep learning techniques to graph data and have achieved significant progress in graph analysis tasks (e.g., node classification) in recent years. However,...
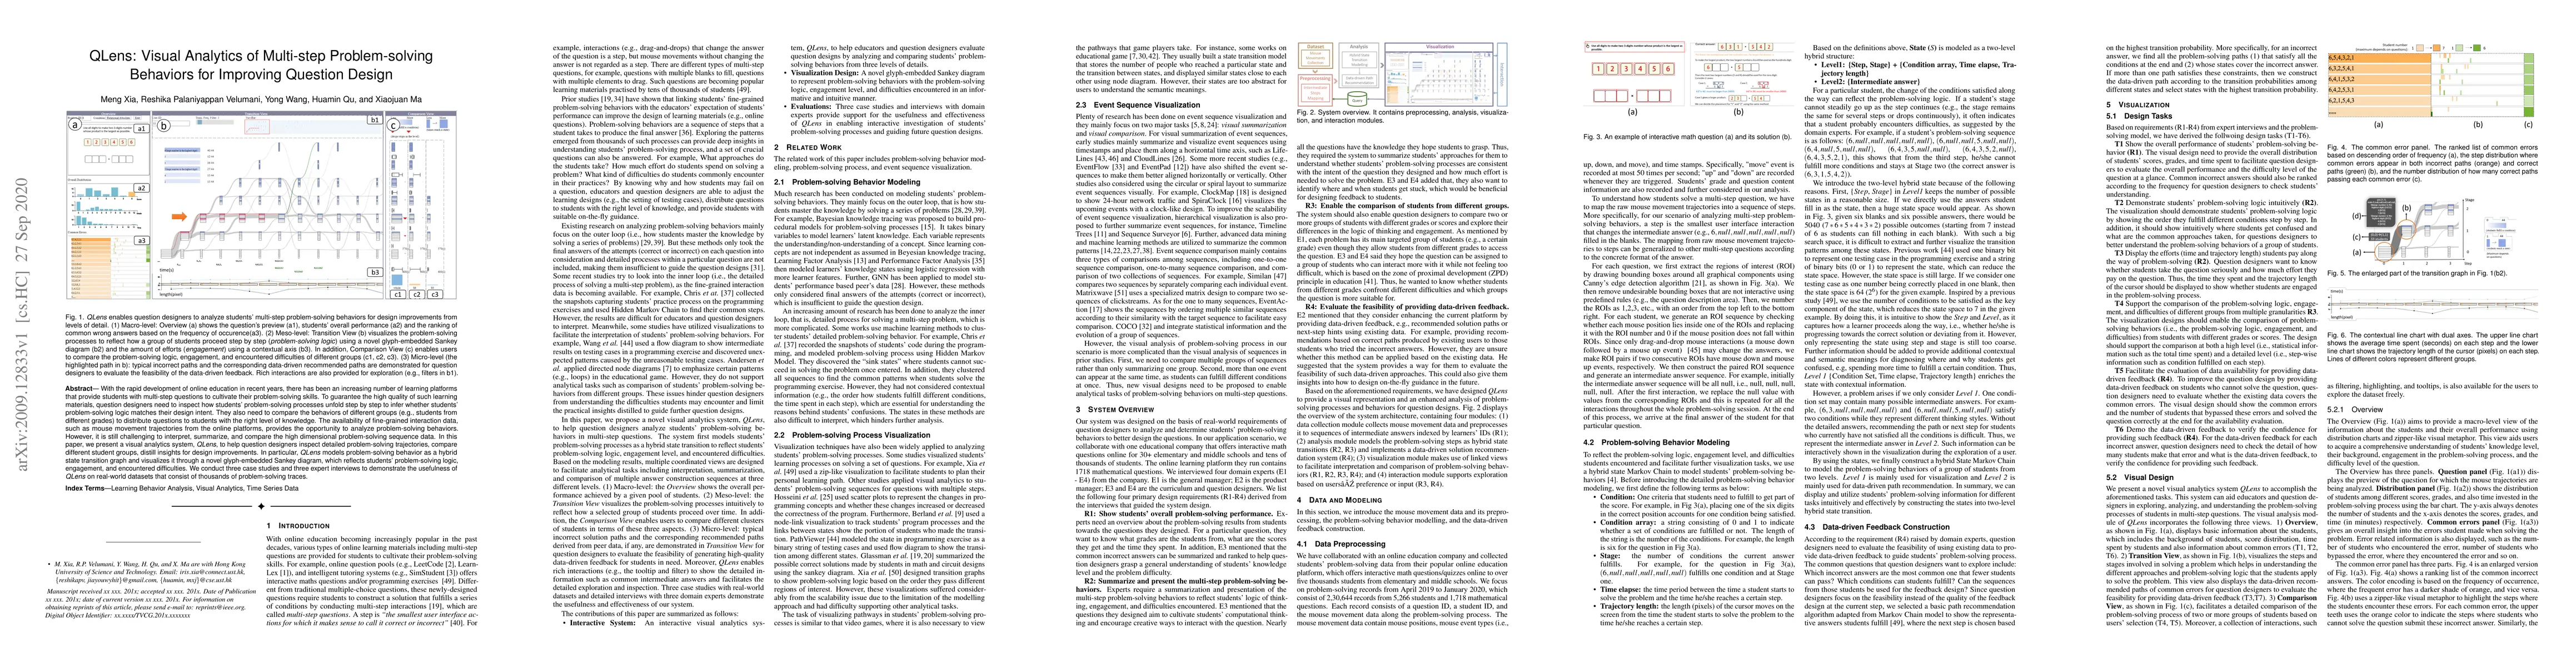
With the rapid development of online education in recent years, there has been an increasing number of learning platforms that provide students with multi-step questions to cultivate their problem-s...
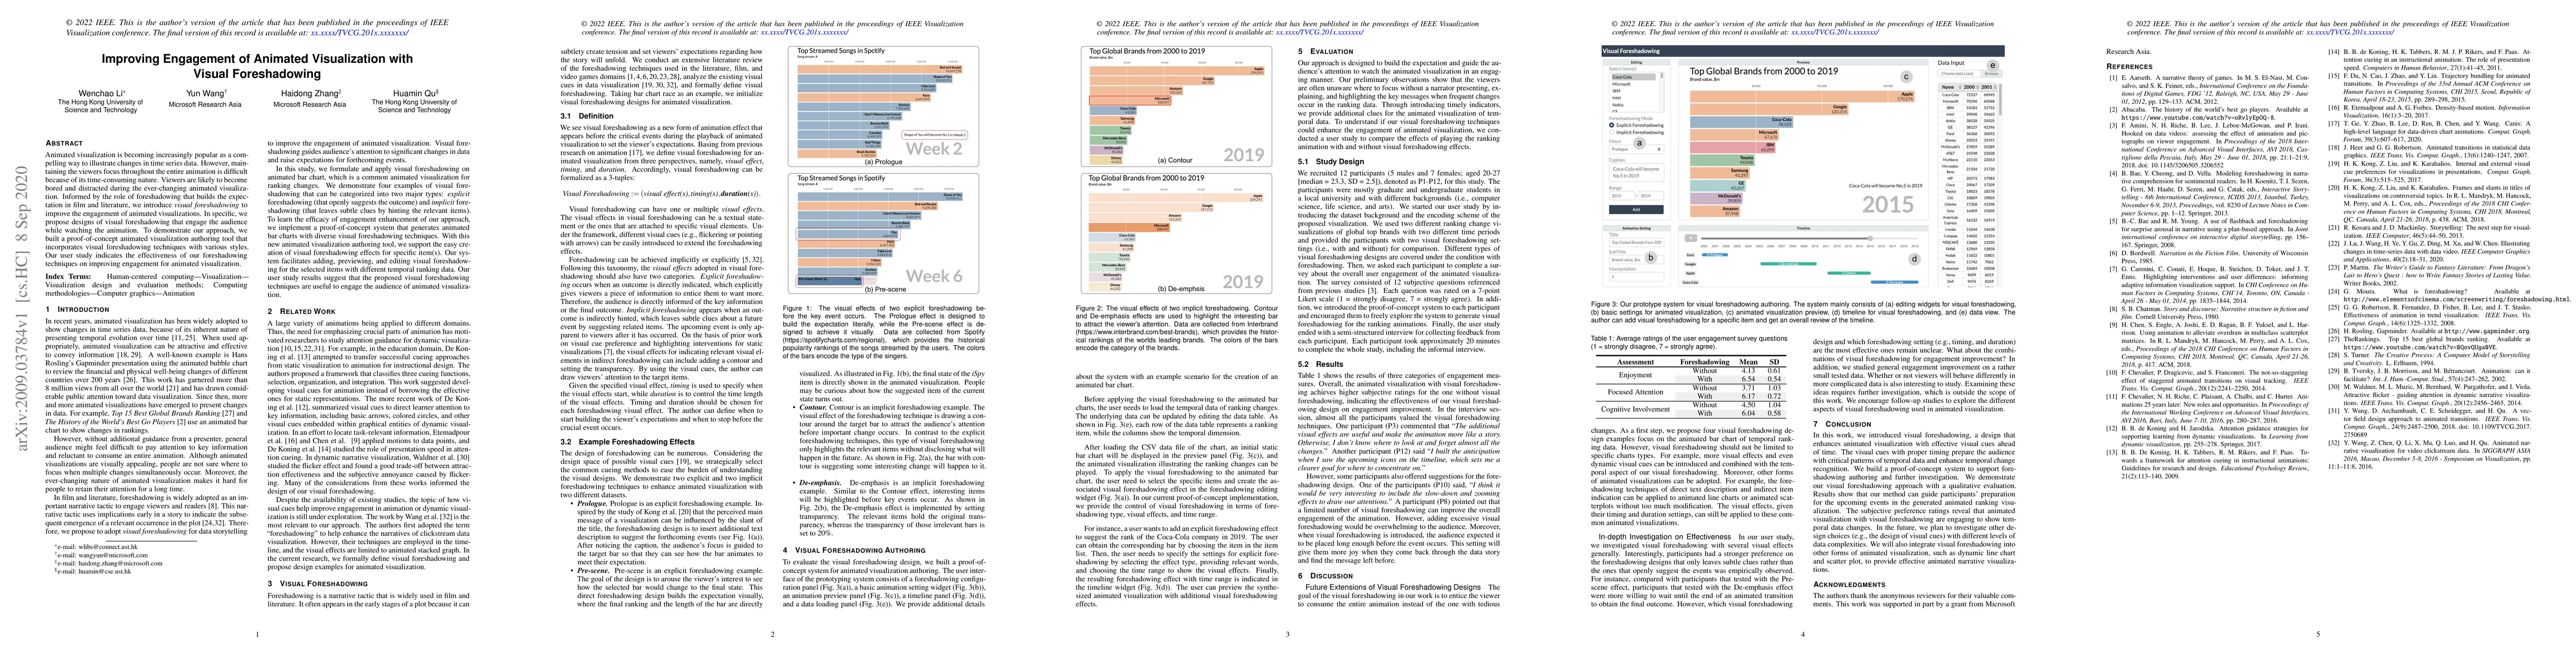
Animated visualization is becoming increasingly popular as a compelling way to illustrate changes in time series data. However, maintaining the viewer's focus throughout the entire animation is diff...
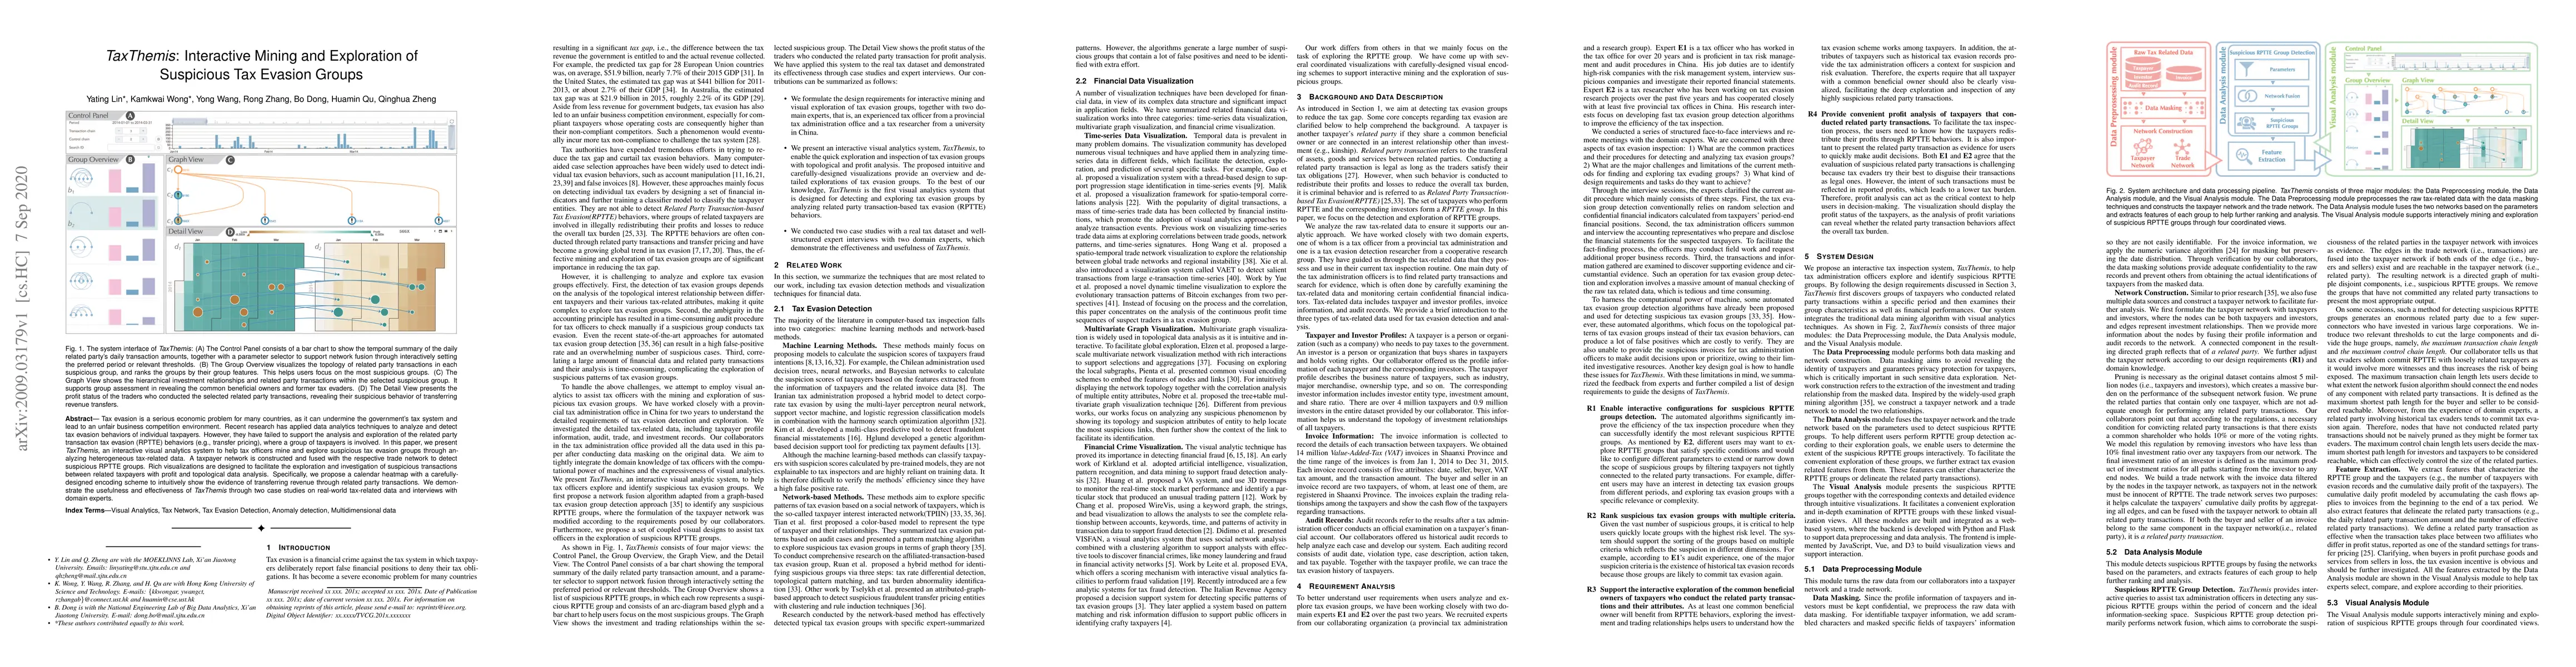
Tax evasion is a serious economic problem for many countries, as it can undermine the government' s tax system and lead to an unfair business competition environment. Recent research has applied dat...
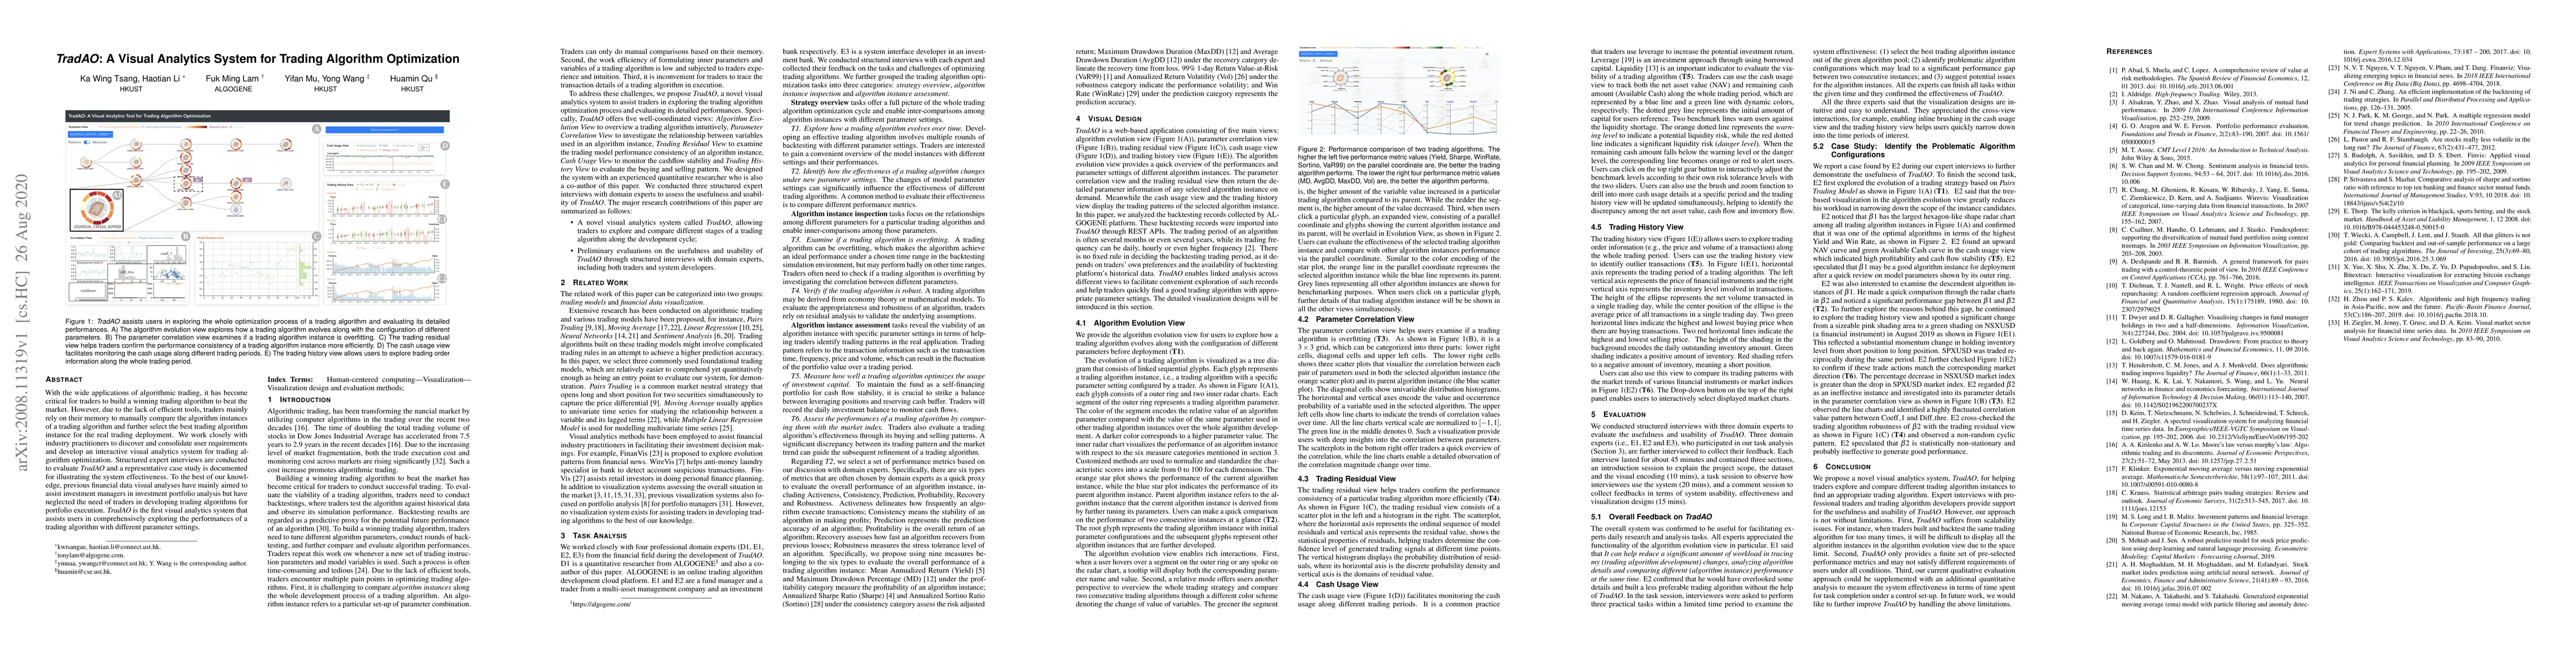
With the wide applications of algorithmic trading, it has become critical for traders to build a winning trading algorithm to beat the market. However, due to the lack of efficient tools, traders ma...
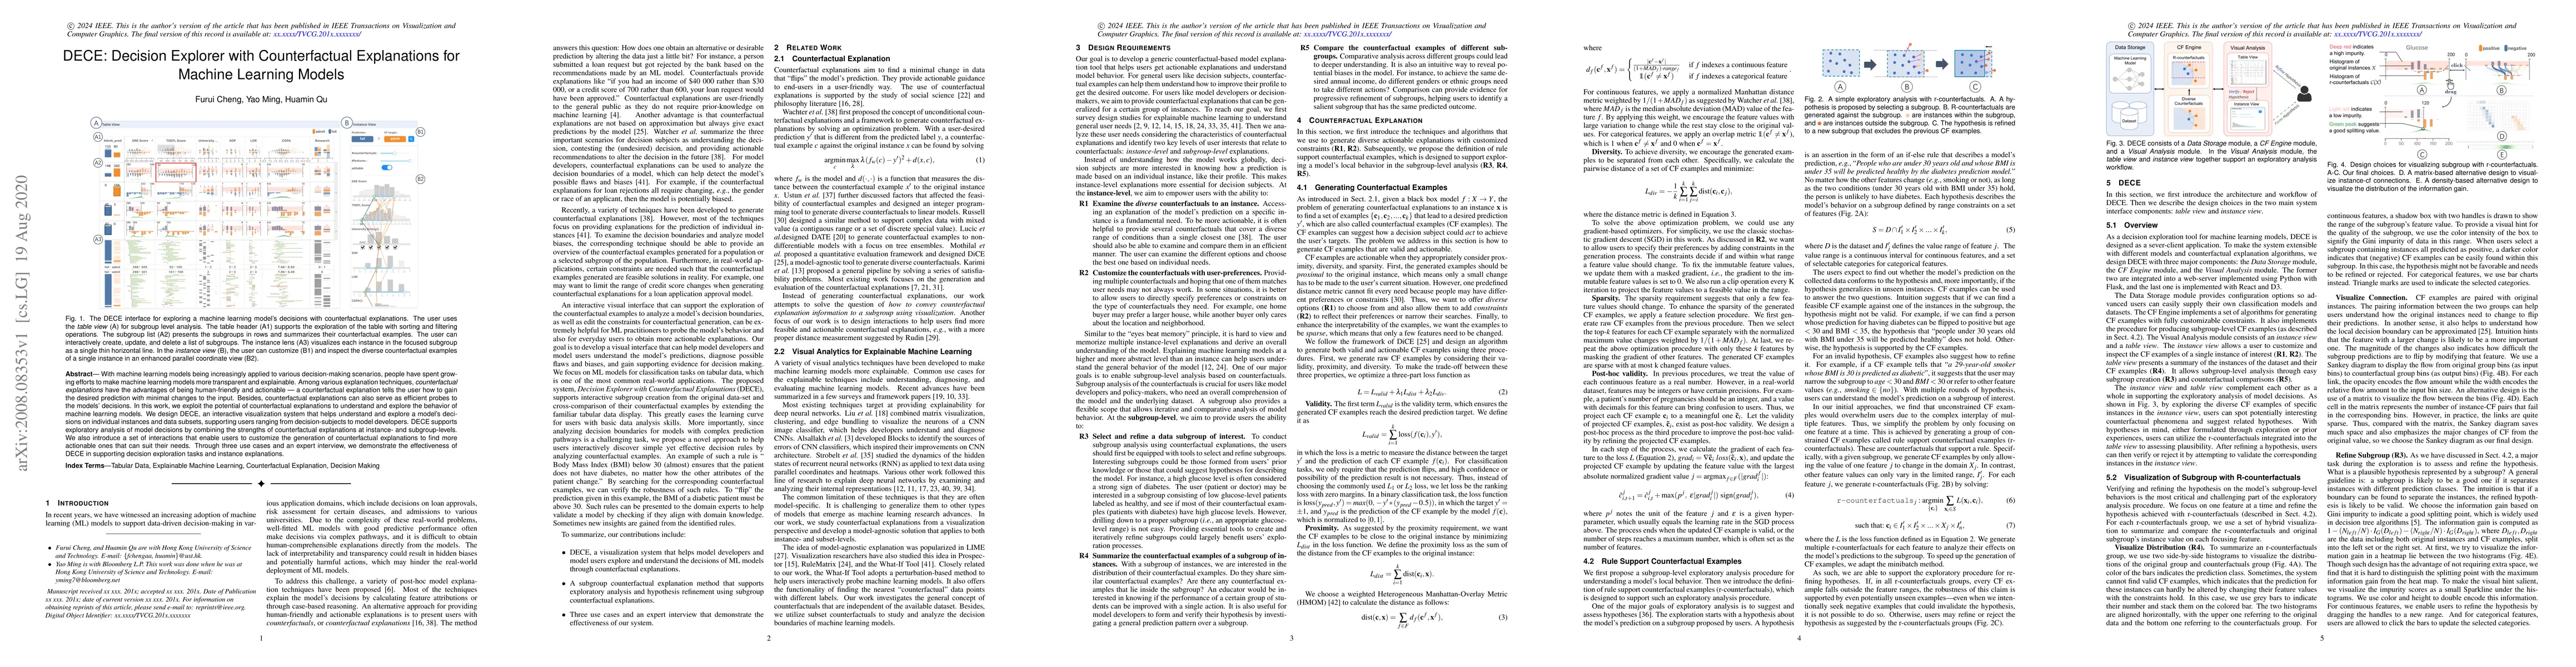
With machine learning models being increasingly applied to various decision-making scenarios, people have spent growing efforts to make machine learning models more transparent and explainable. Amon...
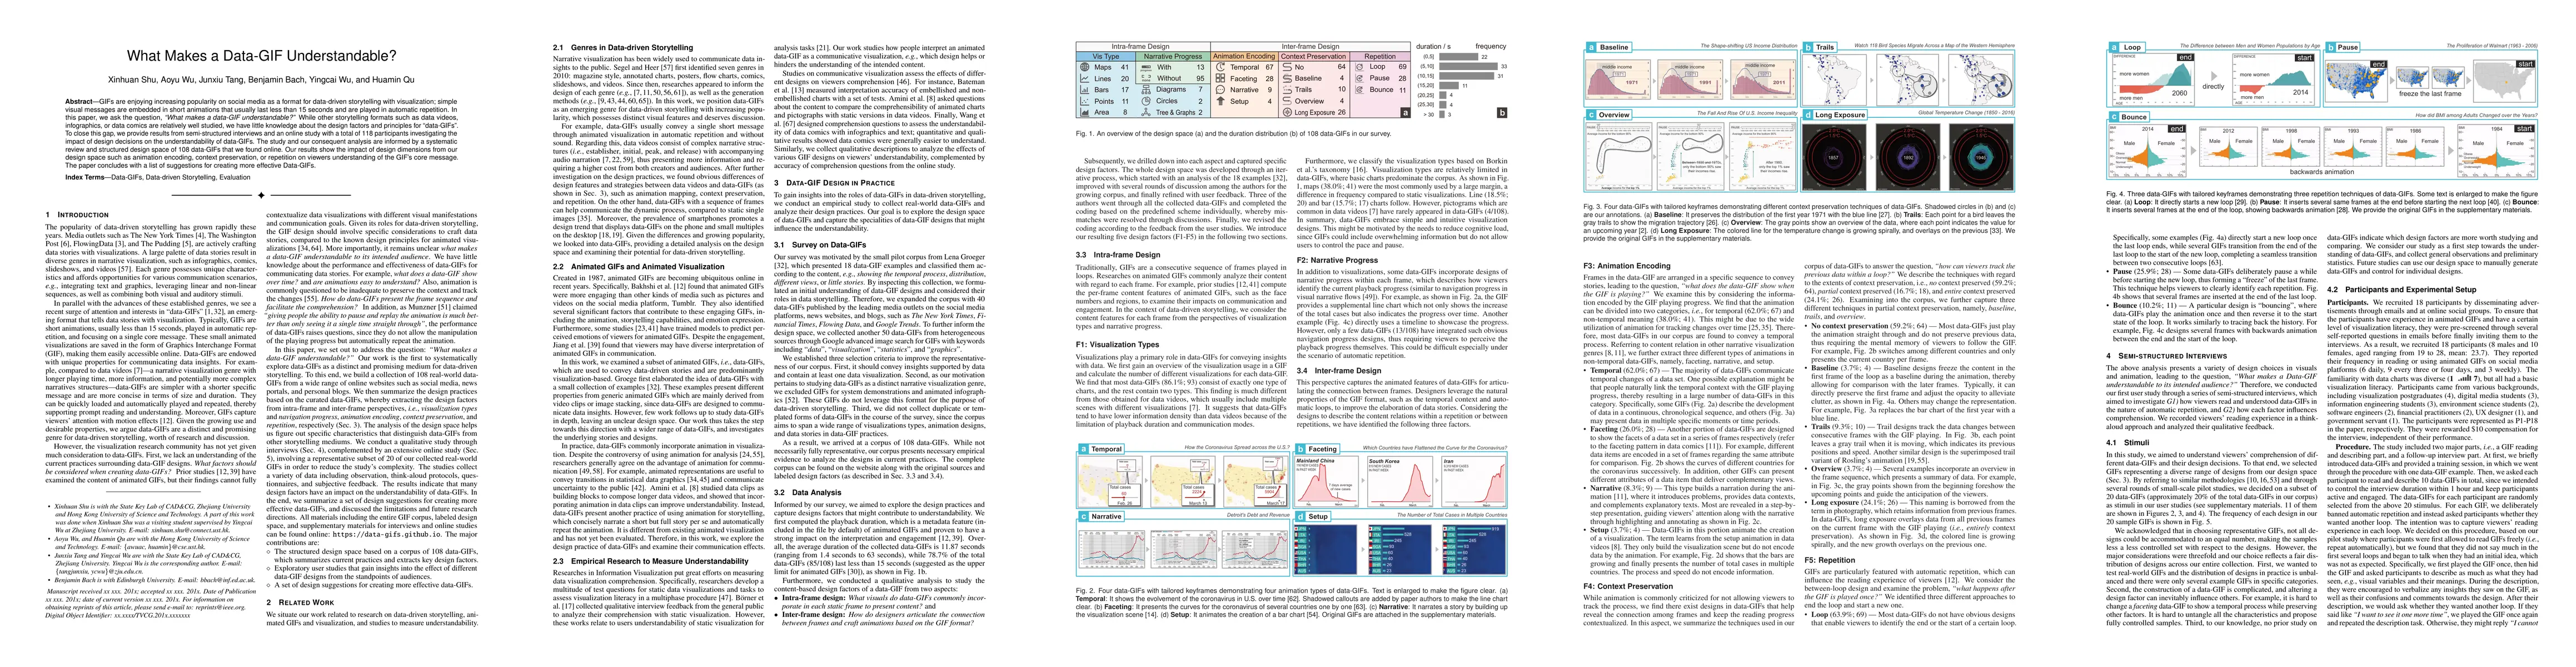
GIFs are enjoying increasing popularity on social media as a format for data-driven storytelling with visualization; simple visual messages are embedded in short animations that usually last less th...
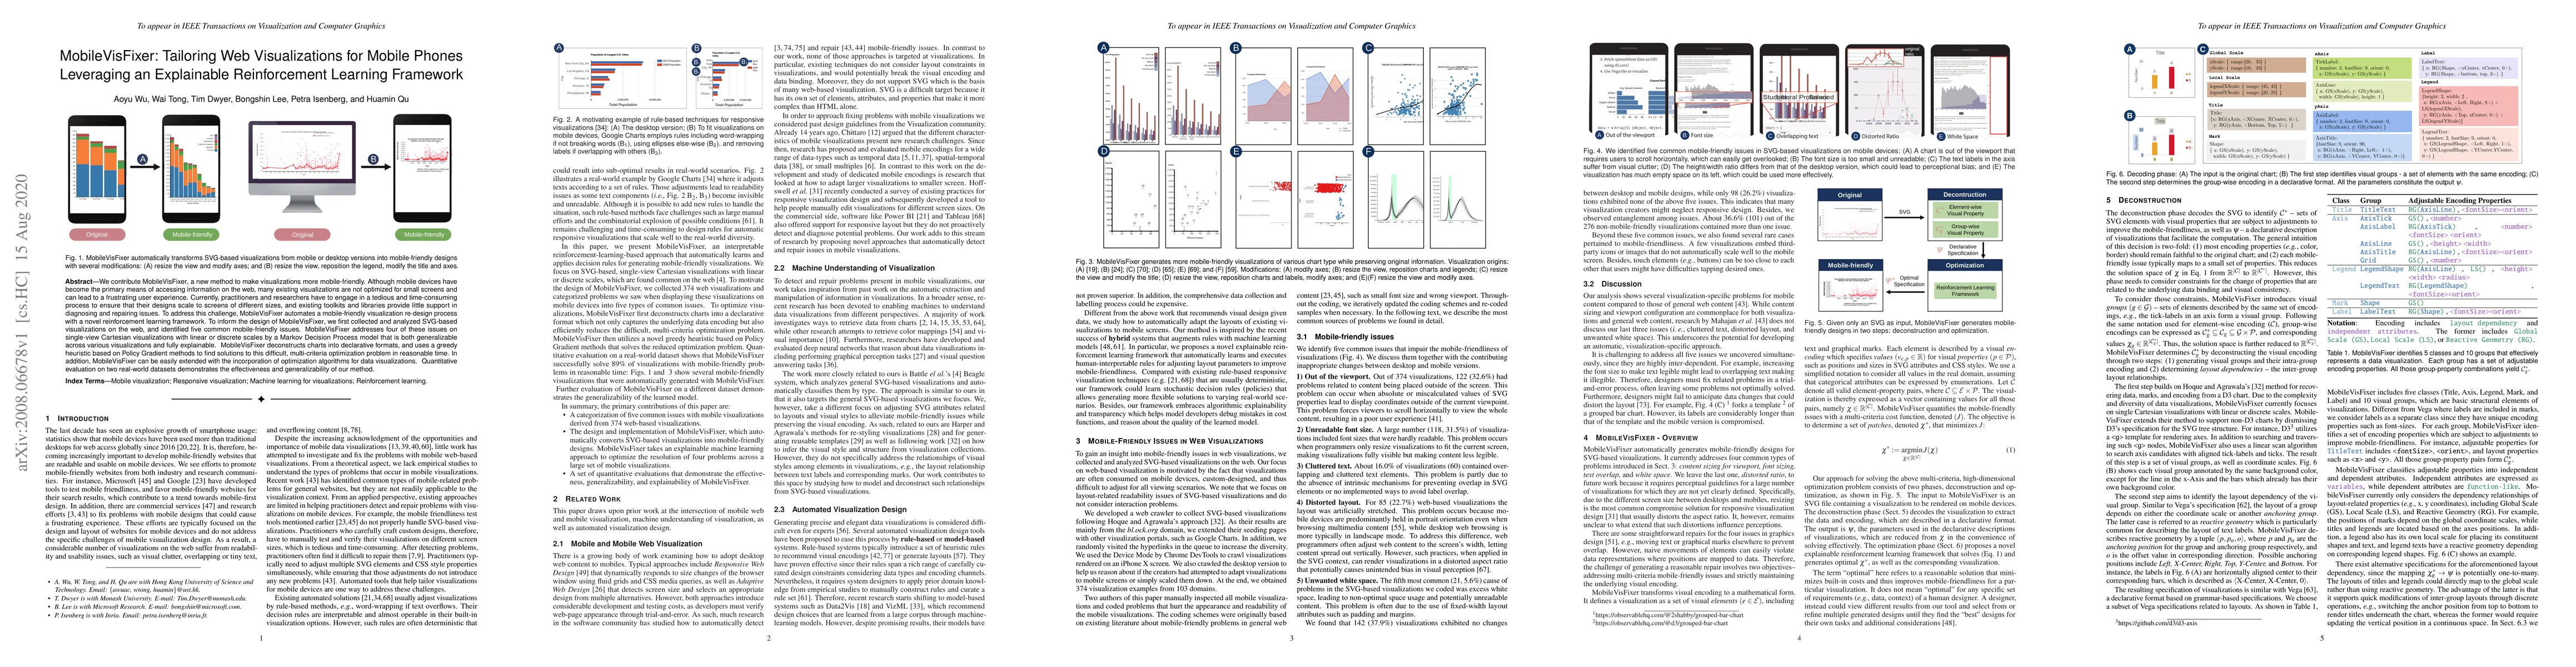
We contribute MobileVisFixer, a new method to make visualizations more mobile-friendly. Although mobile devices have become the primary means of accessing information on the web, many existing visua...
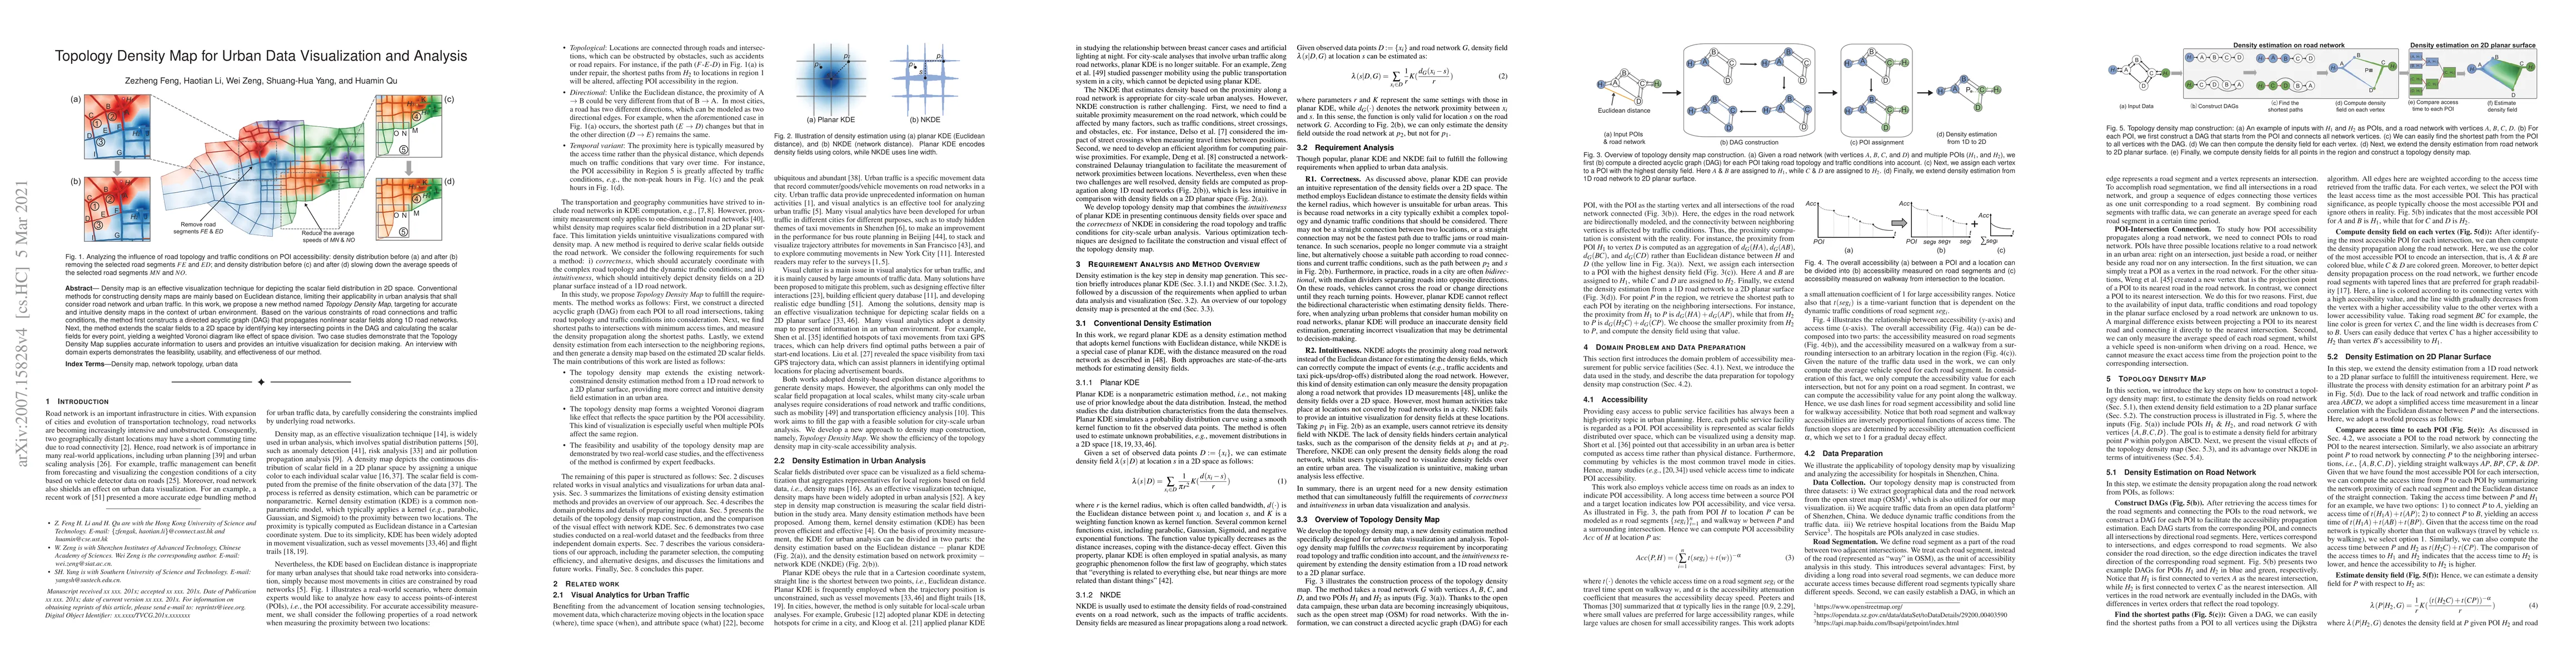
Density map is an effective visualization technique for depicting the scalar field distribution in 2D space. Conventional methods for constructing density maps are mainly based on Euclidean distance...
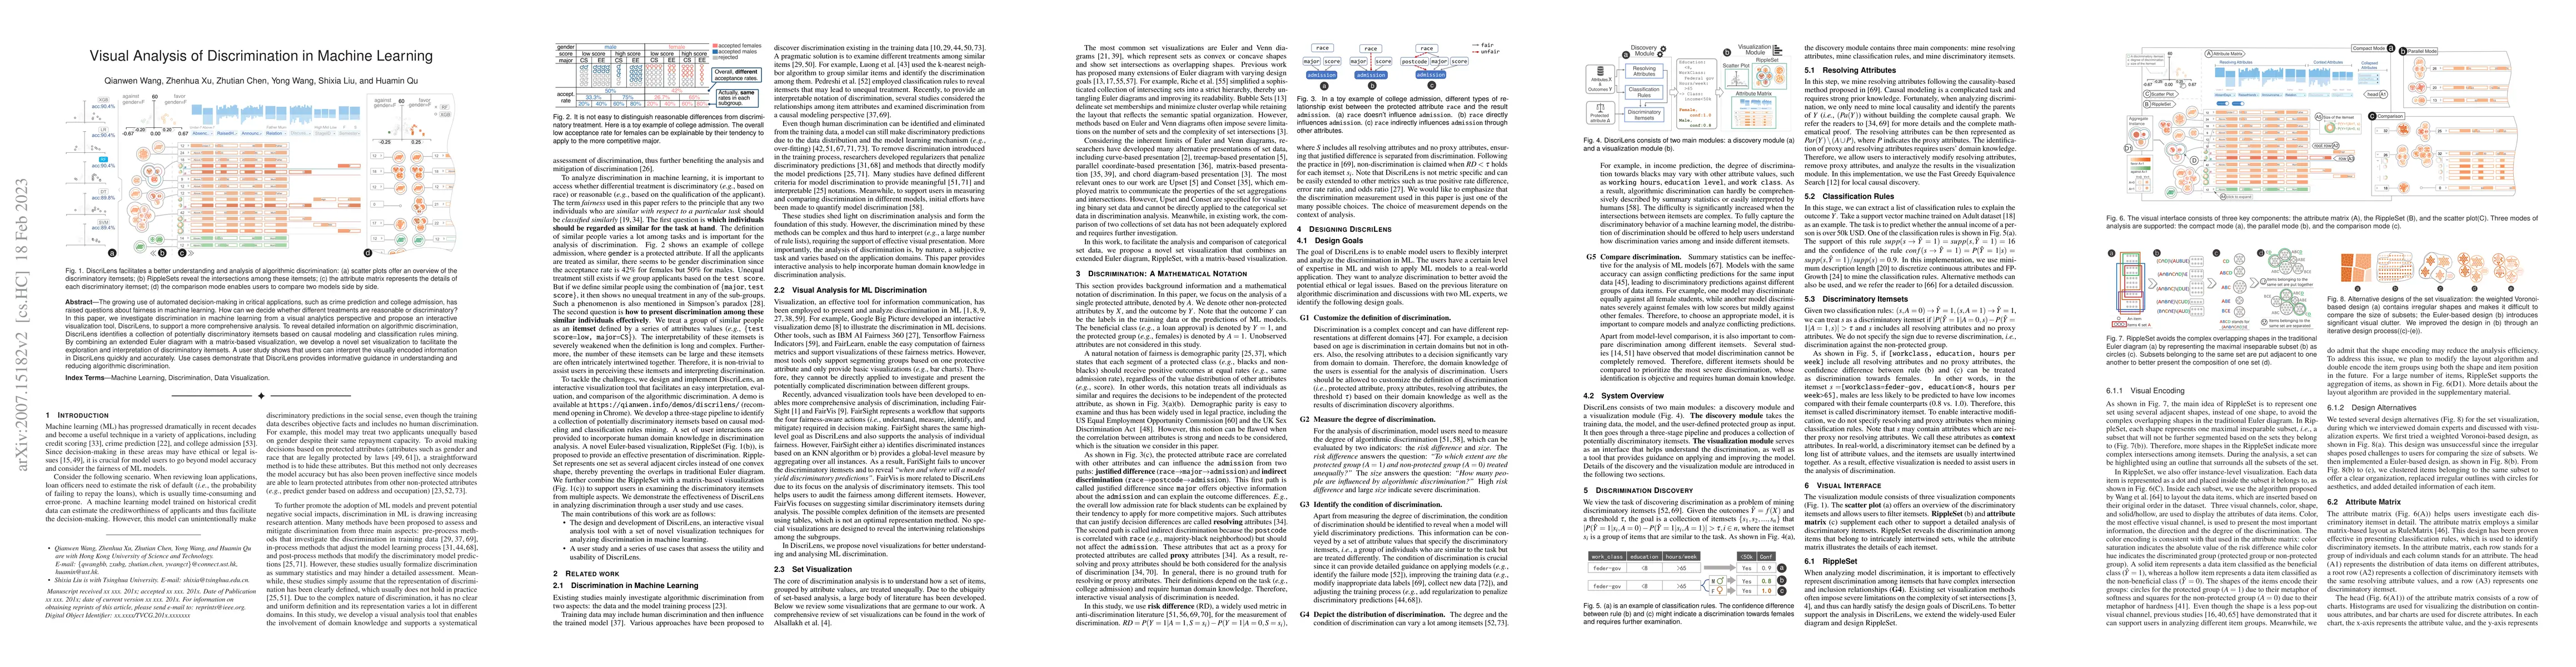
The growing use of automated decision-making in critical applications, such as crime prediction and college admission, has raised questions about fairness in machine learning. How can we decide whet...
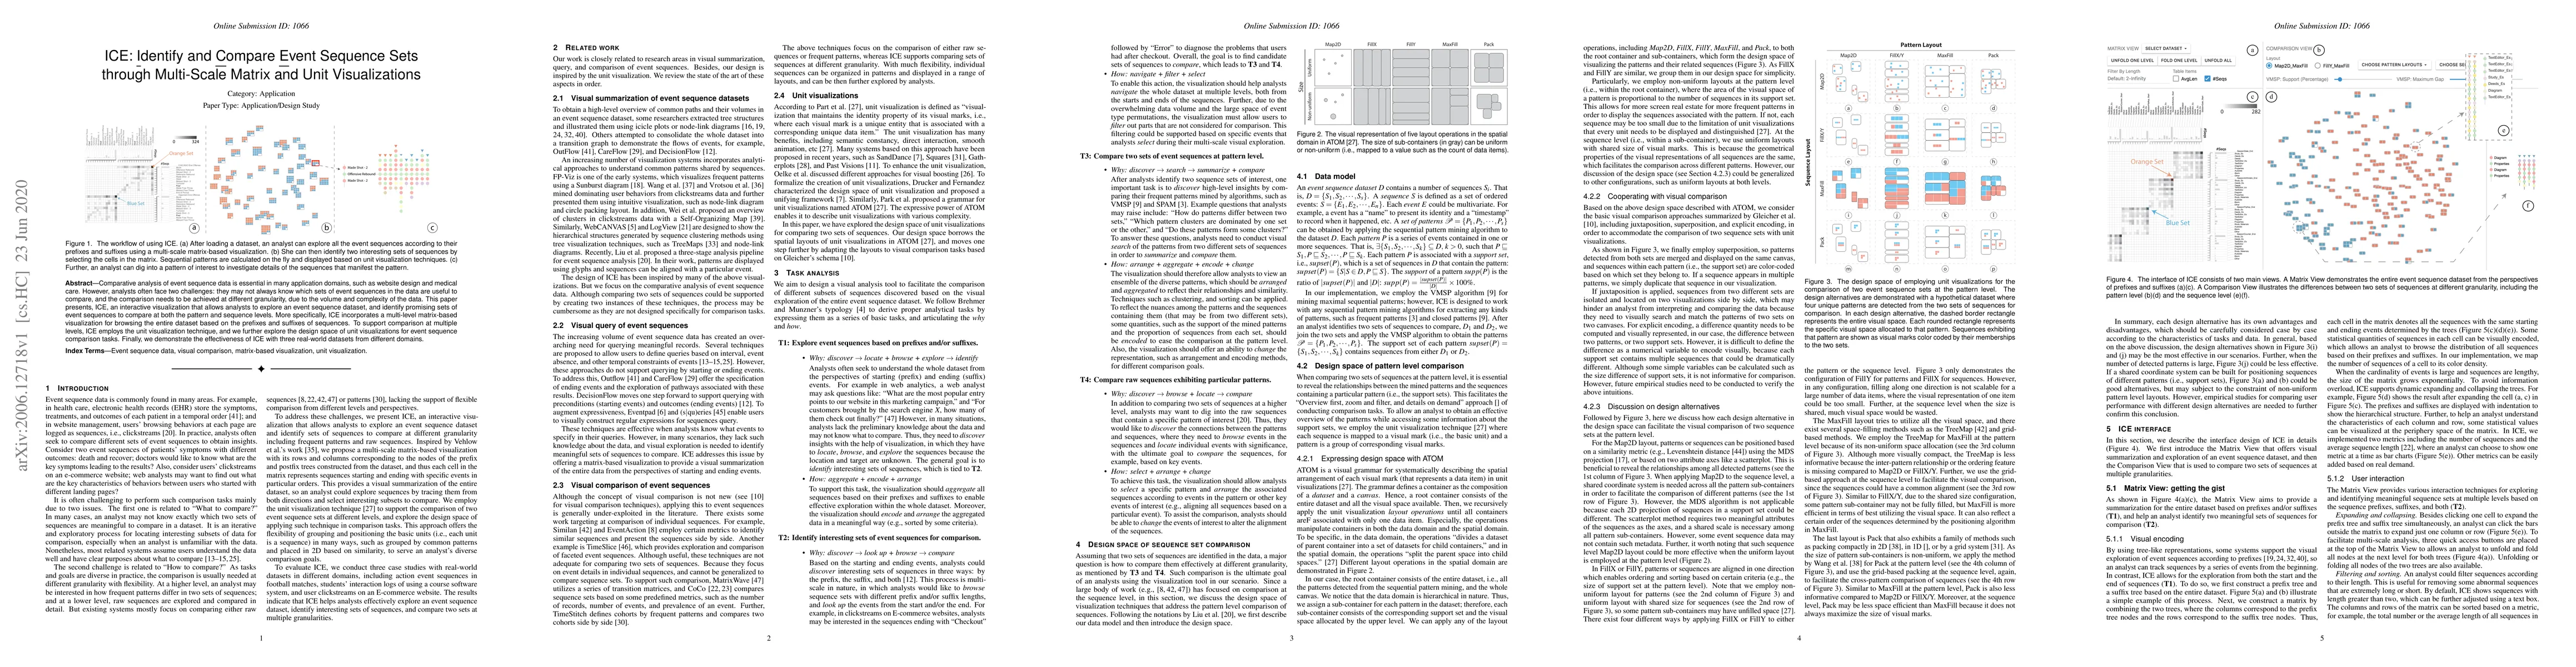
Comparative analysis of event sequence data is essential in many application domains, such as website design and medical care. However, analysts often face two challenges: they may not always know w...
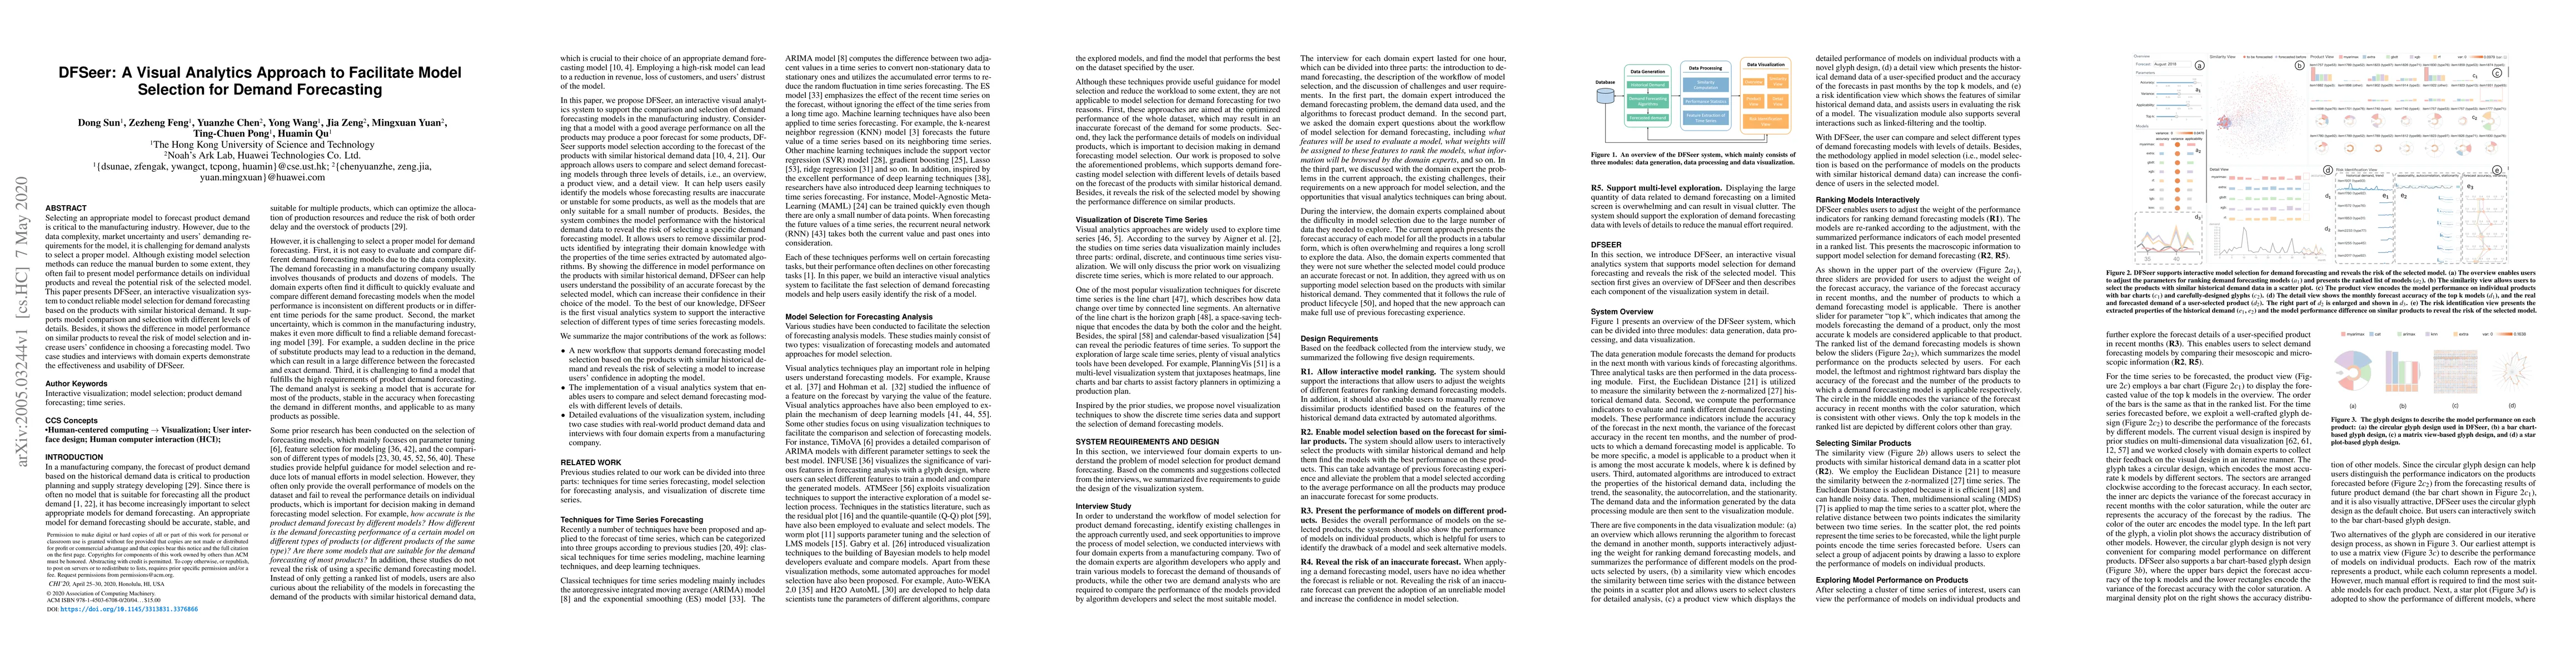
Selecting an appropriate model to forecast product demand is critical to the manufacturing industry. However, due to the data complexity, market uncertainty and users' demanding requirements for the...
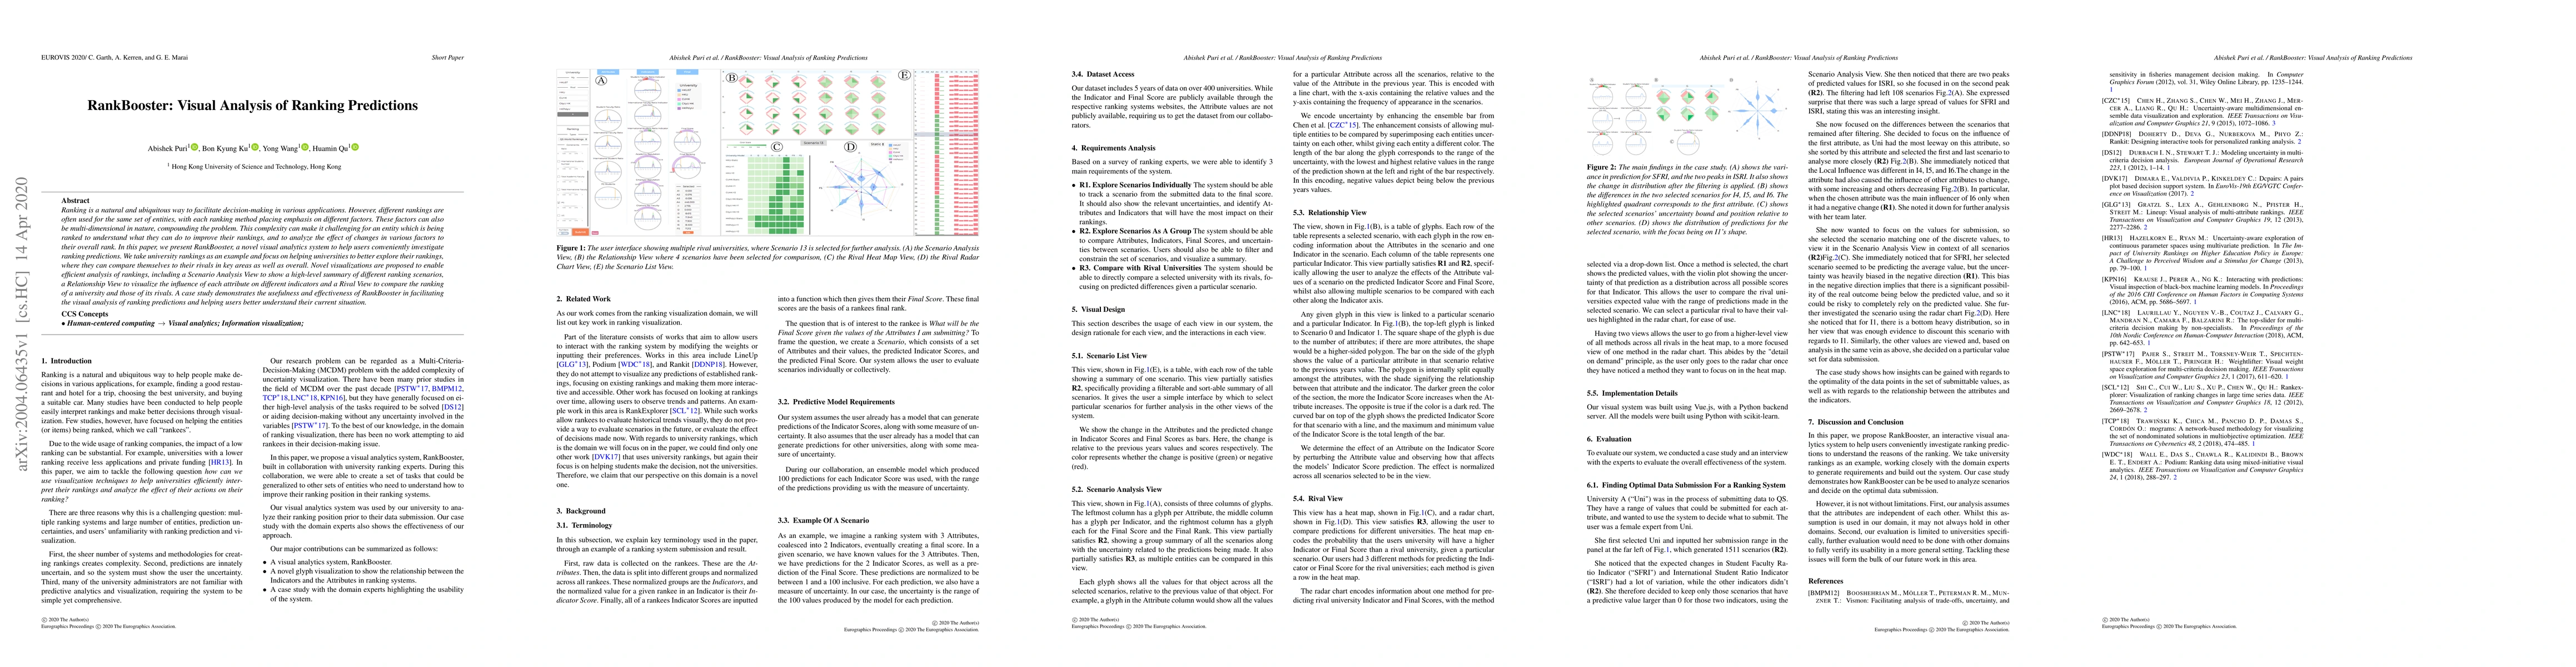
Ranking is a natural and ubiquitous way to facilitate decision-making in various applications. However, different rankings are often used for the same set of entities, with each ranking method placi...
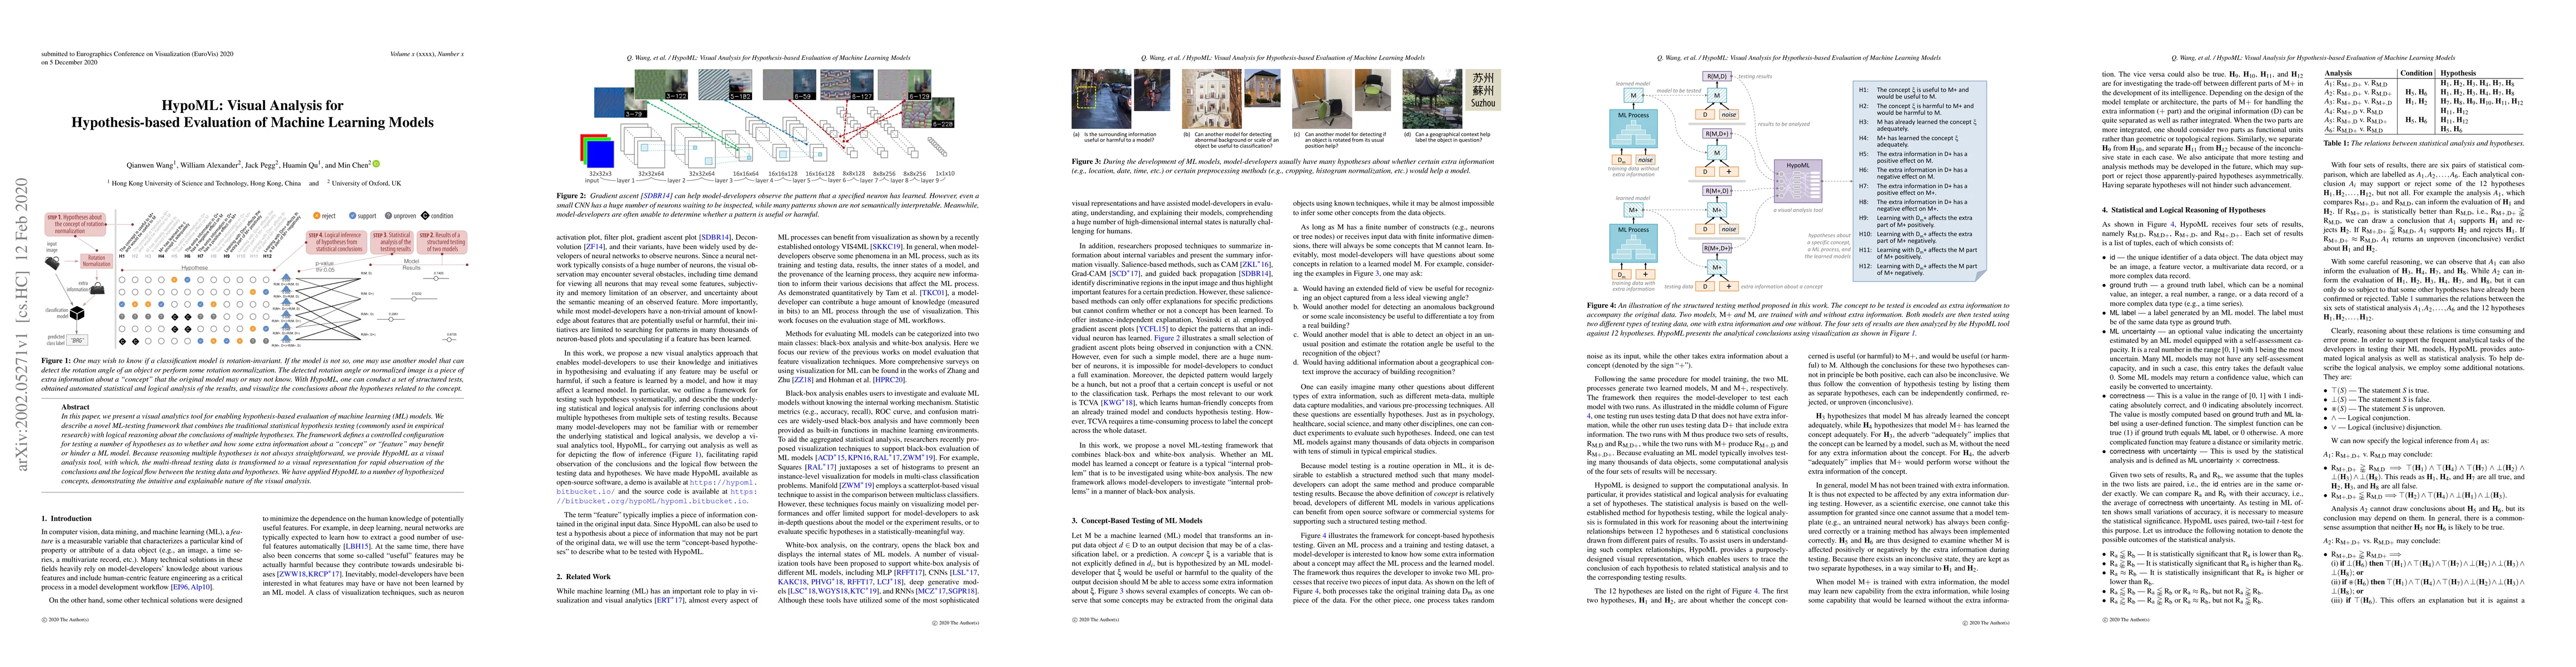
In this paper, we present a visual analytics tool for enabling hypothesis-based evaluation of machine learning (ML) models. We describe a novel ML-testing framework that combines the traditional sta...
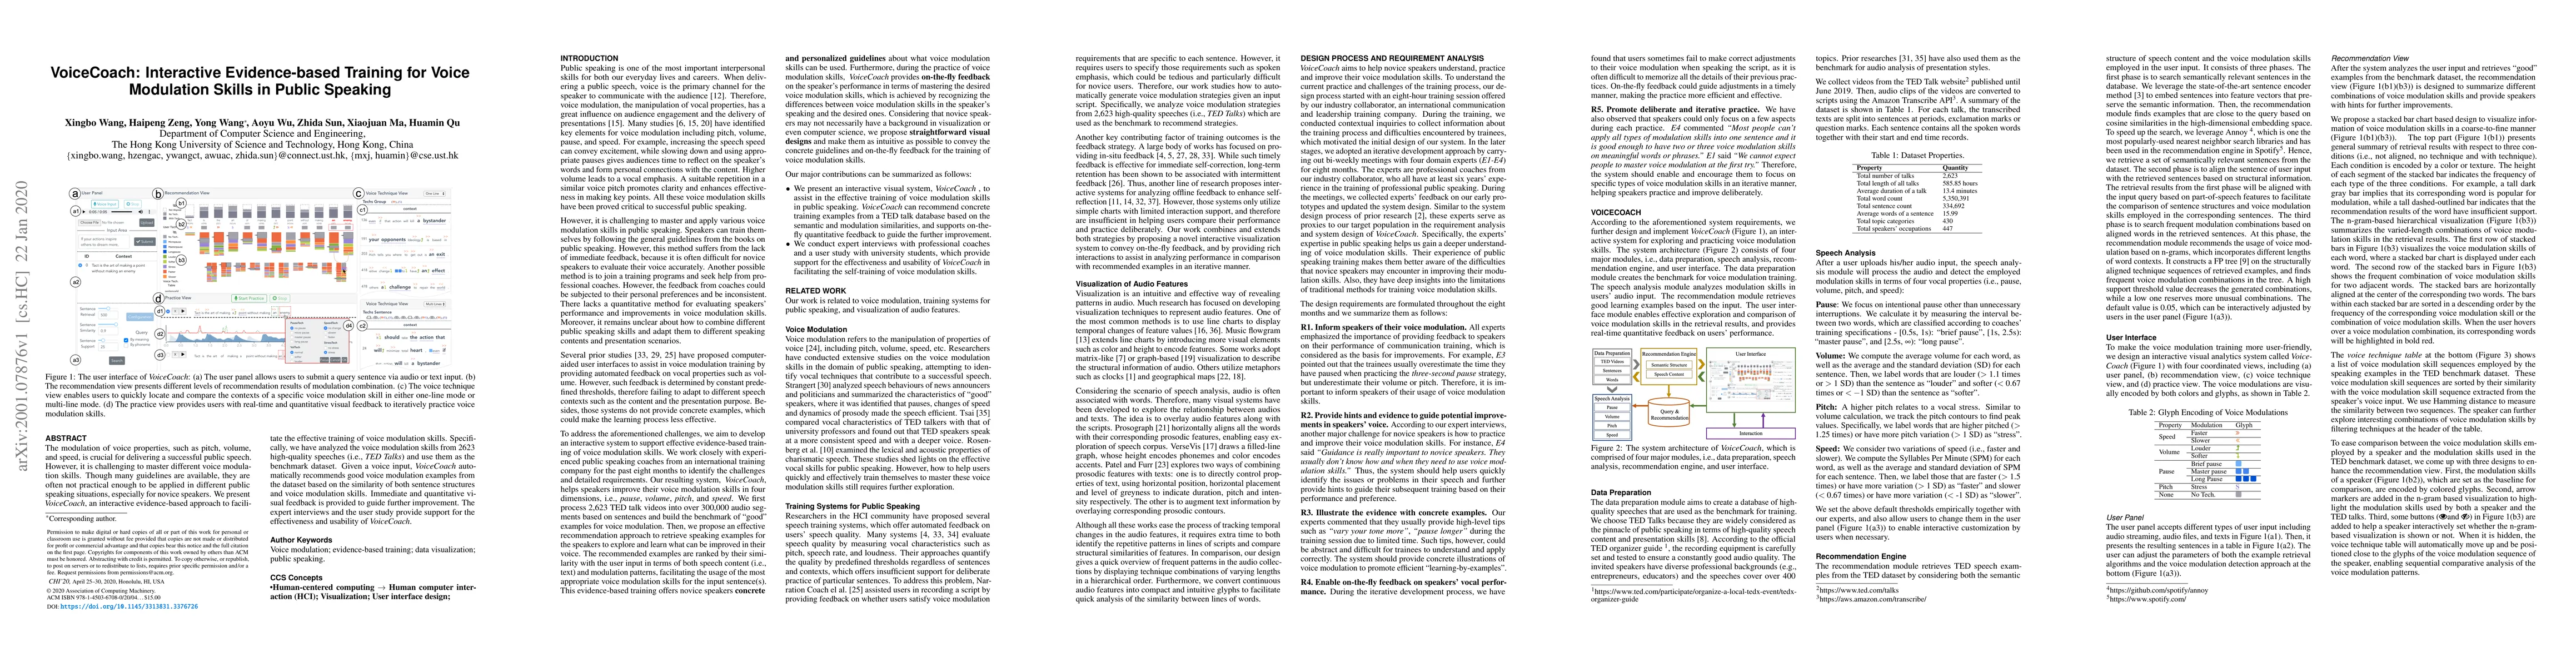
The modulation of voice properties, such as pitch, volume, and speed, is crucial for delivering a successful public speech. However, it is challenging to master different voice modulation skills. Th...
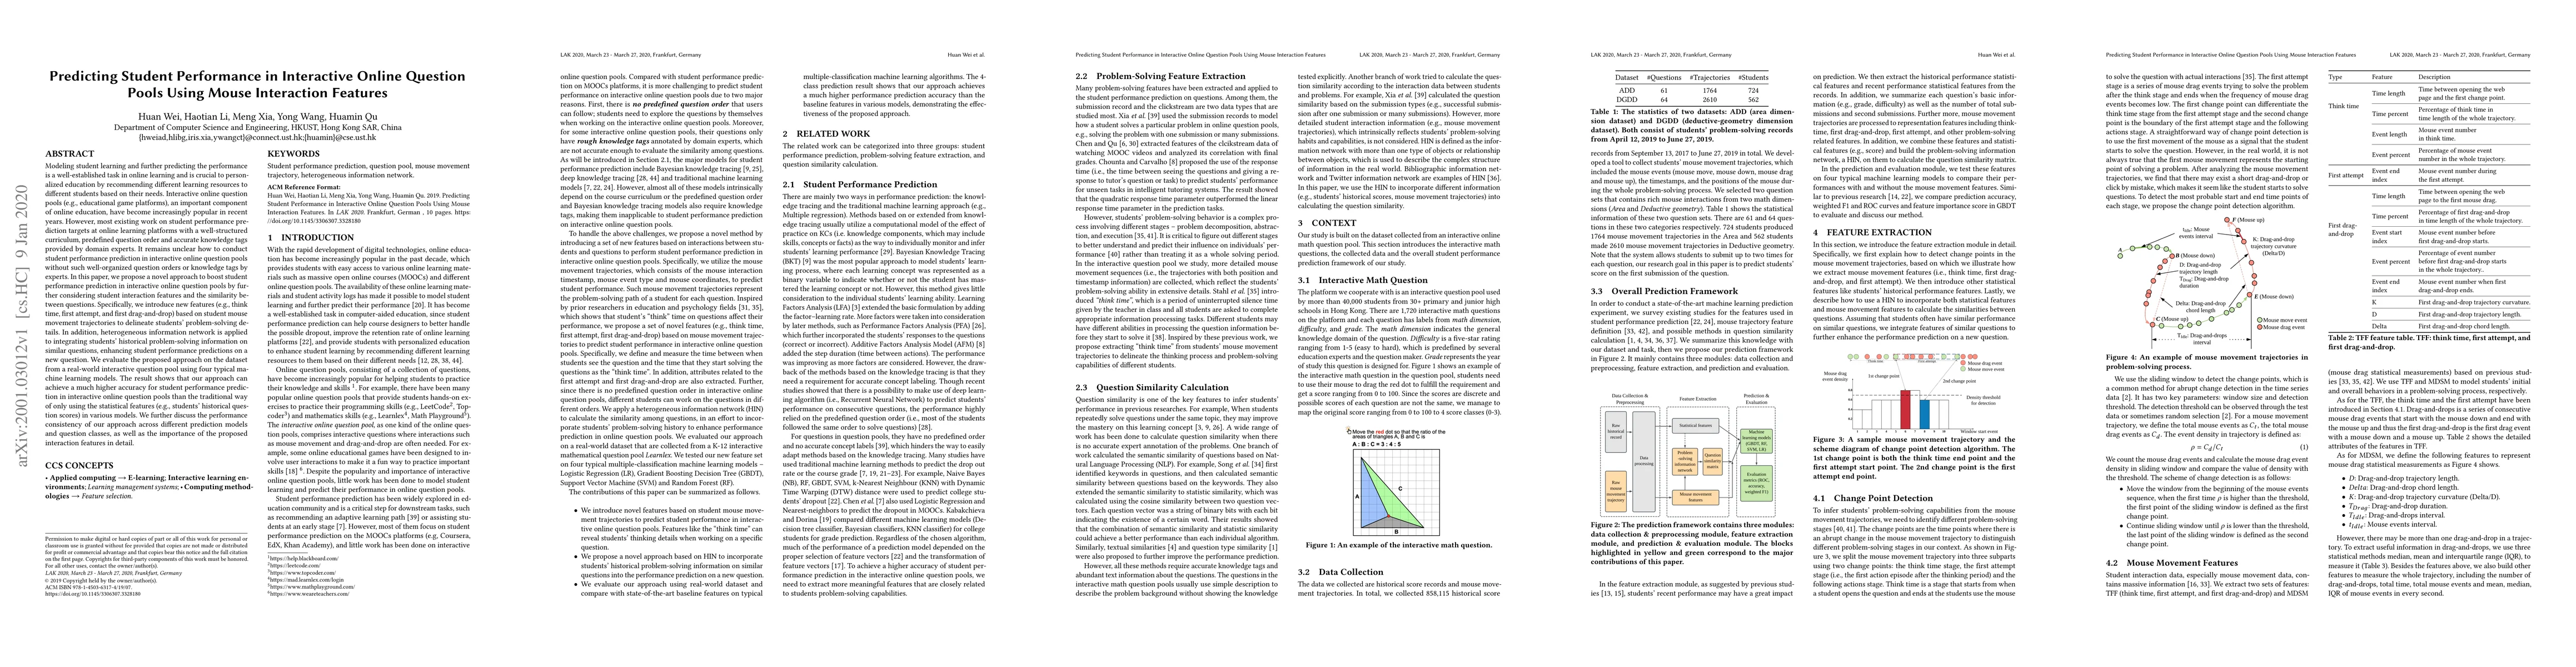
Modeling student learning and further predicting the performance is a well-established task in online learning and is crucial to personalized education by recommending different learning resources t...
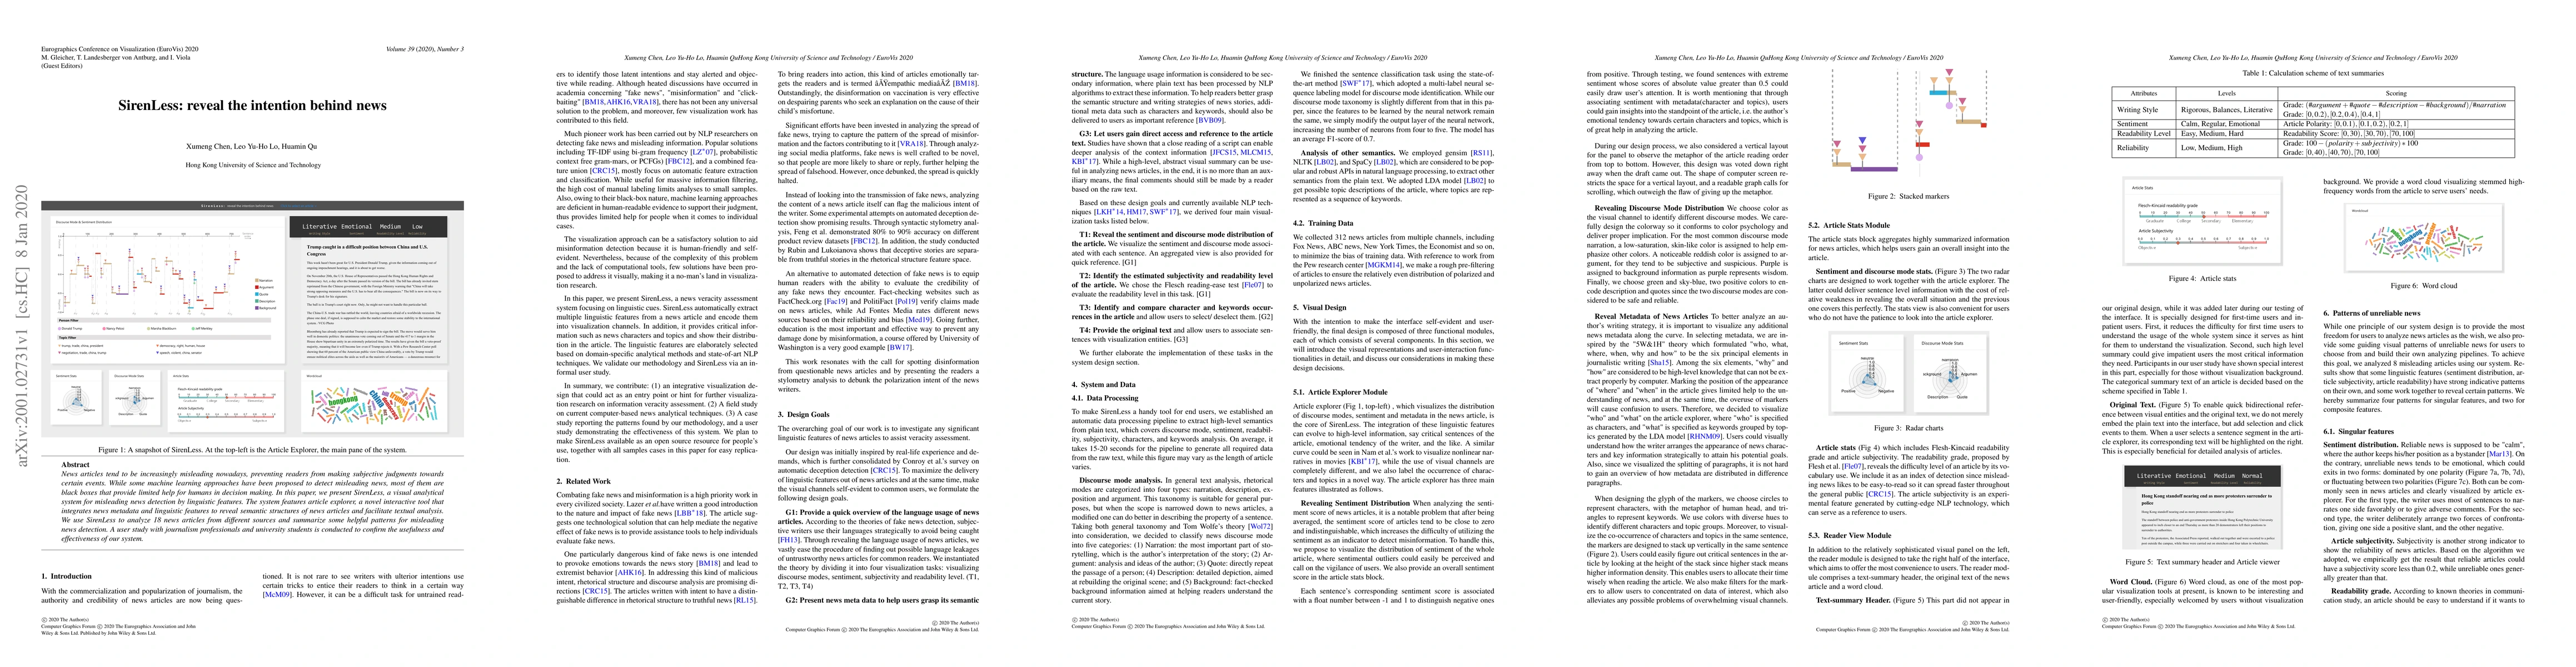
News articles tend to be increasingly misleading nowadays, preventing readers from making subjective judgments towards certain events. While some machine learning approaches have been proposed to de...
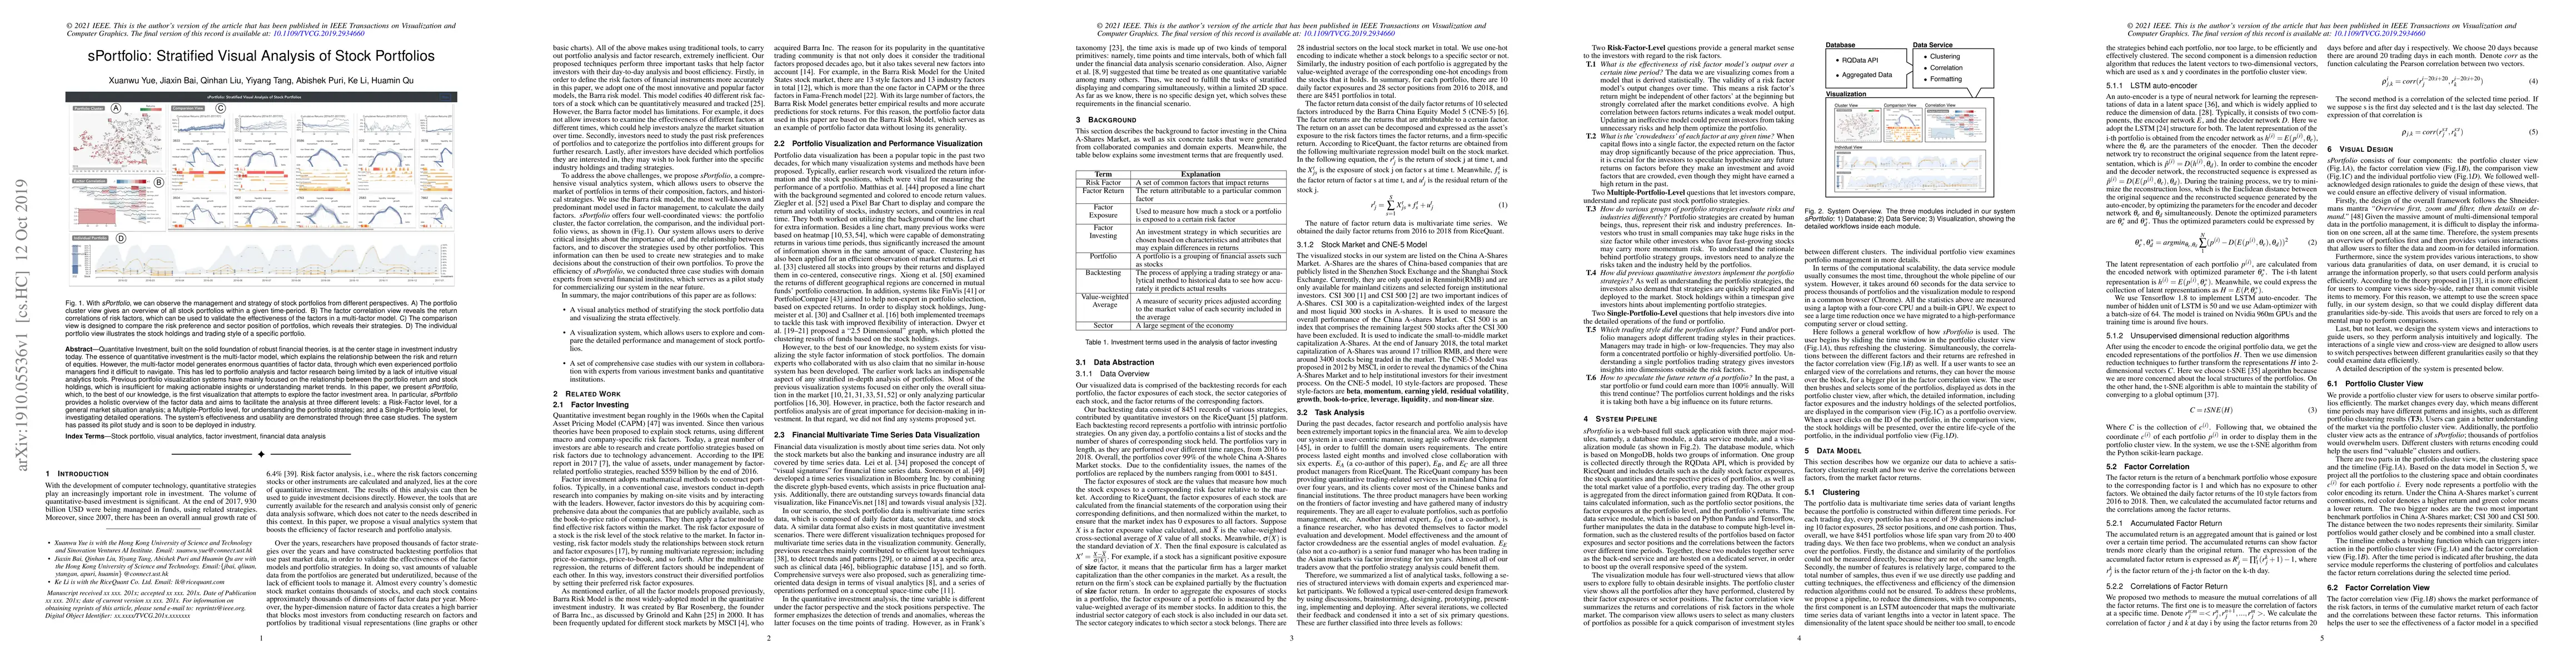
Quantitative Investment, built on the solid foundation of robust financial theories, is at the center stage in investment industry today. The essence of quantitative investment is the multi-factor m...
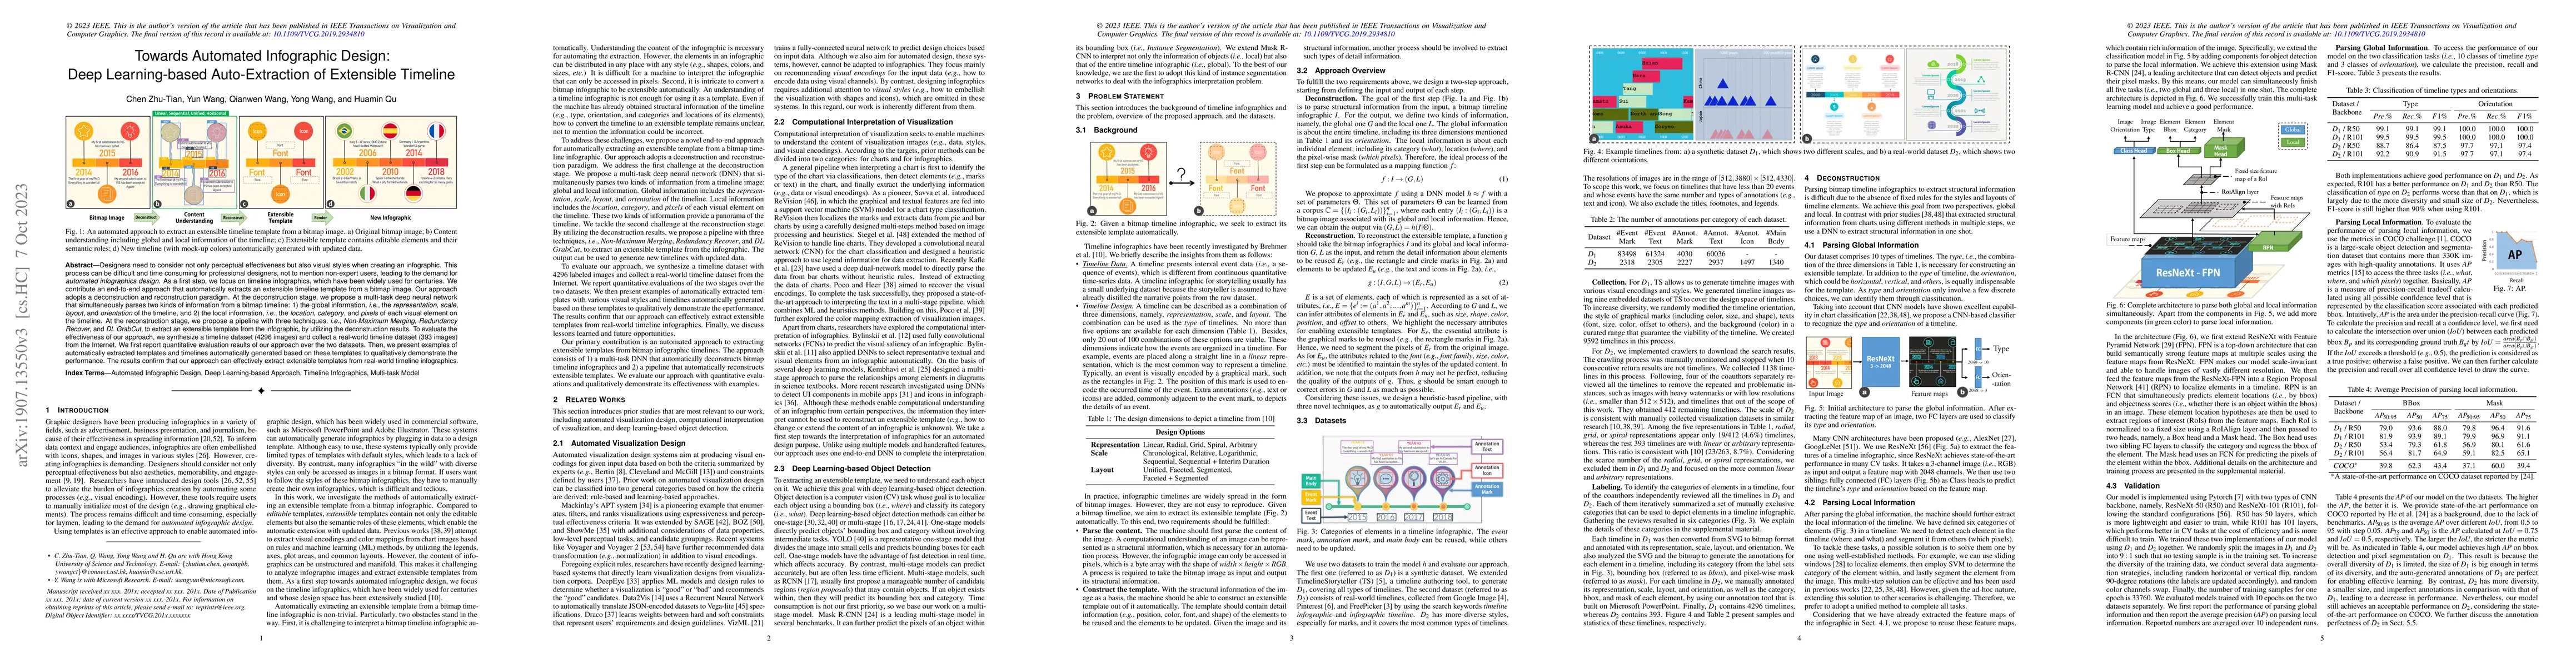
Designers need to consider not only perceptual effectiveness but also visual styles when creating an infographic. This process can be difficult and time consuming for professional designers, not to ...
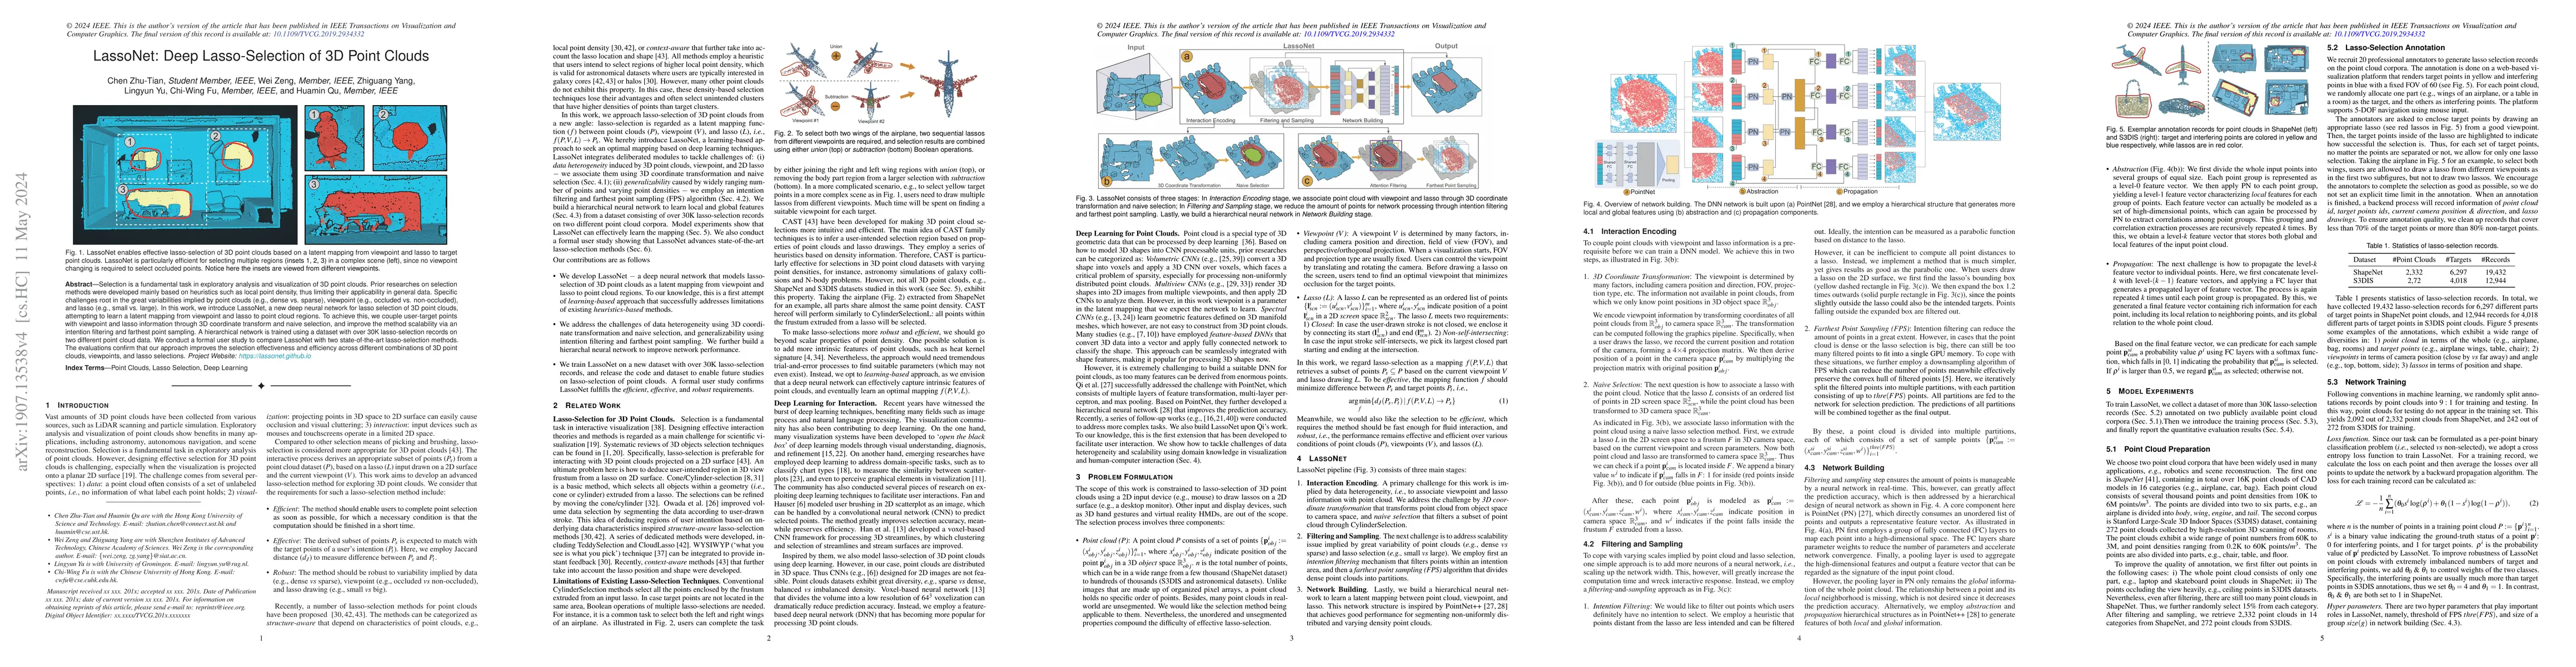
Selection is a fundamental task in exploratory analysis and visualization of 3D point clouds. Prior researches on selection methods were developed mainly based on heuristics such as local point dens...
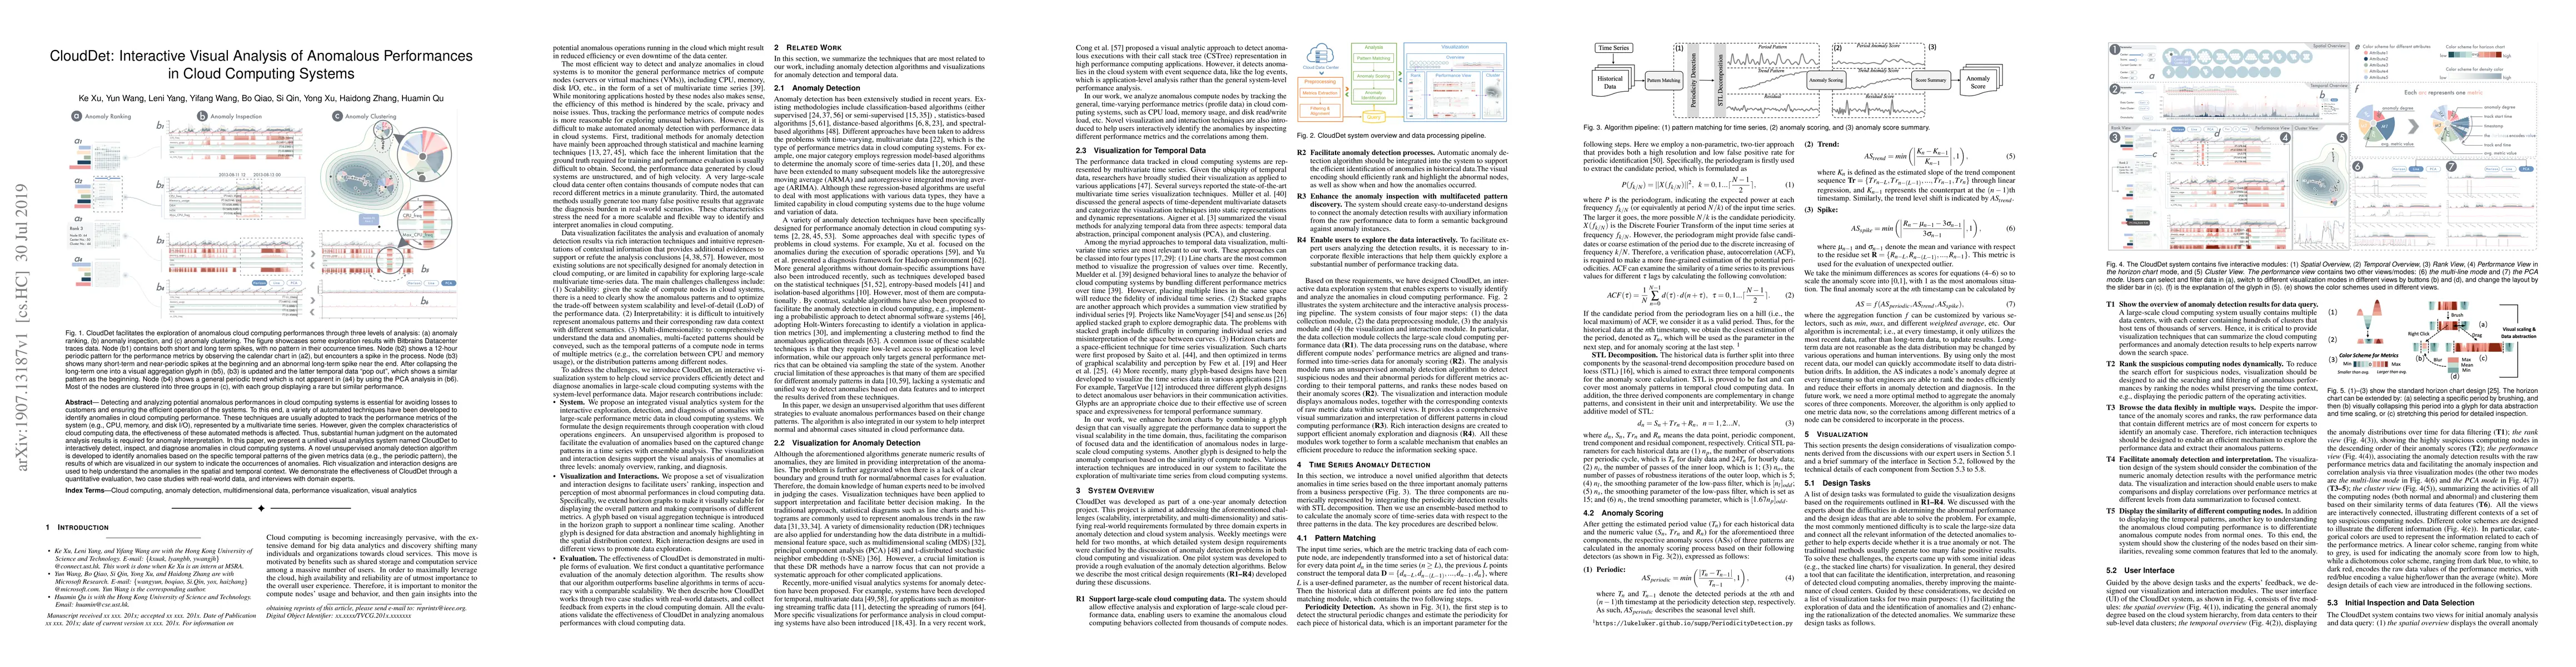
Detecting and analyzing potential anomalous performances in cloud computing systems is essential for avoiding losses to customers and ensuring the efficient operation of the systems. To this end, a ...
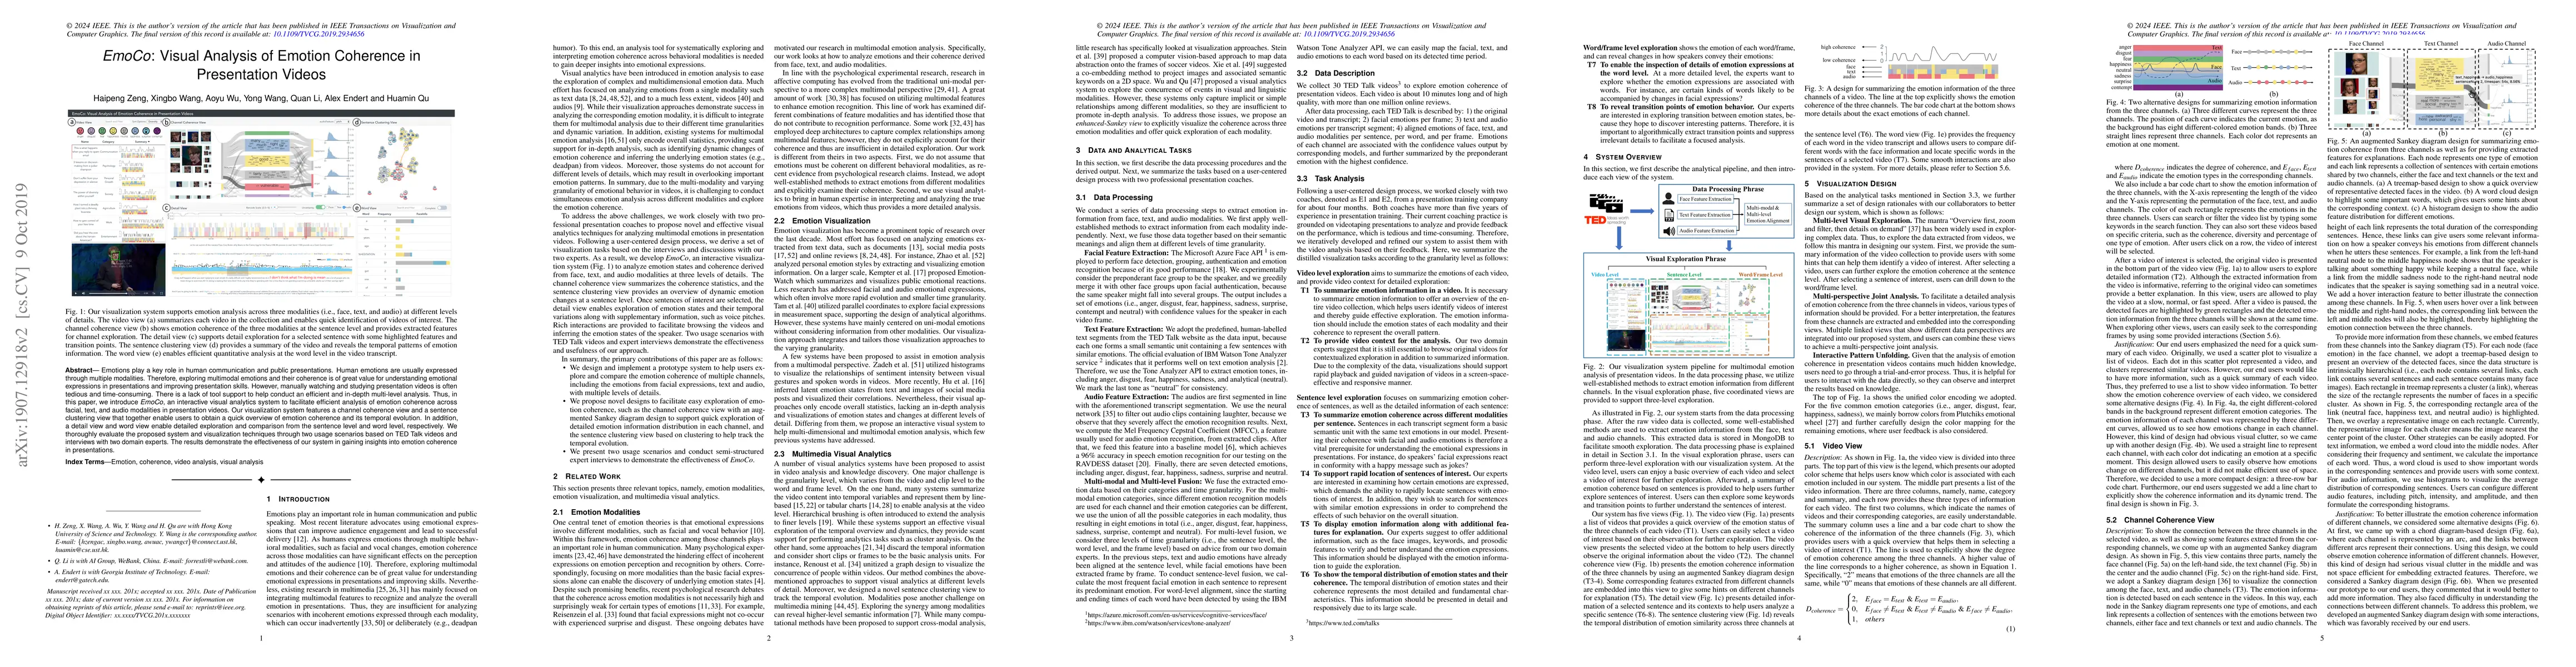
Emotions play a key role in human communication and public presentations. Human emotions are usually expressed through multiple modalities. Therefore, exploring multimodal emotions and their coheren...
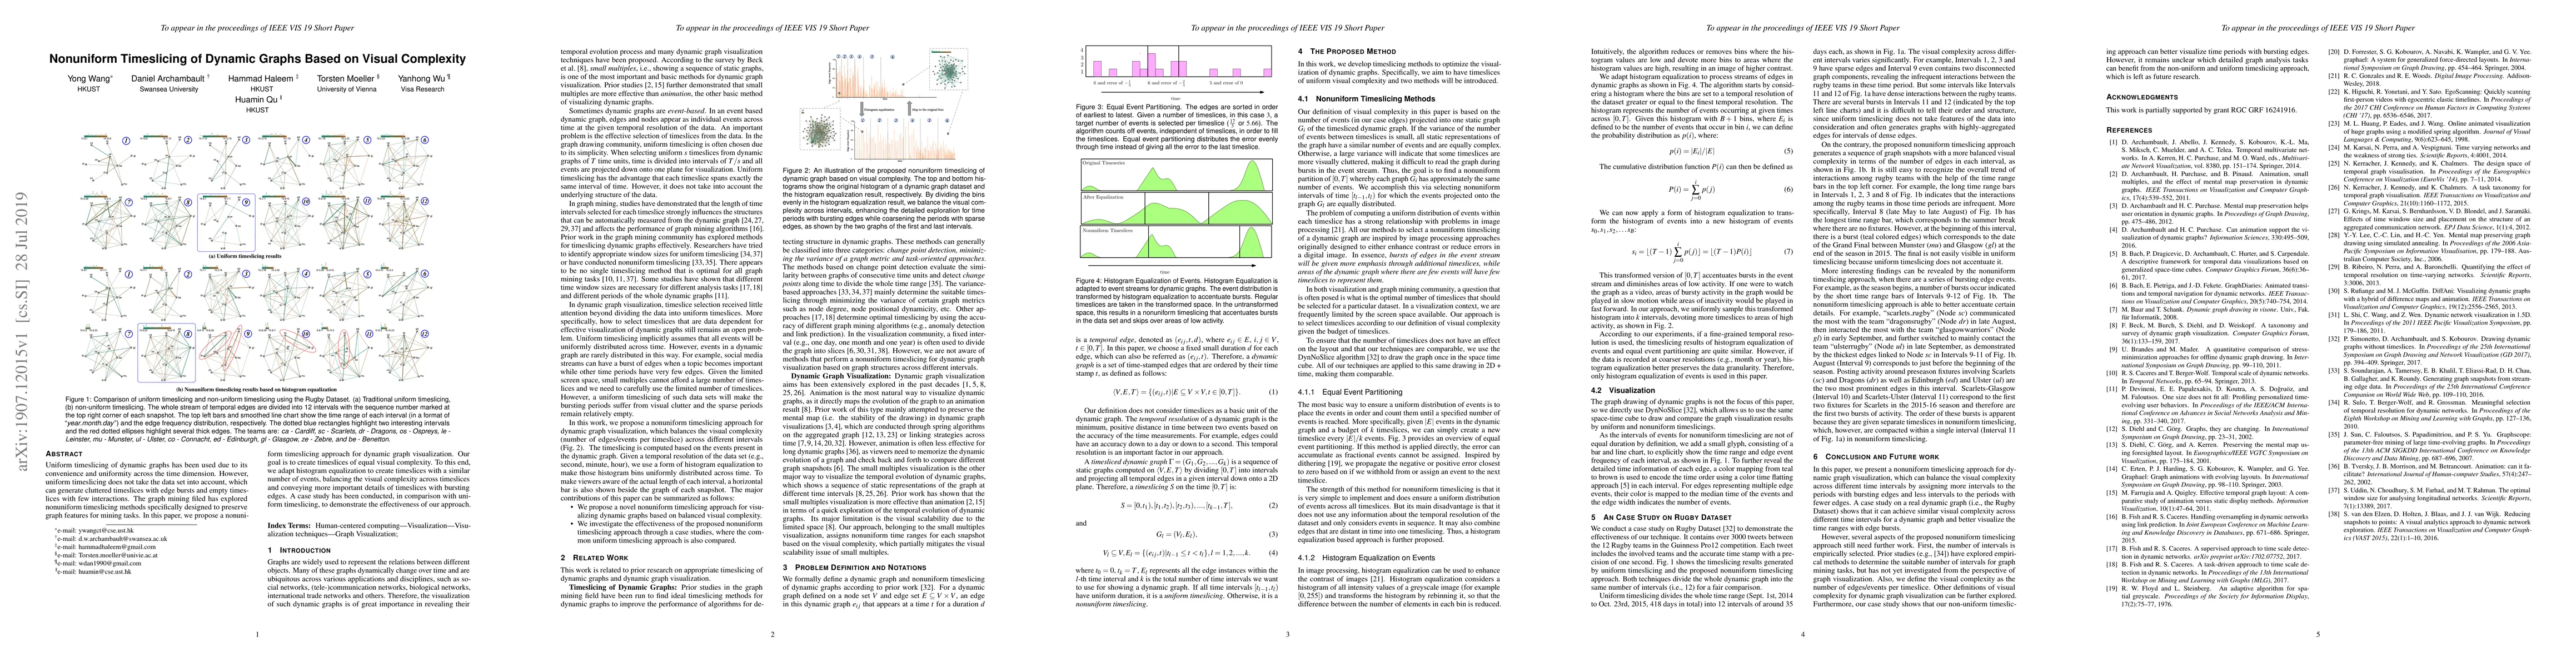
Uniform timeslicing of dynamic graphs has been used due to its convenience and uniformity across the time dimension. However, uniform timeslicing does not take the data set into account, which can g...
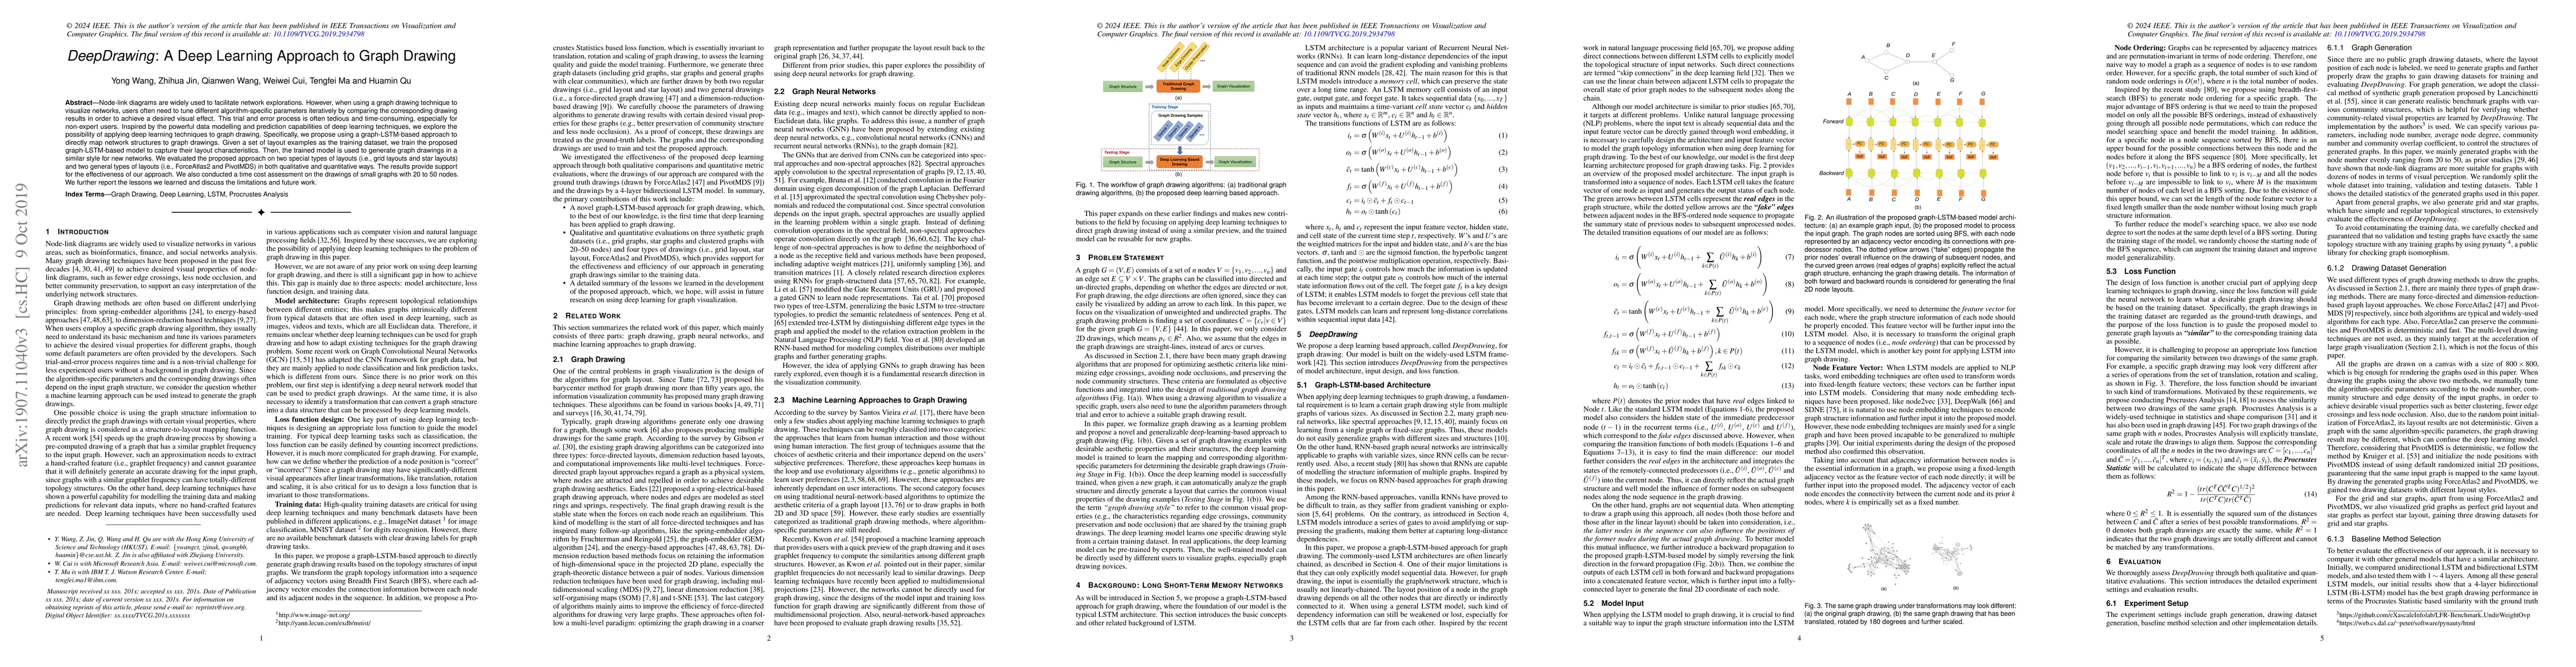
Node-link diagrams are widely used to facilitate network explorations. However, when using a graph drawing technique to visualize networks, users often need to tune different algorithm-specific para...
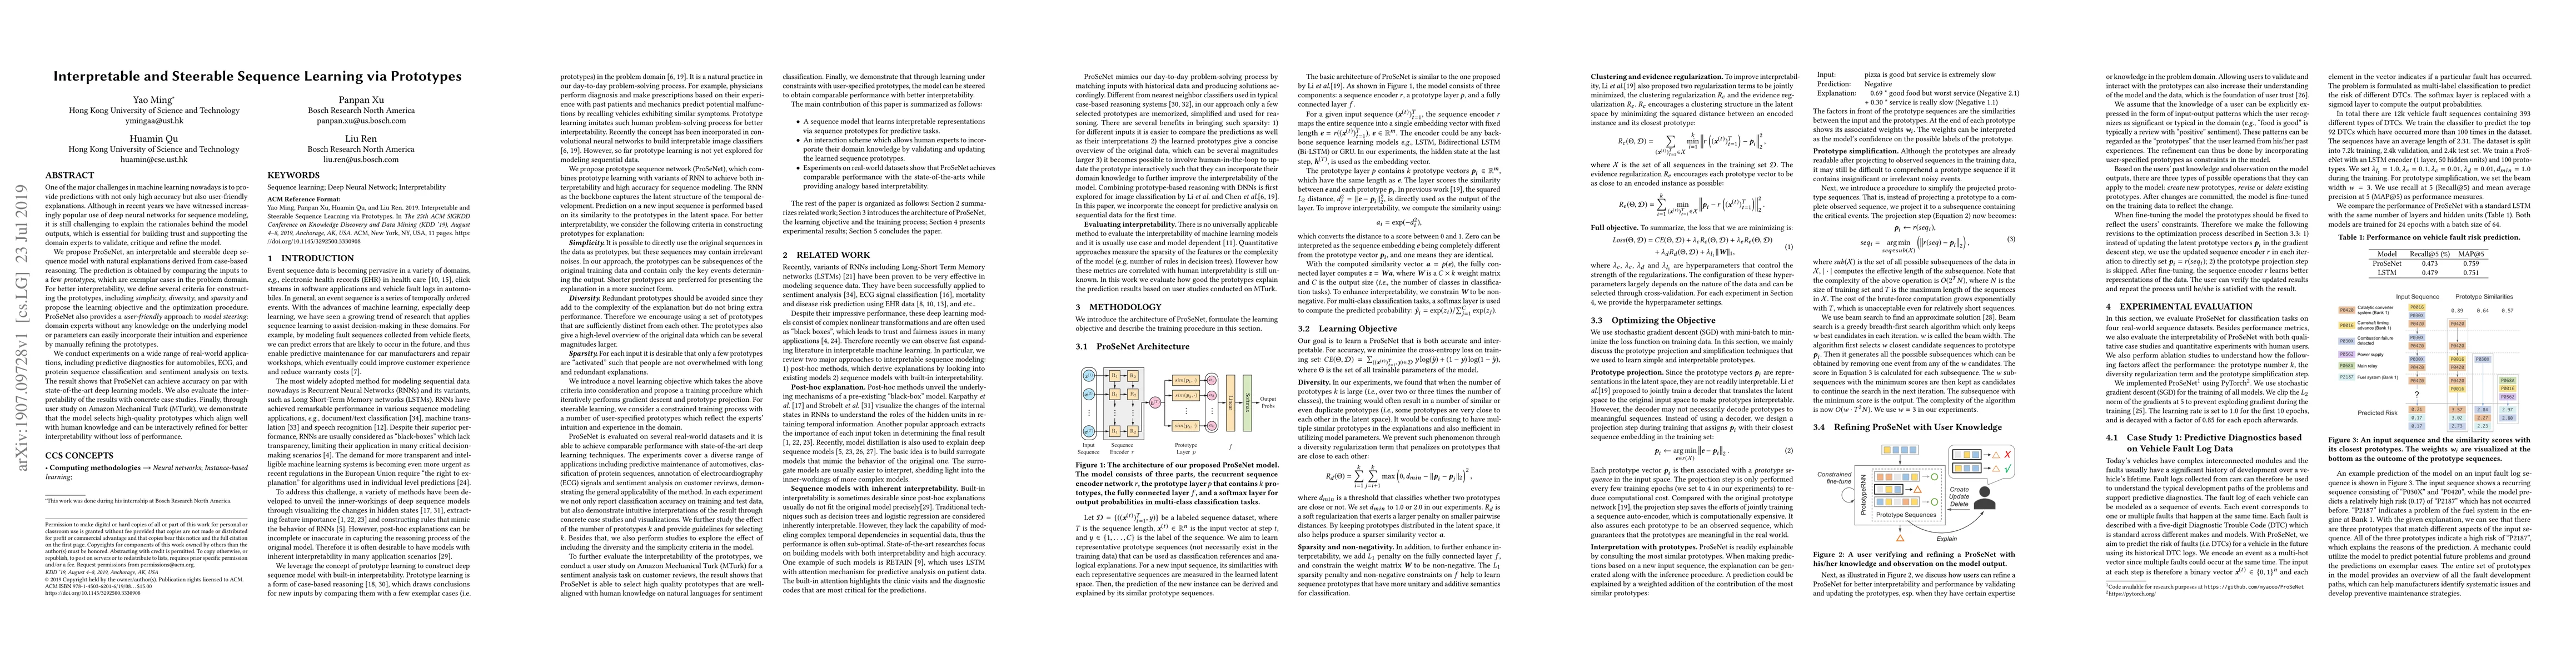
One of the major challenges in machine learning nowadays is to provide predictions with not only high accuracy but also user-friendly explanations. Although in recent years we have witnessed increas...
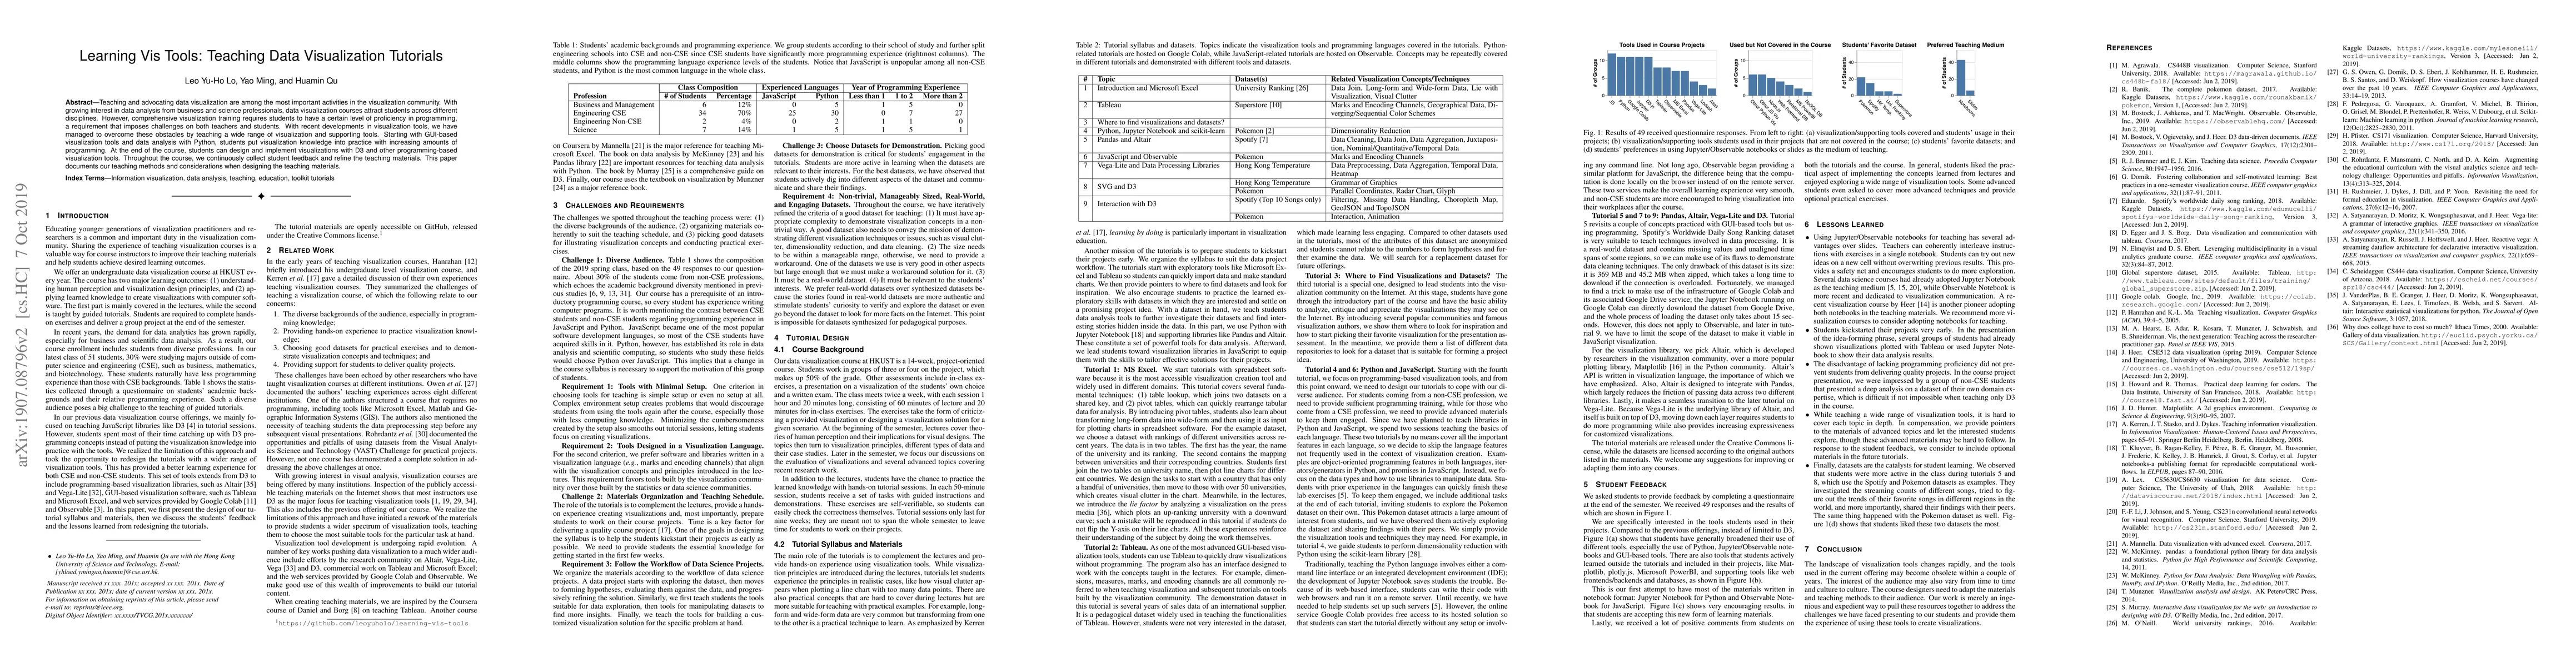
Teaching and advocating data visualization are among the most important activities in the visualization community. With growing interest in data analysis from business and science professionals, dat...
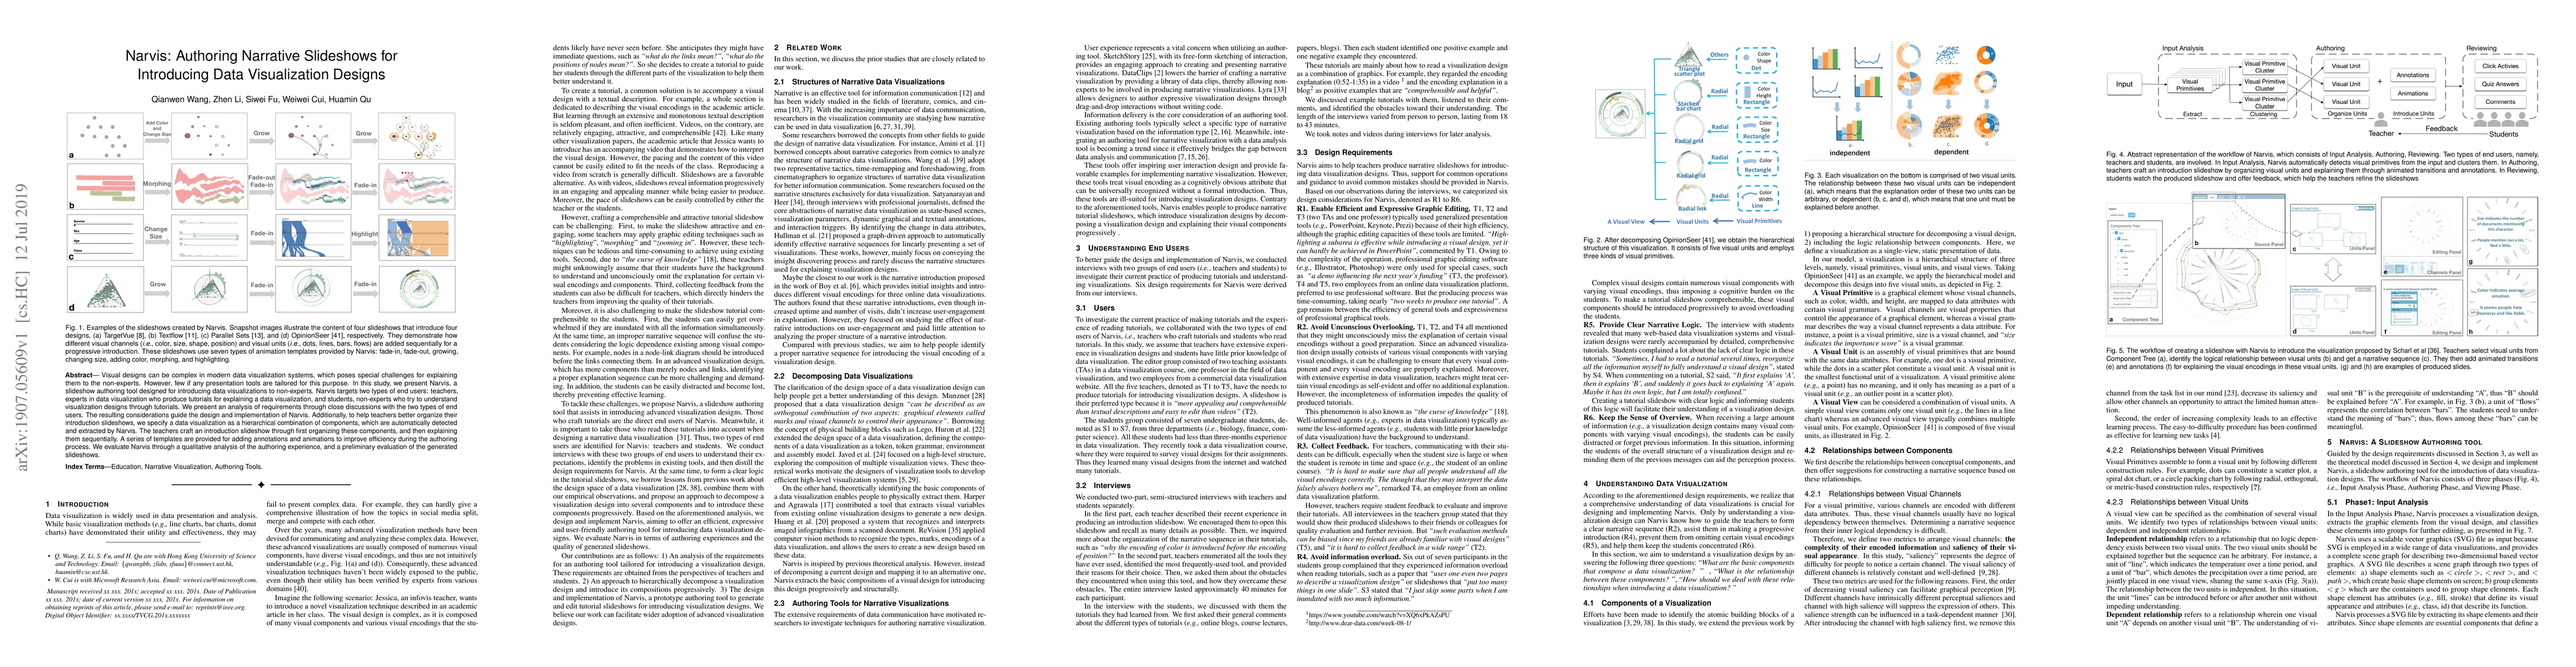
Visual designs can be complex in modern data visualization systems, which poses special challenges for explaining them to the non-experts. However, few if any presentation tools are tailored for thi...
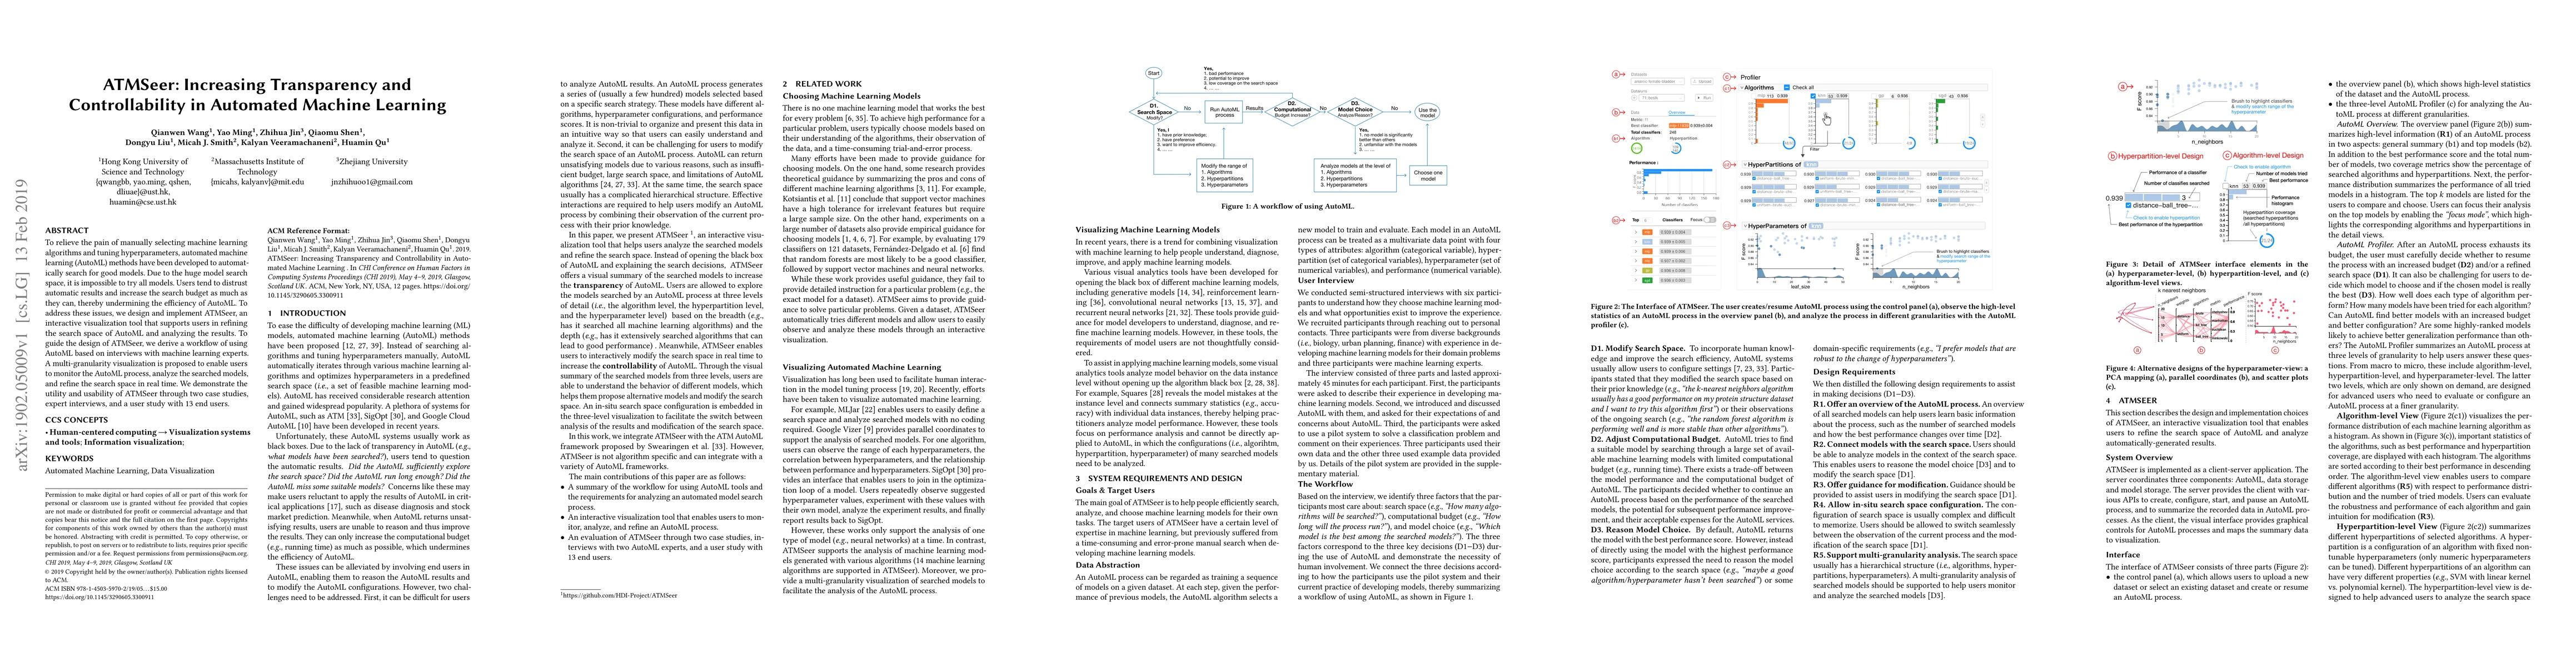
To relieve the pain of manually selecting machine learning algorithms and tuning hyperparameters, automated machine learning (AutoML) methods have been developed to automatically search for good mod...
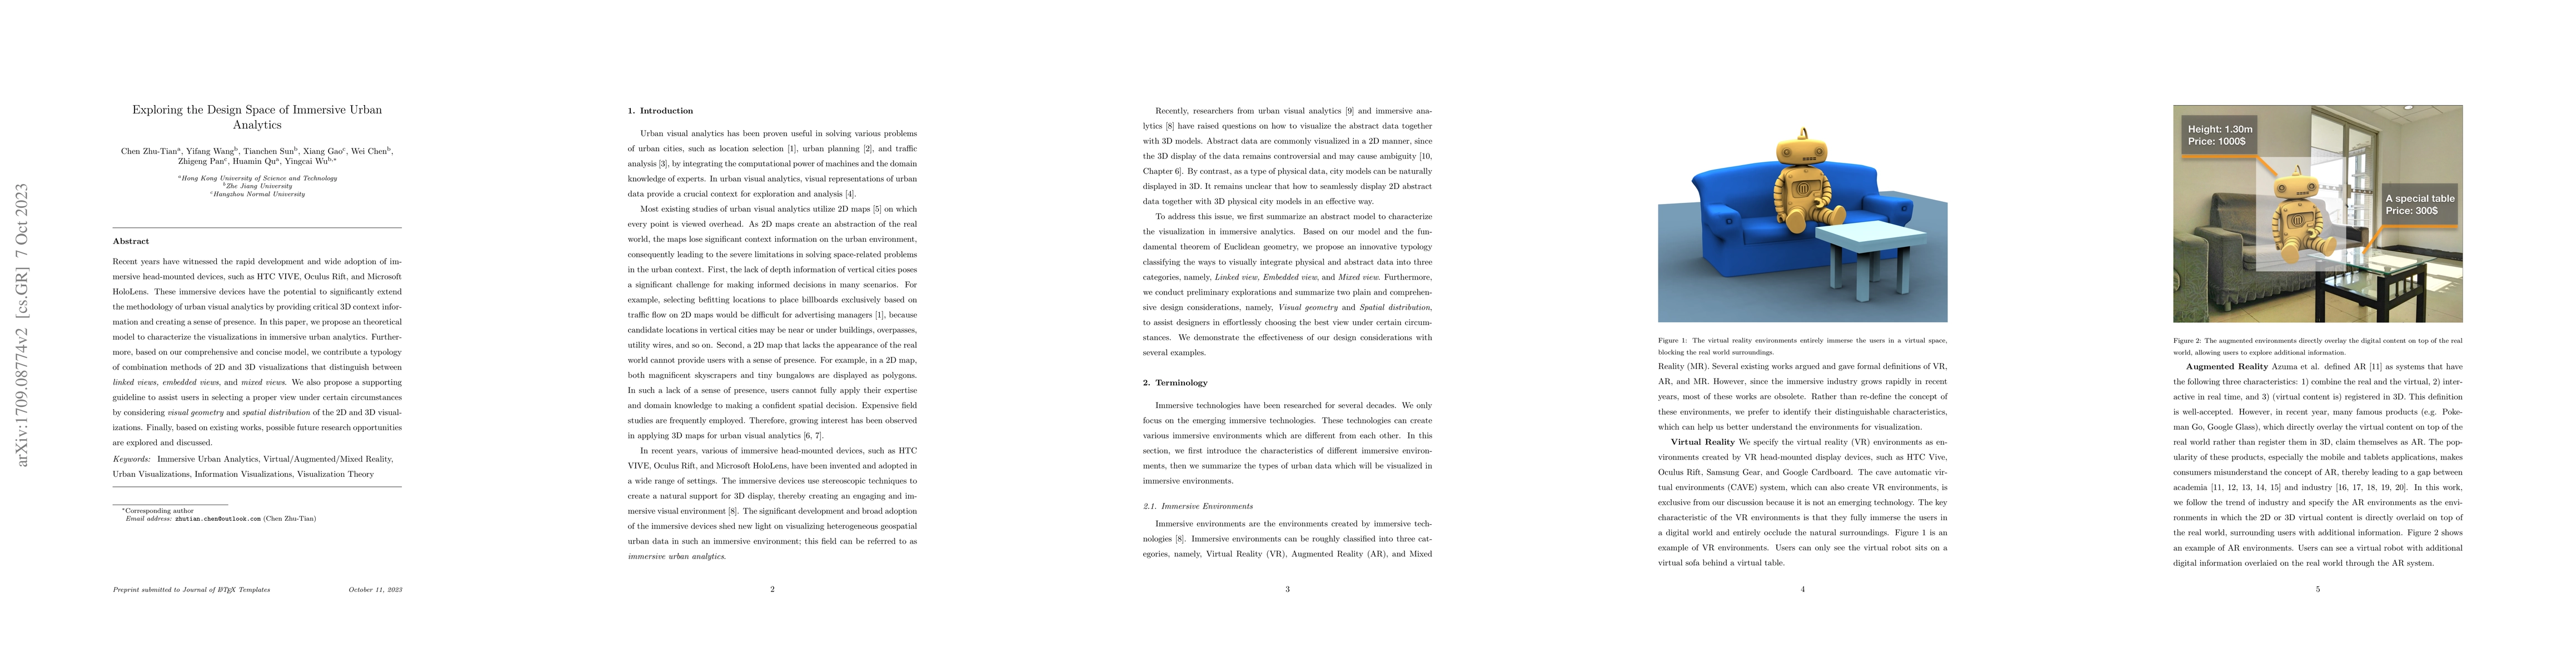
Recent years have witnessed the rapid development and wide adoption of immersive head-mounted devices, such as HTC VIVE, Oculus Rift, and Microsoft HoloLens. These immersive devices have the potenti...
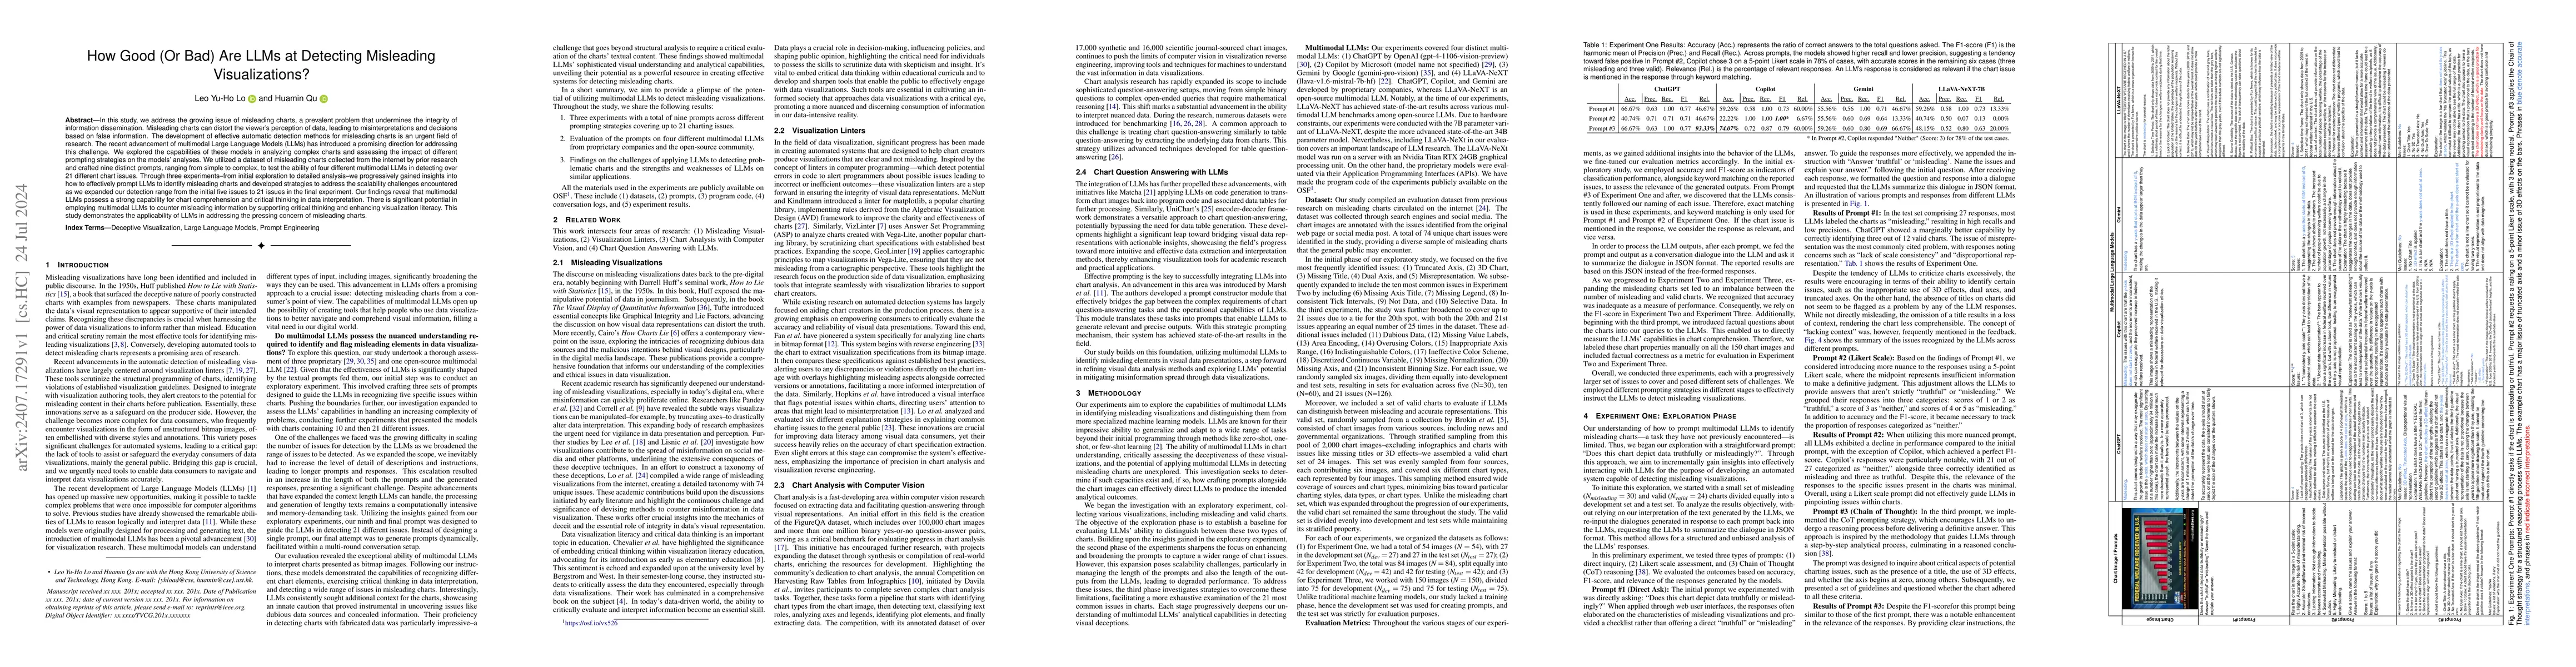
In this study, we address the growing issue of misleading charts, a prevalent problem that undermines the integrity of information dissemination. Misleading charts can distort the viewer's perception ...

Forecasting weather and climate events is crucial for making appropriate measures to mitigate environmental hazards and minimize associated losses. Previous research on environmental forecasting focus...
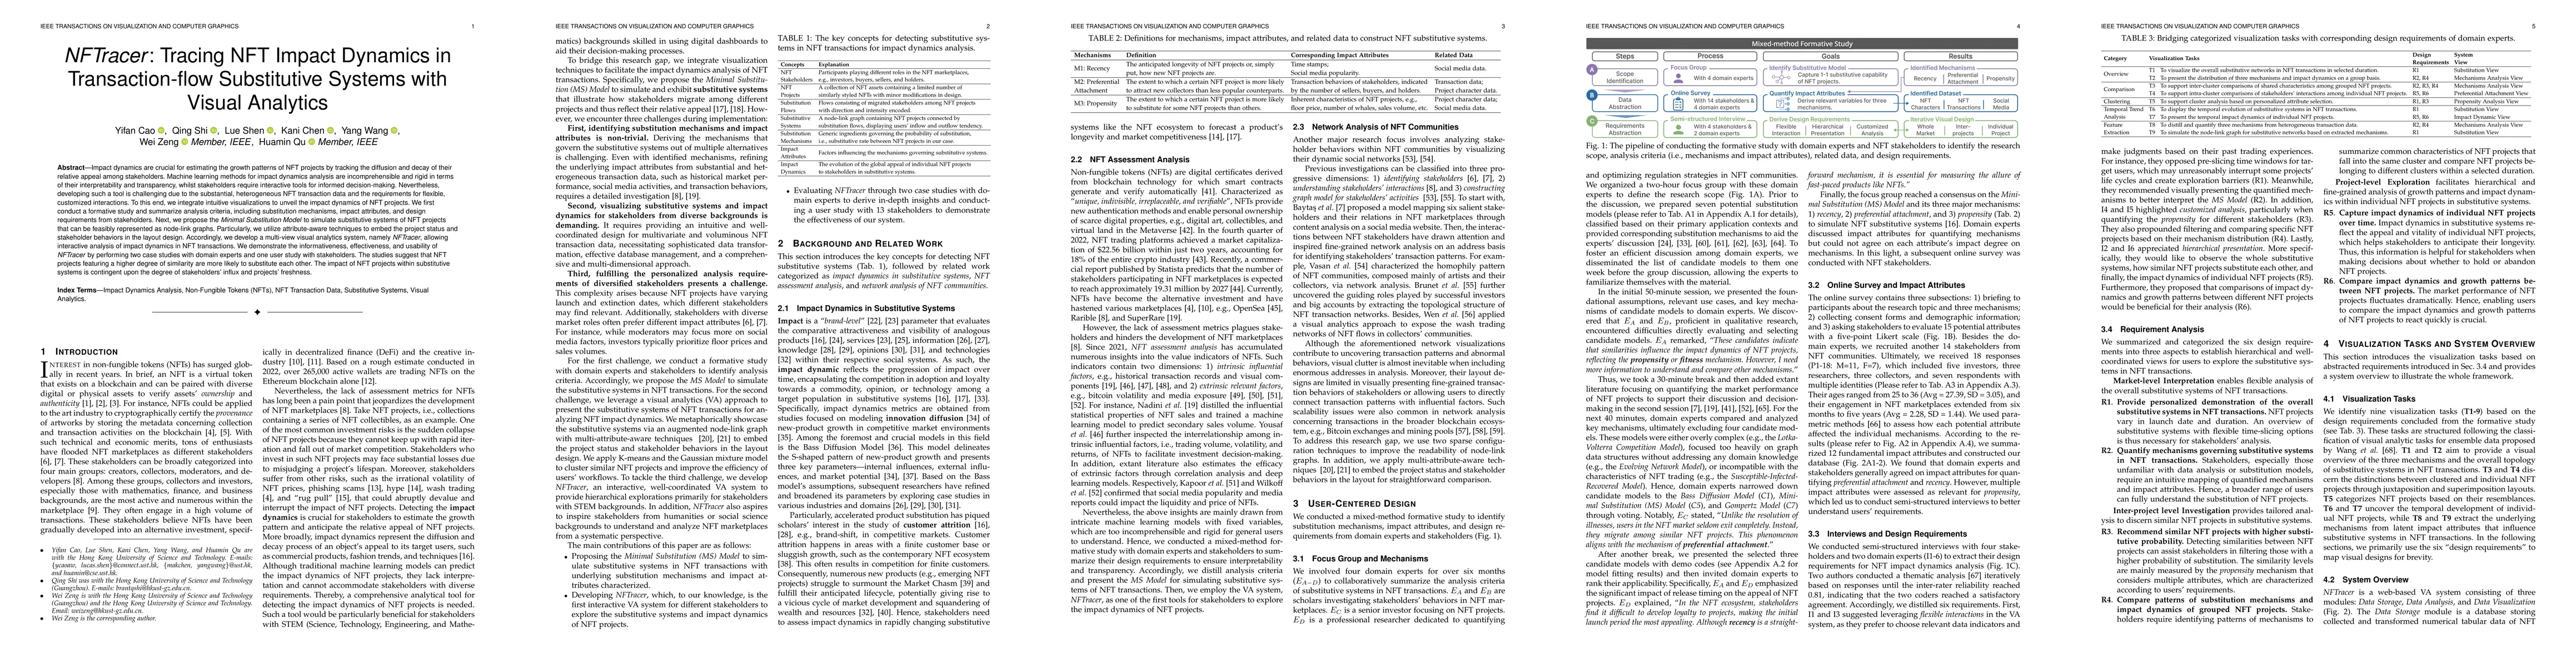
Impact dynamics are crucial for estimating the growth patterns of NFT projects by tracking the diffusion and decay of their relative appeal among stakeholders. Machine learning methods for impact dyna...
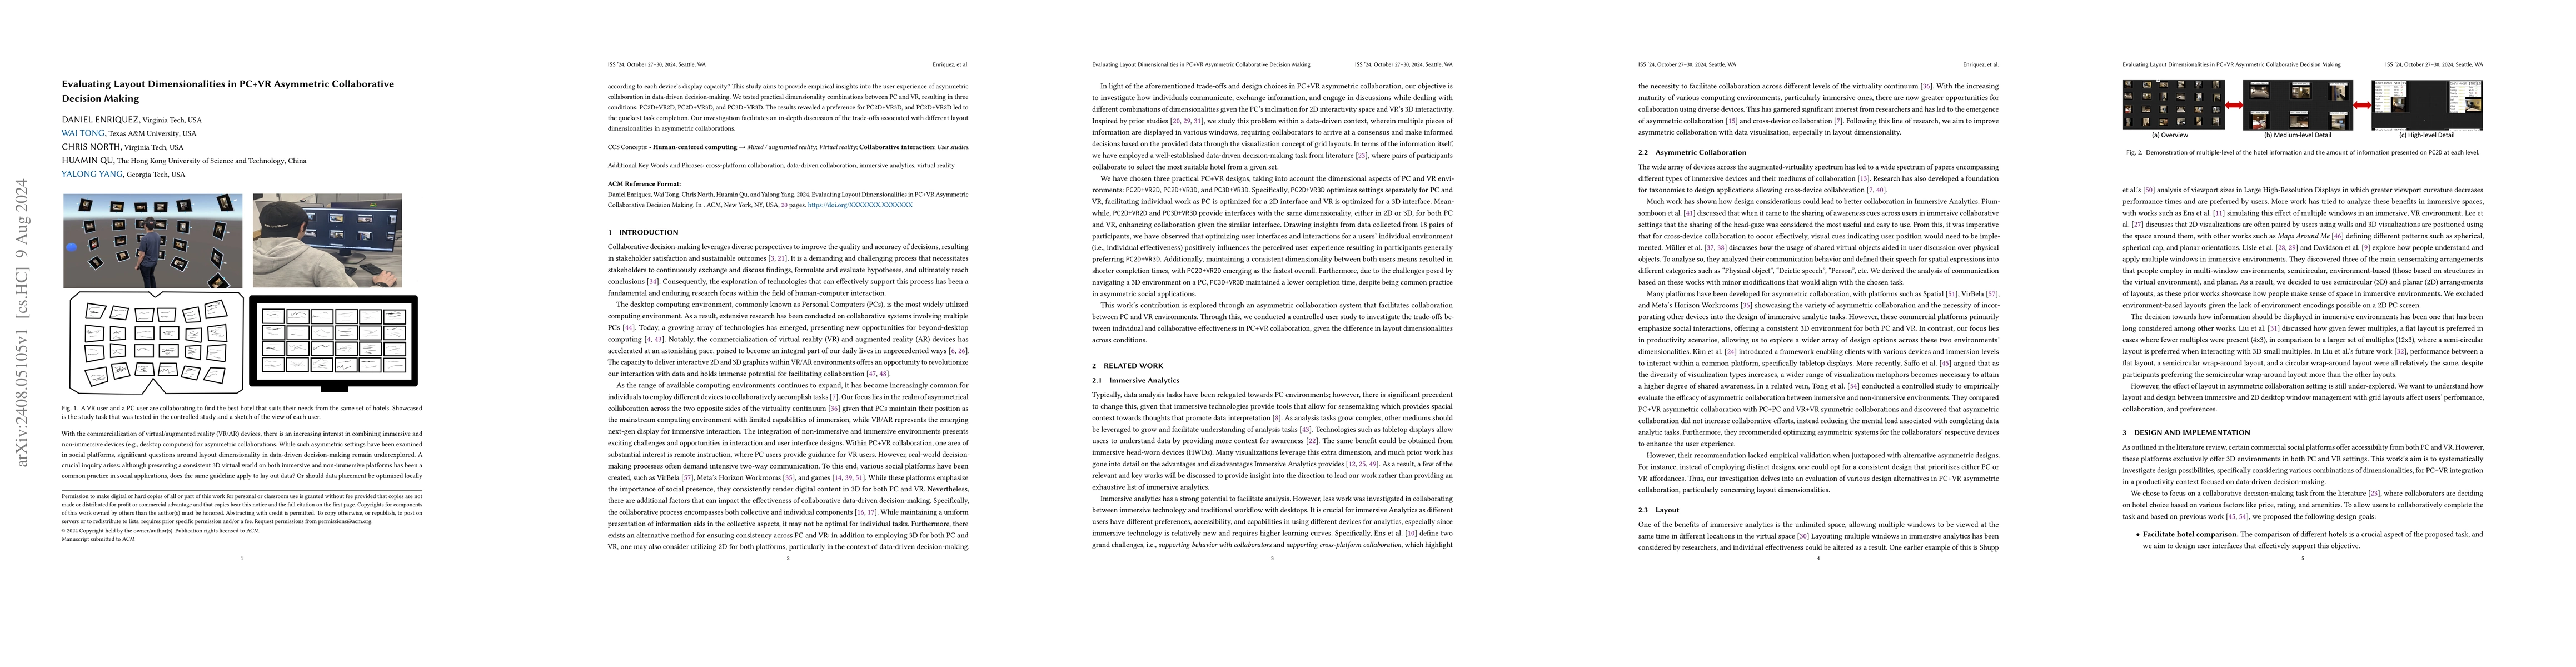
With the commercialization of virtual/augmented reality (VR/AR) devices, there is an increasing interest in combining immersive and non-immersive devices (e.g., desktop computers) for asymmetric colla...
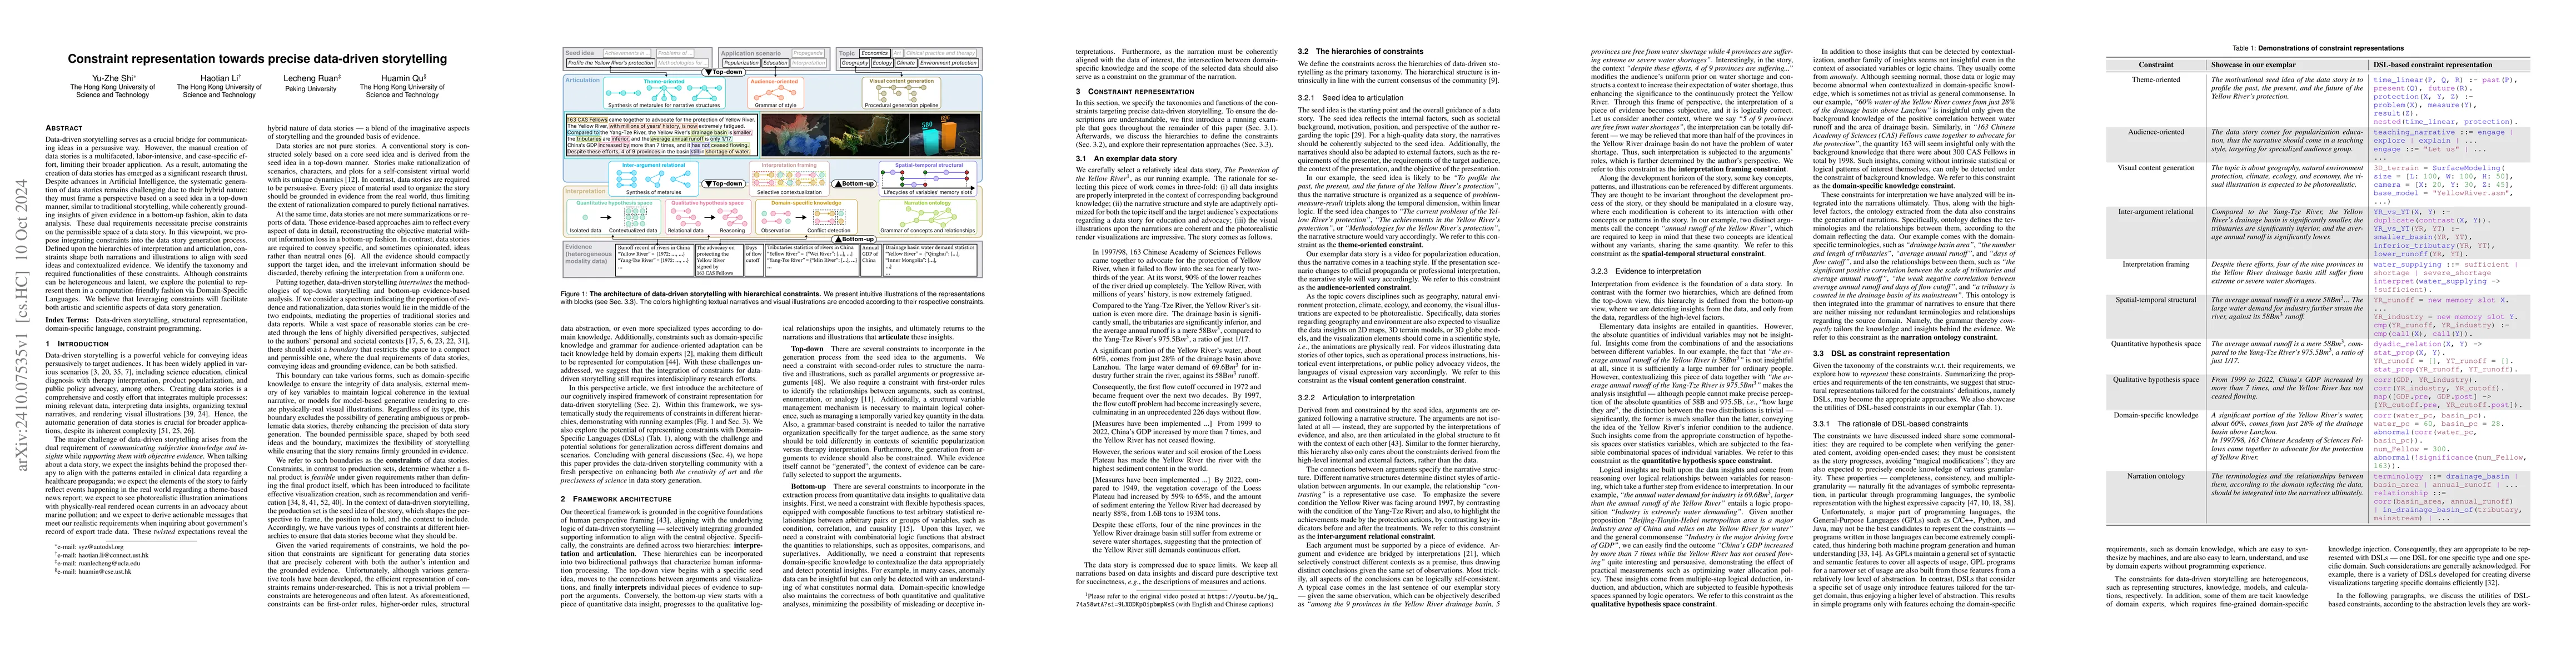
Data-driven storytelling serves as a crucial bridge for communicating ideas in a persuasive way. However, the manual creation of data stories is a multifaceted, labor-intensive, and case-specific effo...
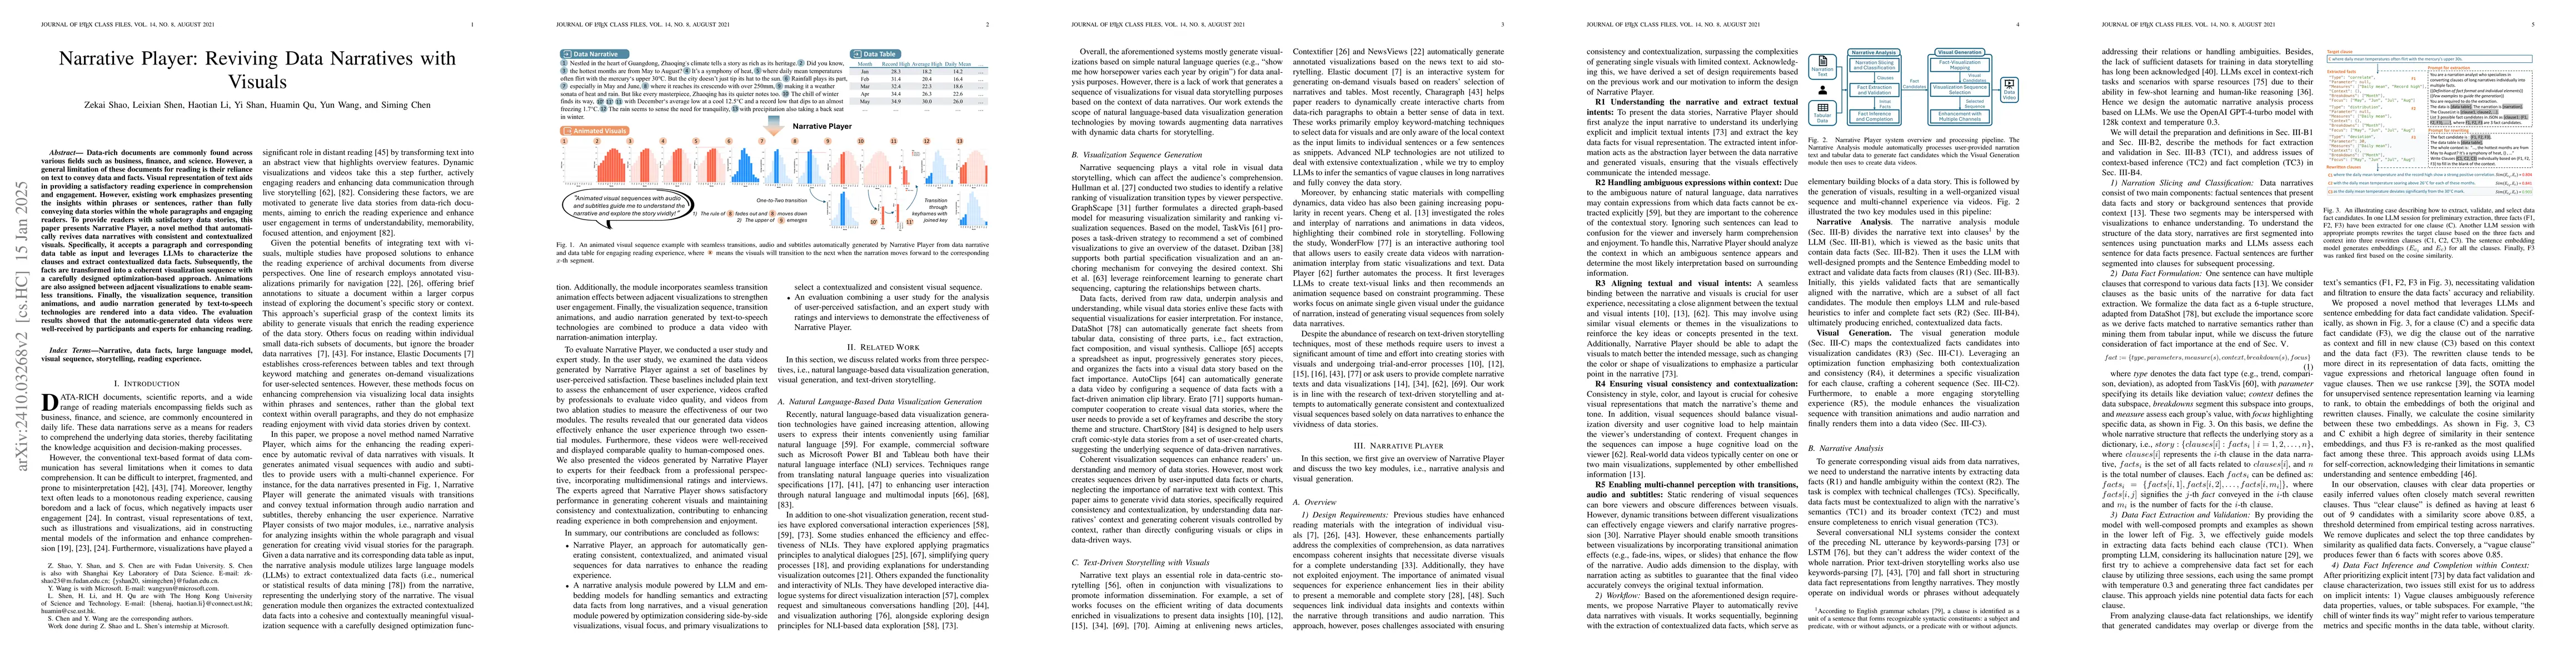
Data-rich documents are commonly found across various fields such as business, finance, and science. However, a general limitation of these documents for reading is their reliance on text to convey da...
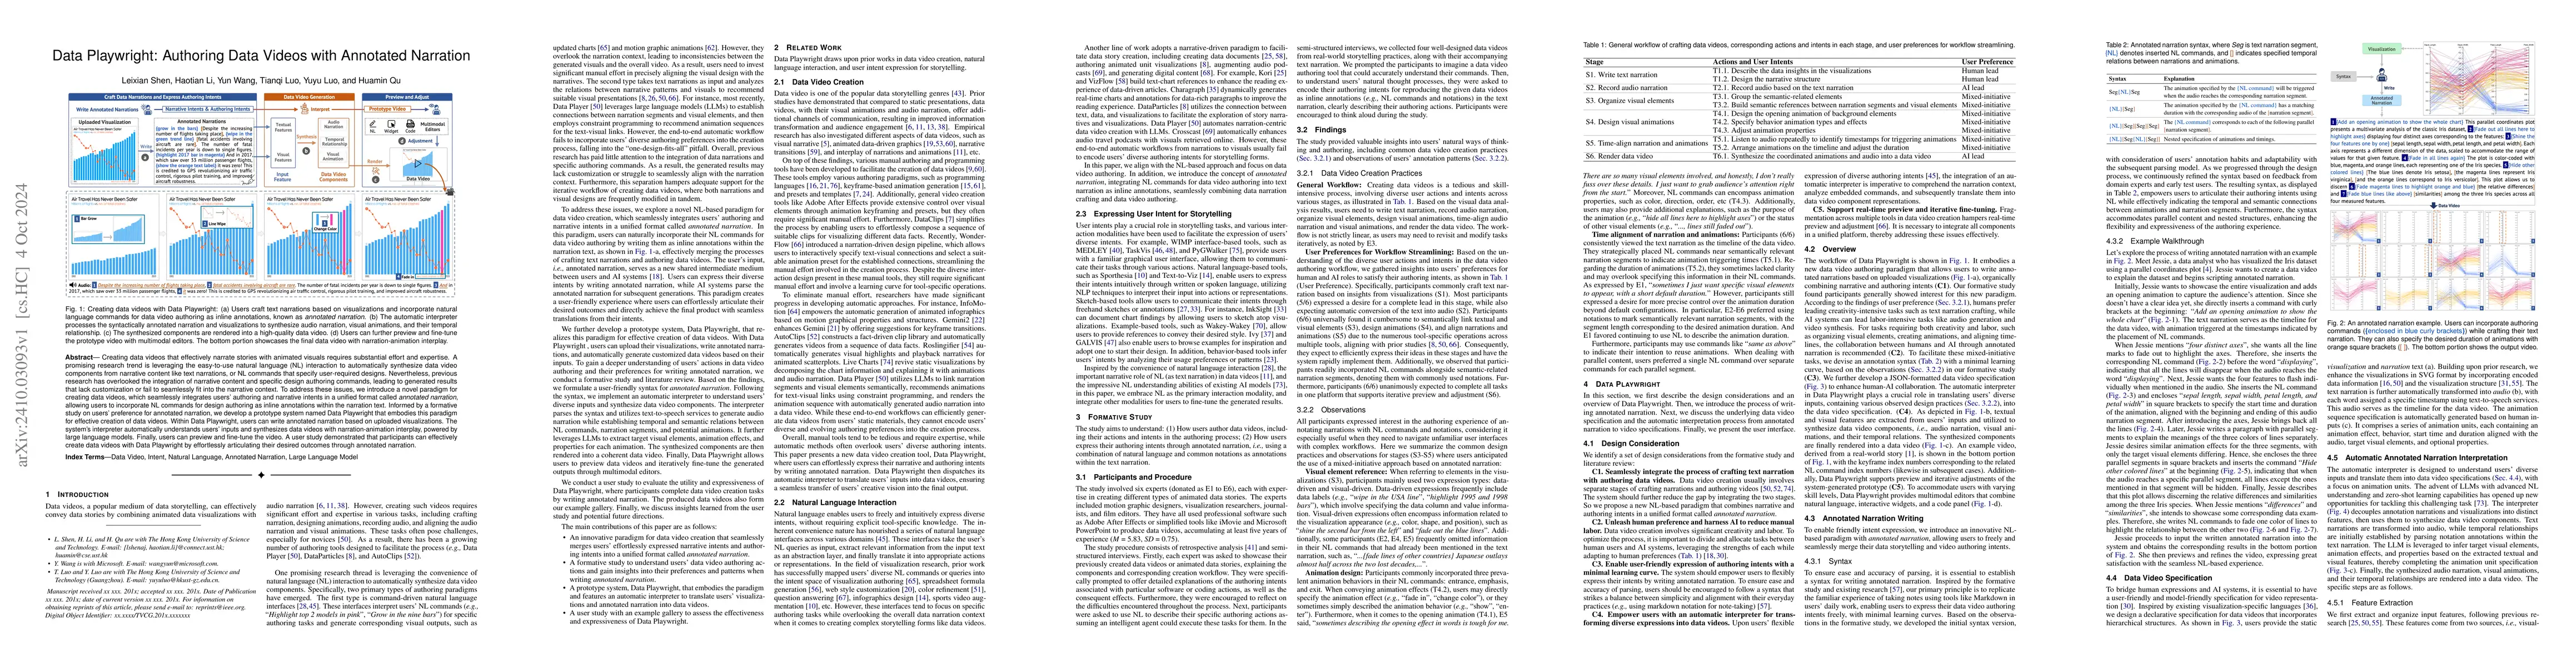
Creating data videos that effectively narrate stories with animated visuals requires substantial effort and expertise. A promising research trend is leveraging the easy-to-use natural language (NL) in...
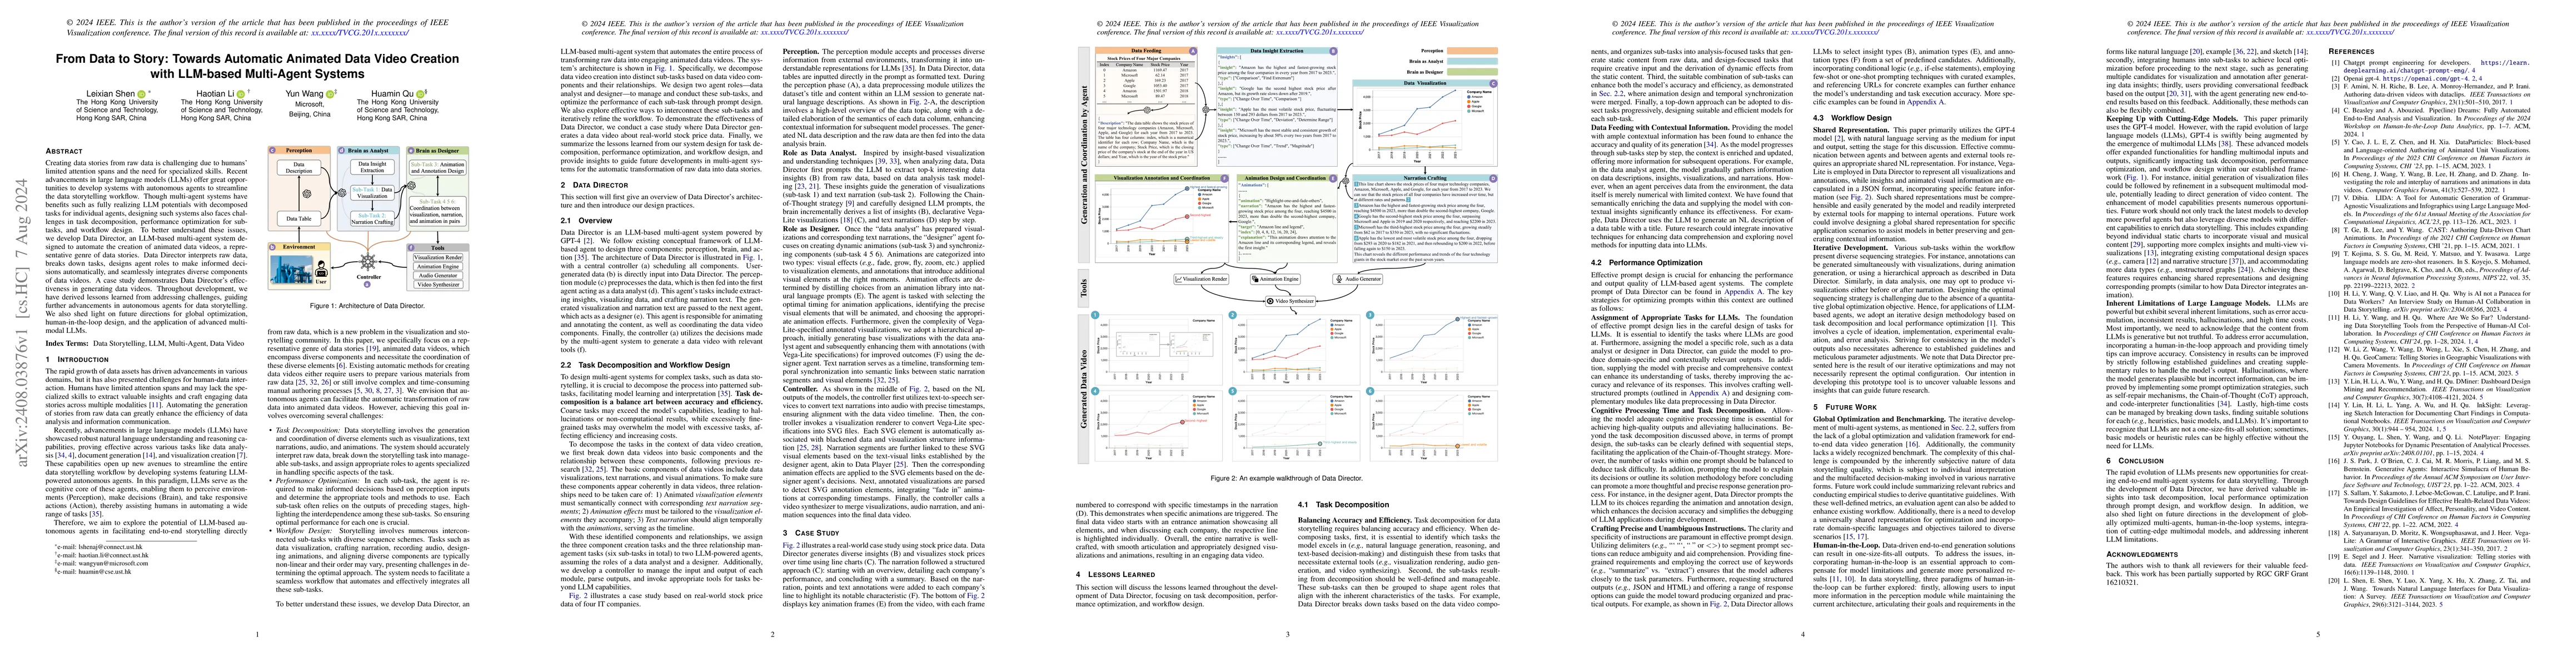
Creating data stories from raw data is challenging due to humans' limited attention spans and the need for specialized skills. Recent advancements in large language models (LLMs) offer great opportuni...
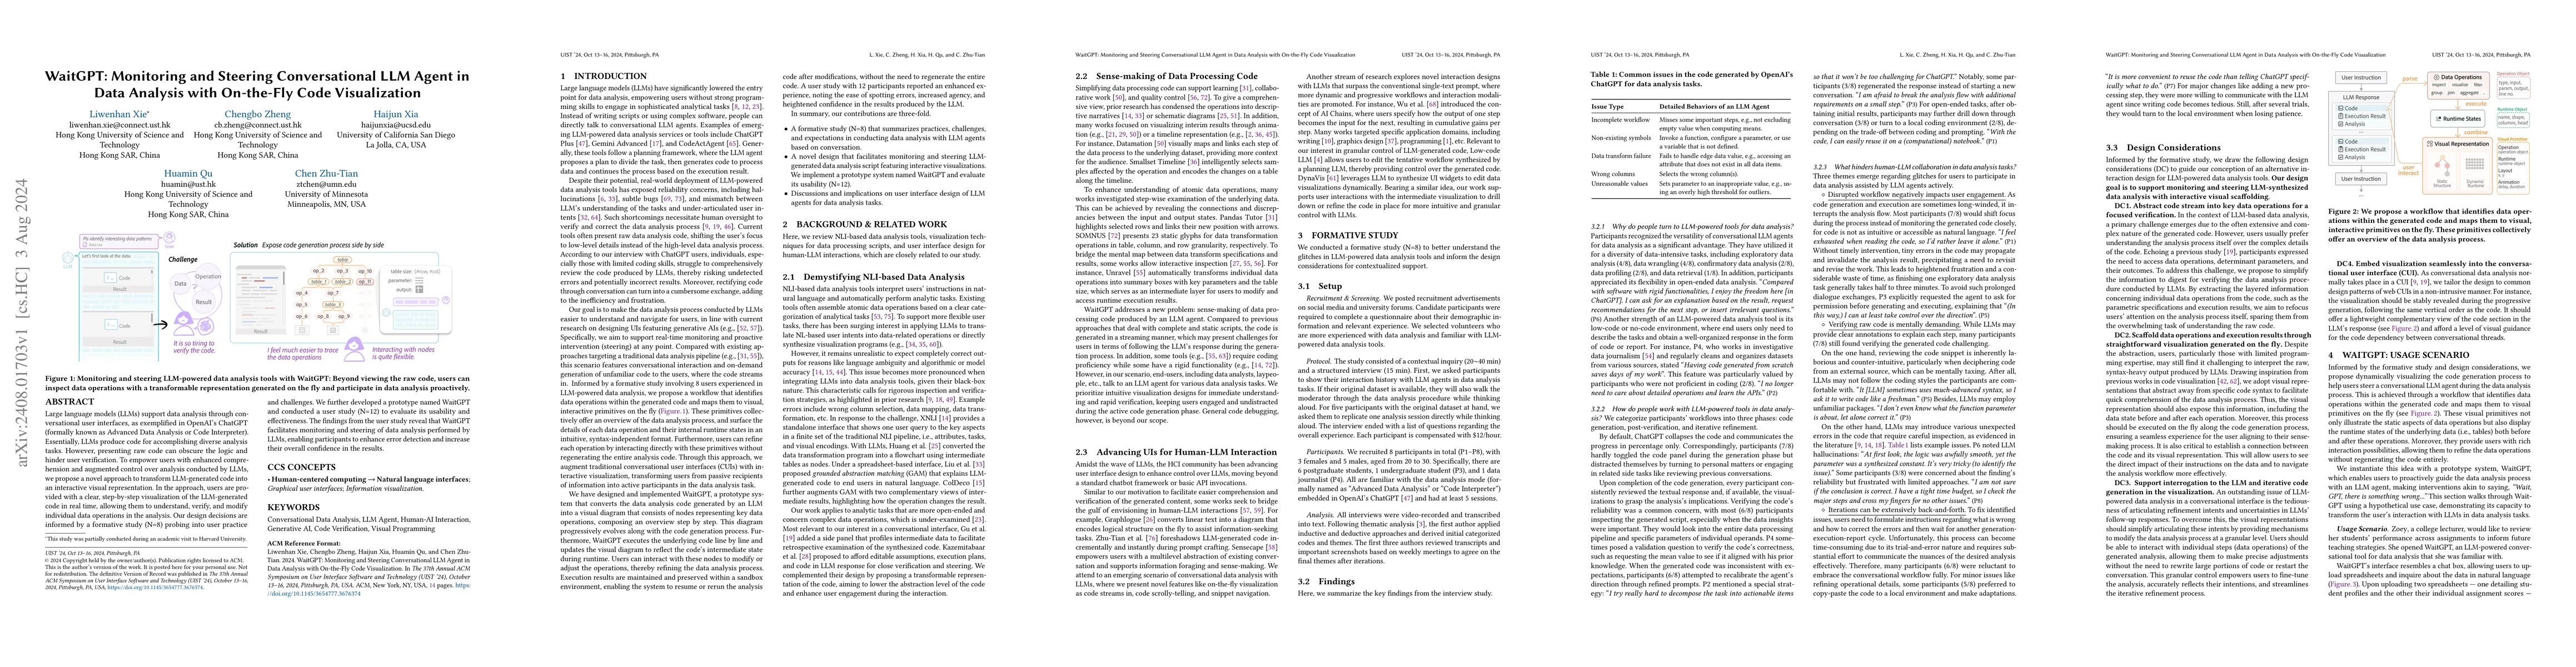
Large language models (LLMs) support data analysis through conversational user interfaces, as exemplified in OpenAI's ChatGPT (formally known as Advanced Data Analysis or Code Interpreter). Essentiall...
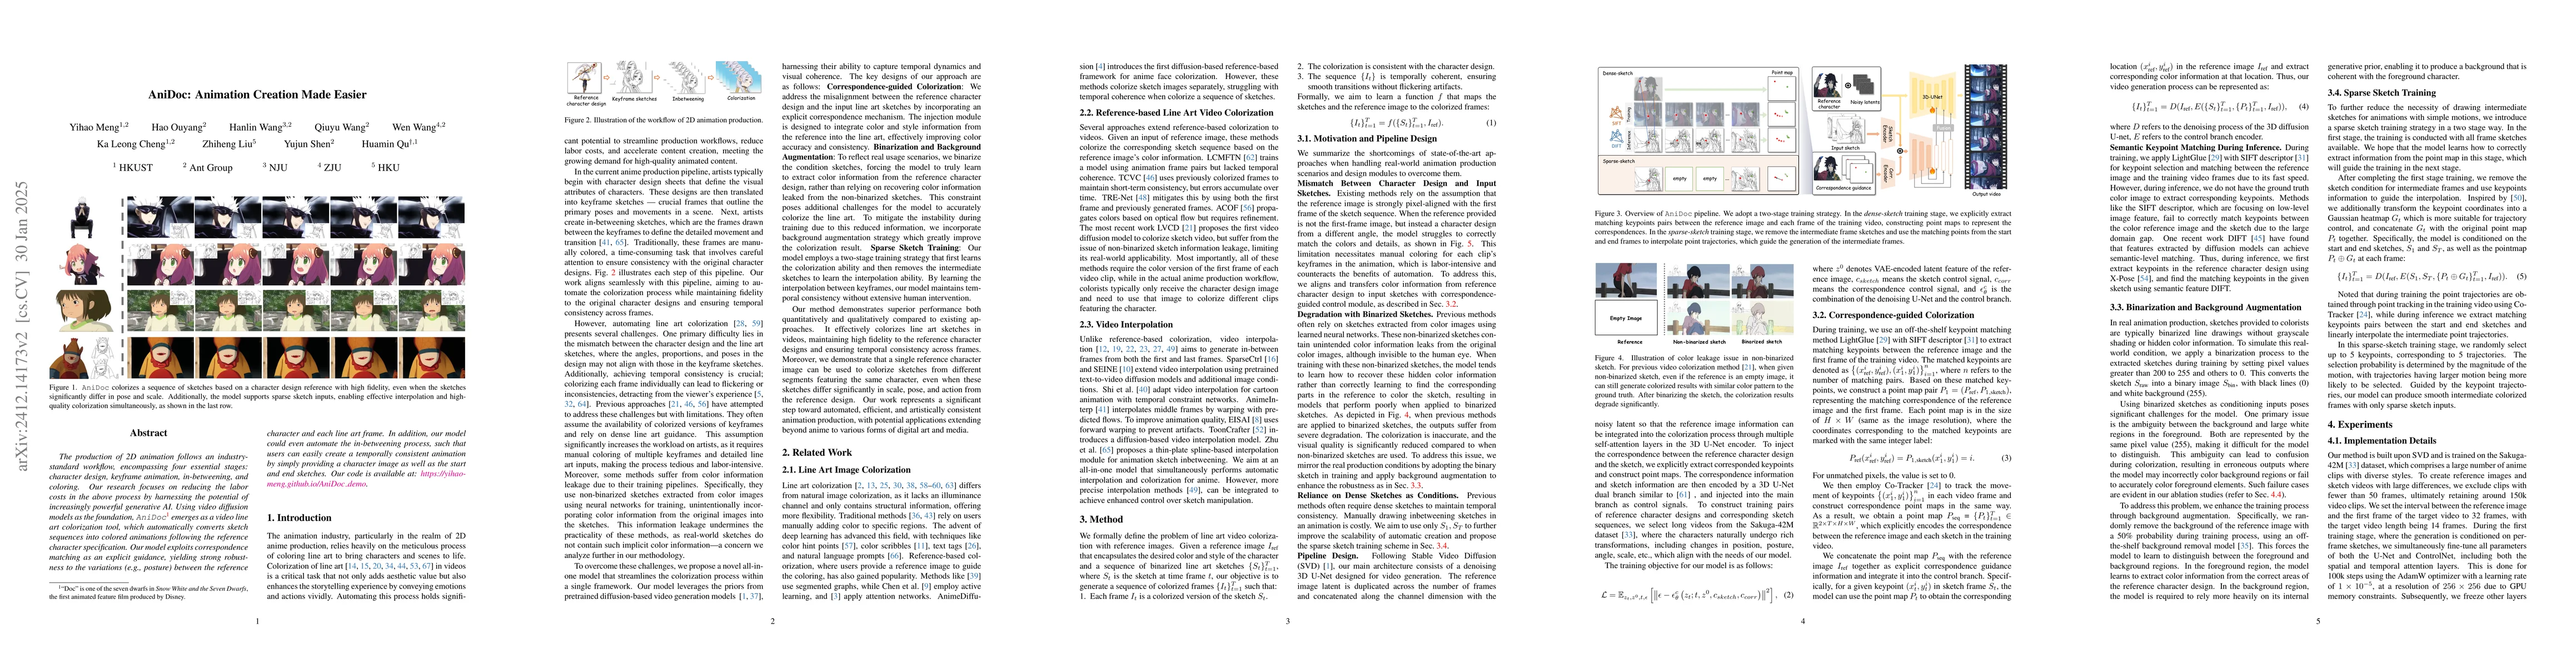
The production of 2D animation follows an industry-standard workflow, encompassing four essential stages: character design, keyframe animation, in-betweening, and coloring. Our research focuses on red...
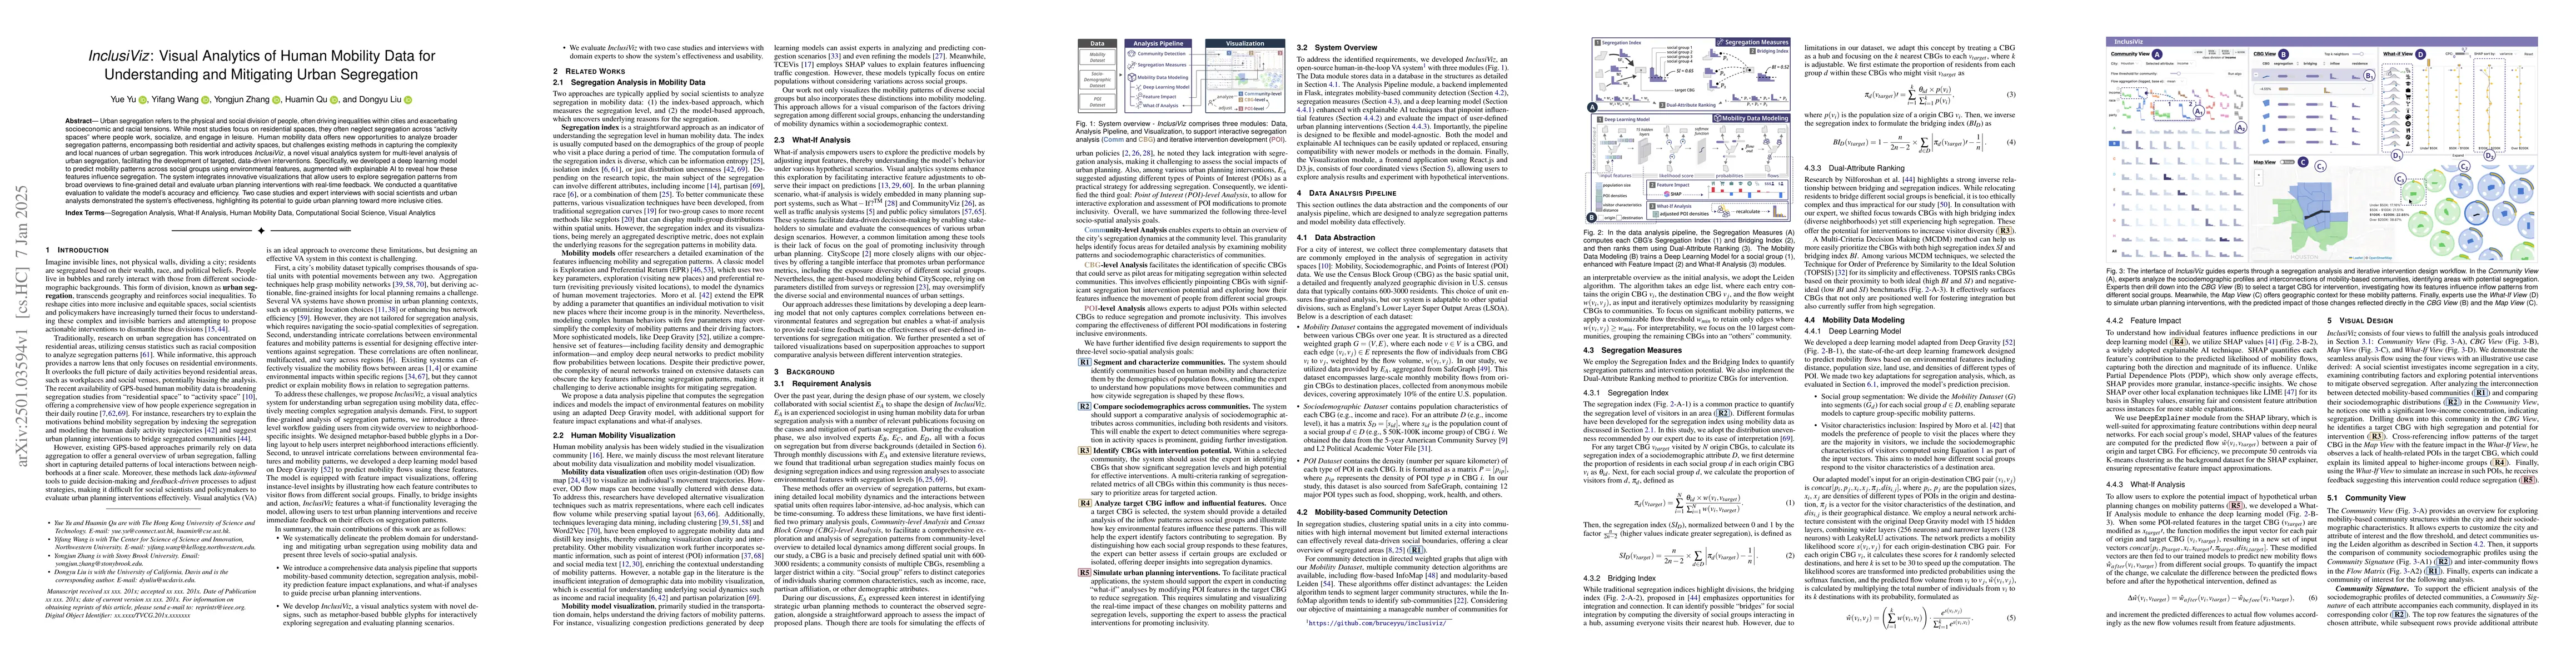
Urban segregation refers to the physical and social division of people, often driving inequalities within cities and exacerbating socioeconomic and racial tensions. While most studies focus on residen...
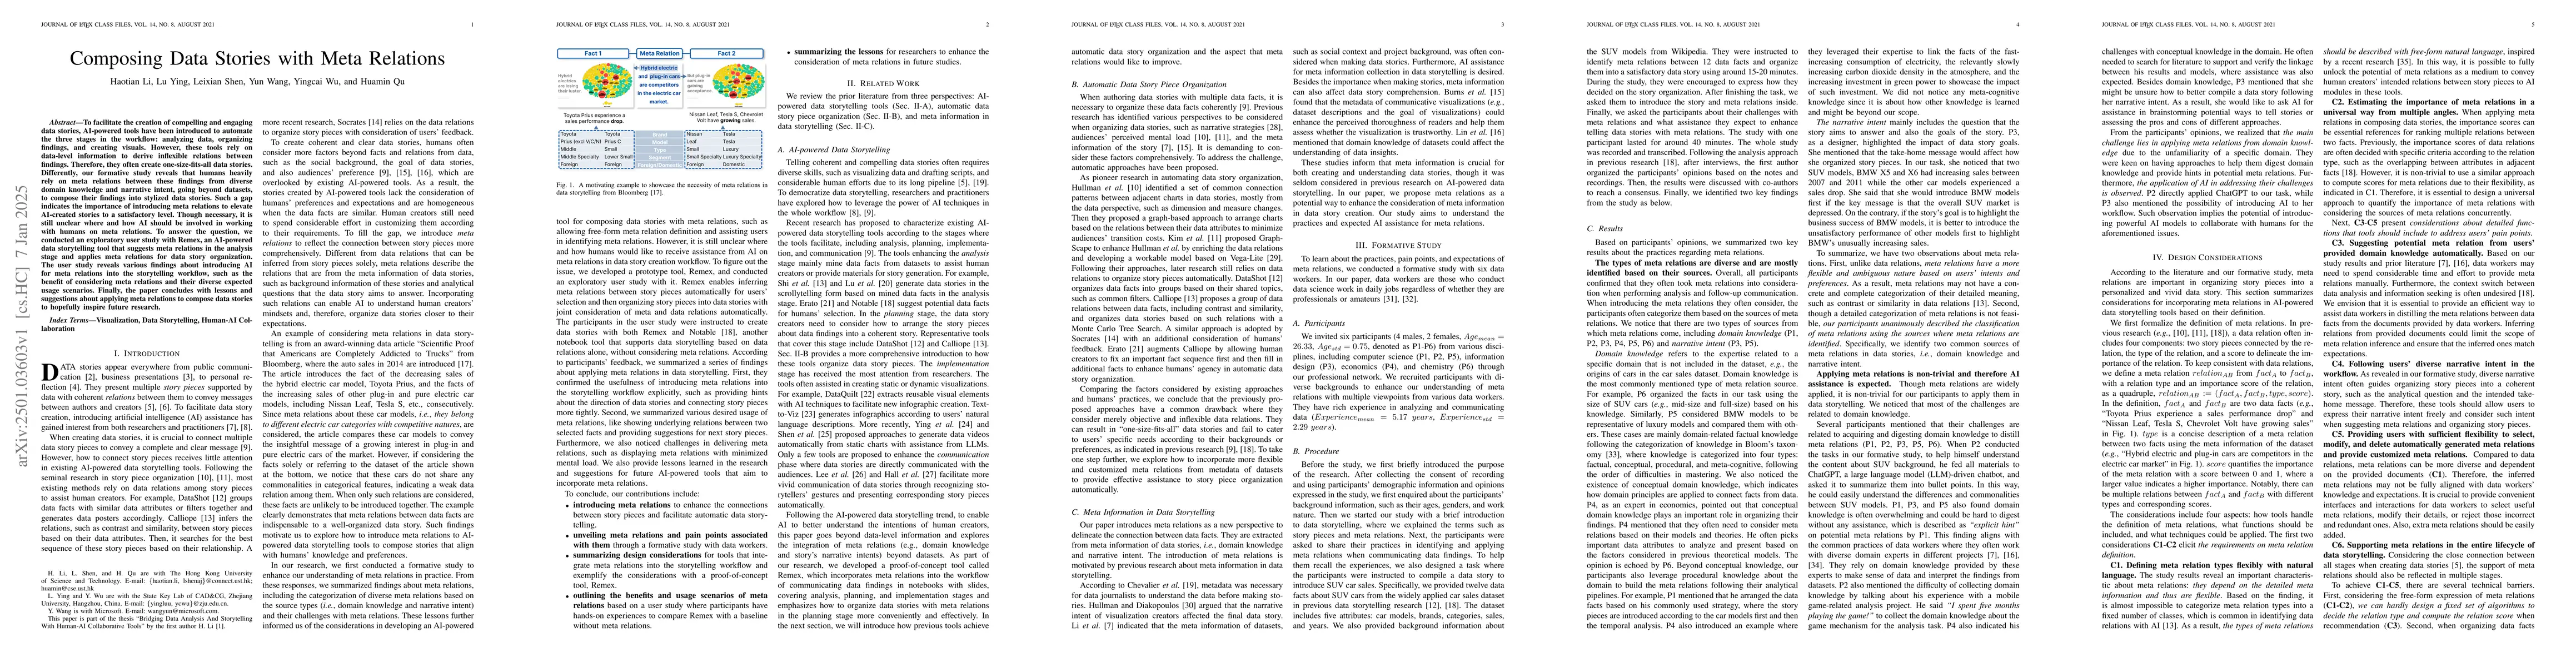
To facilitate the creation of compelling and engaging data stories, AI-powered tools have been introduced to automate the three stages in the workflow: analyzing data, organizing findings, and creatin...
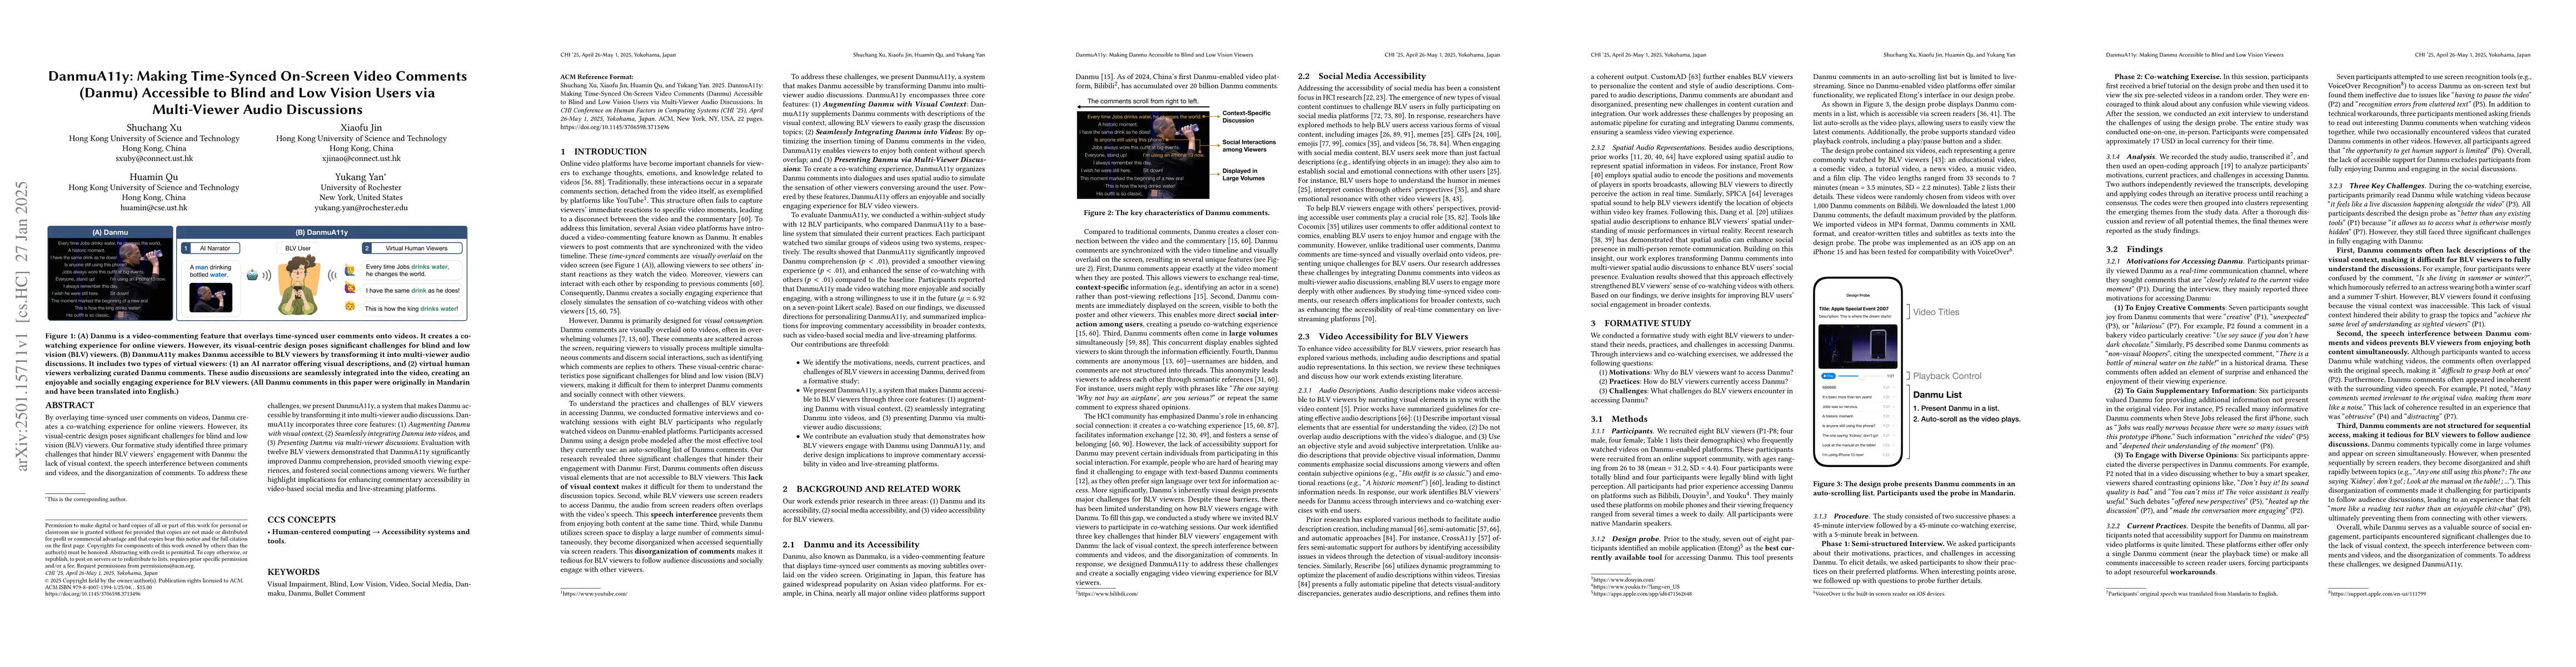
By overlaying time-synced user comments on videos, Danmu creates a co-watching experience for online viewers. However, its visual-centric design poses significant challenges for blind and low vision (...
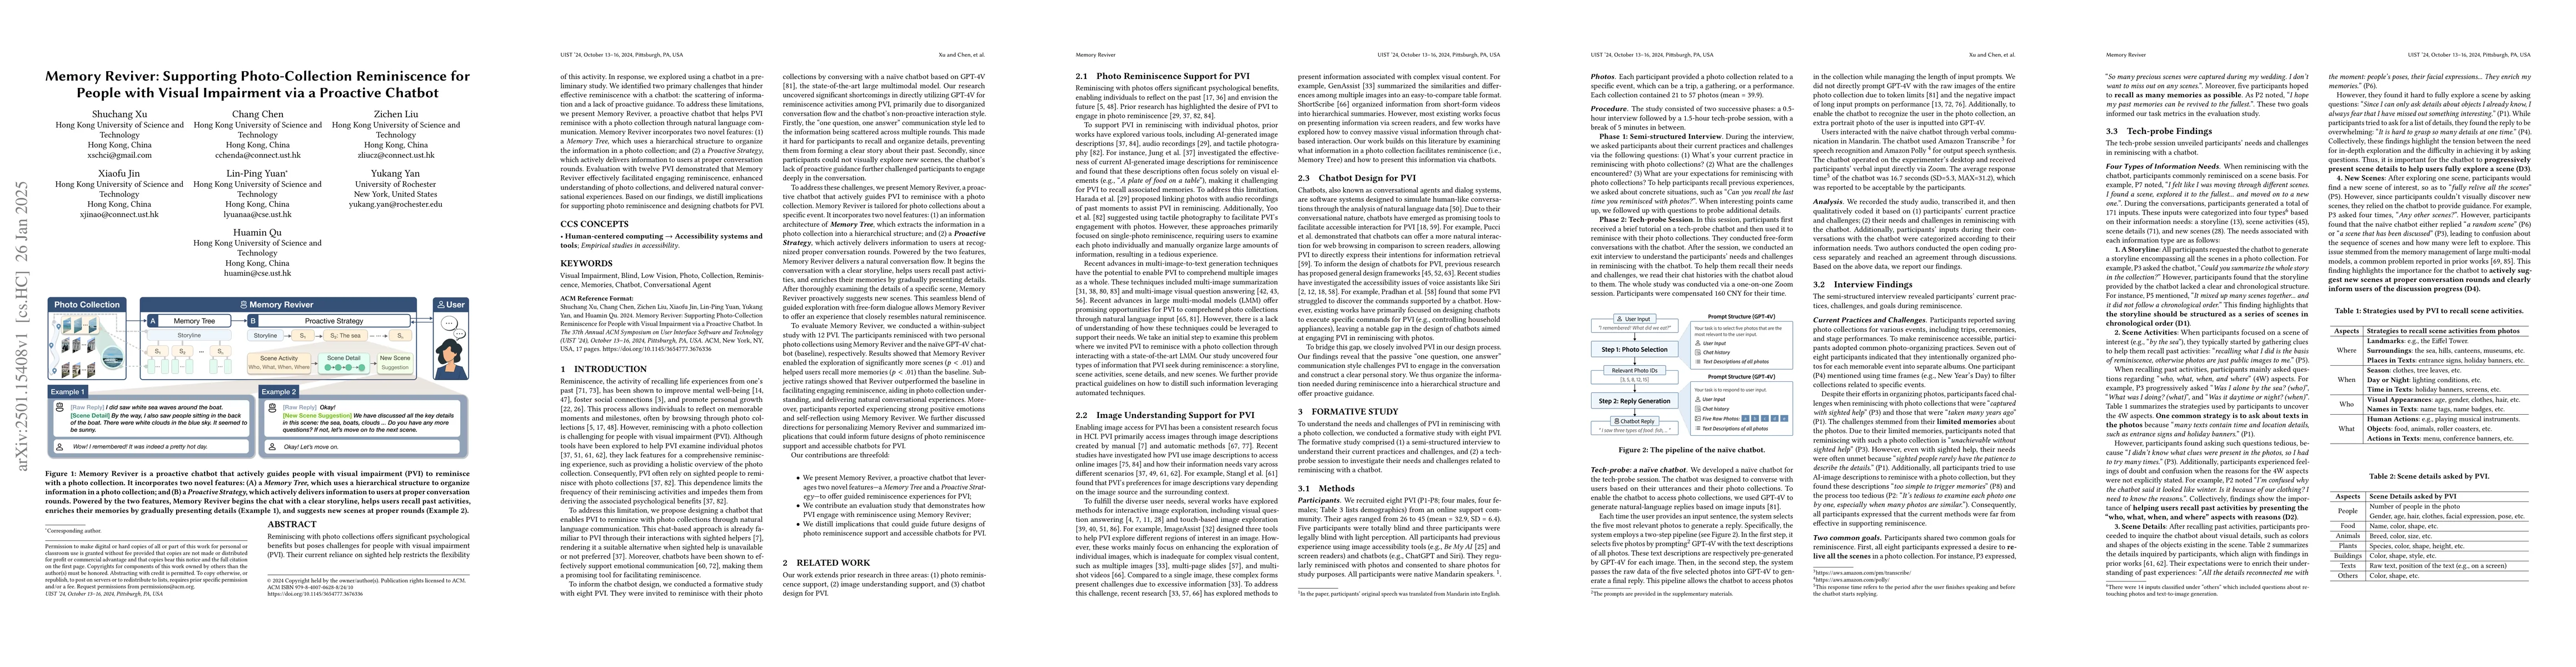
Reminiscing with photo collections offers significant psychological benefits but poses challenges for people with visual impairment (PVI). Their current reliance on sighted help restricts the flexibil...
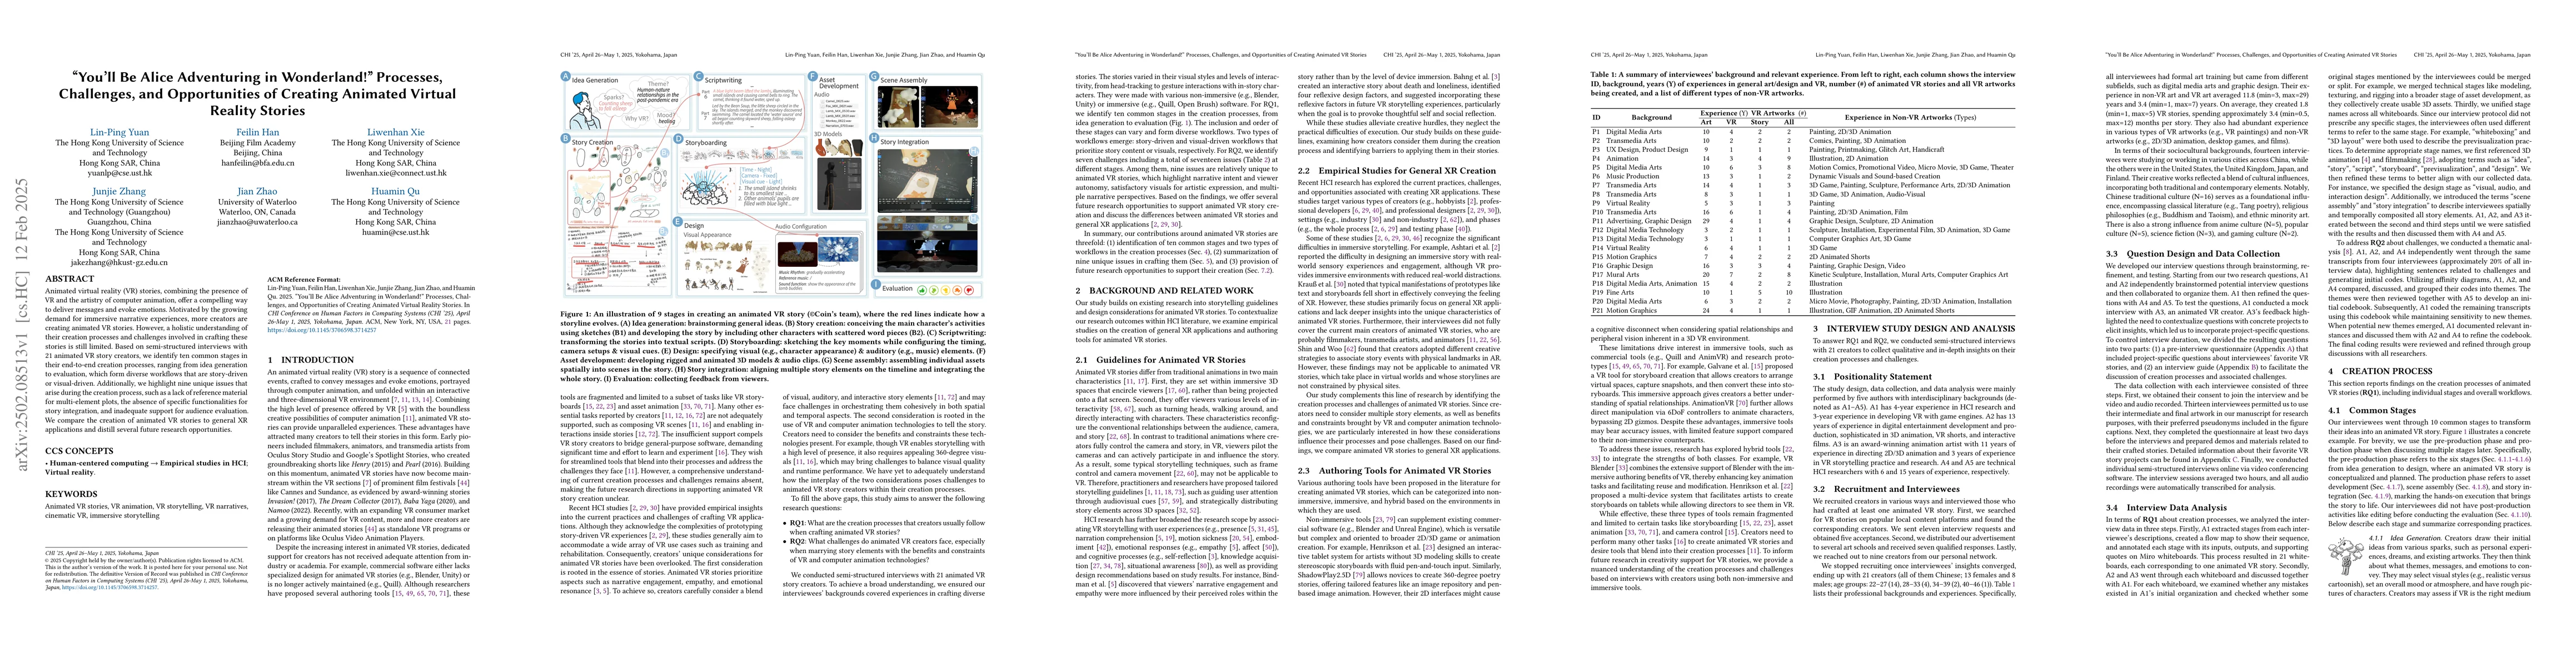
Animated virtual reality (VR) stories, combining the presence of VR and the artistry of computer animation, offer a compelling way to deliver messages and evoke emotions. Motivated by the growing dema...
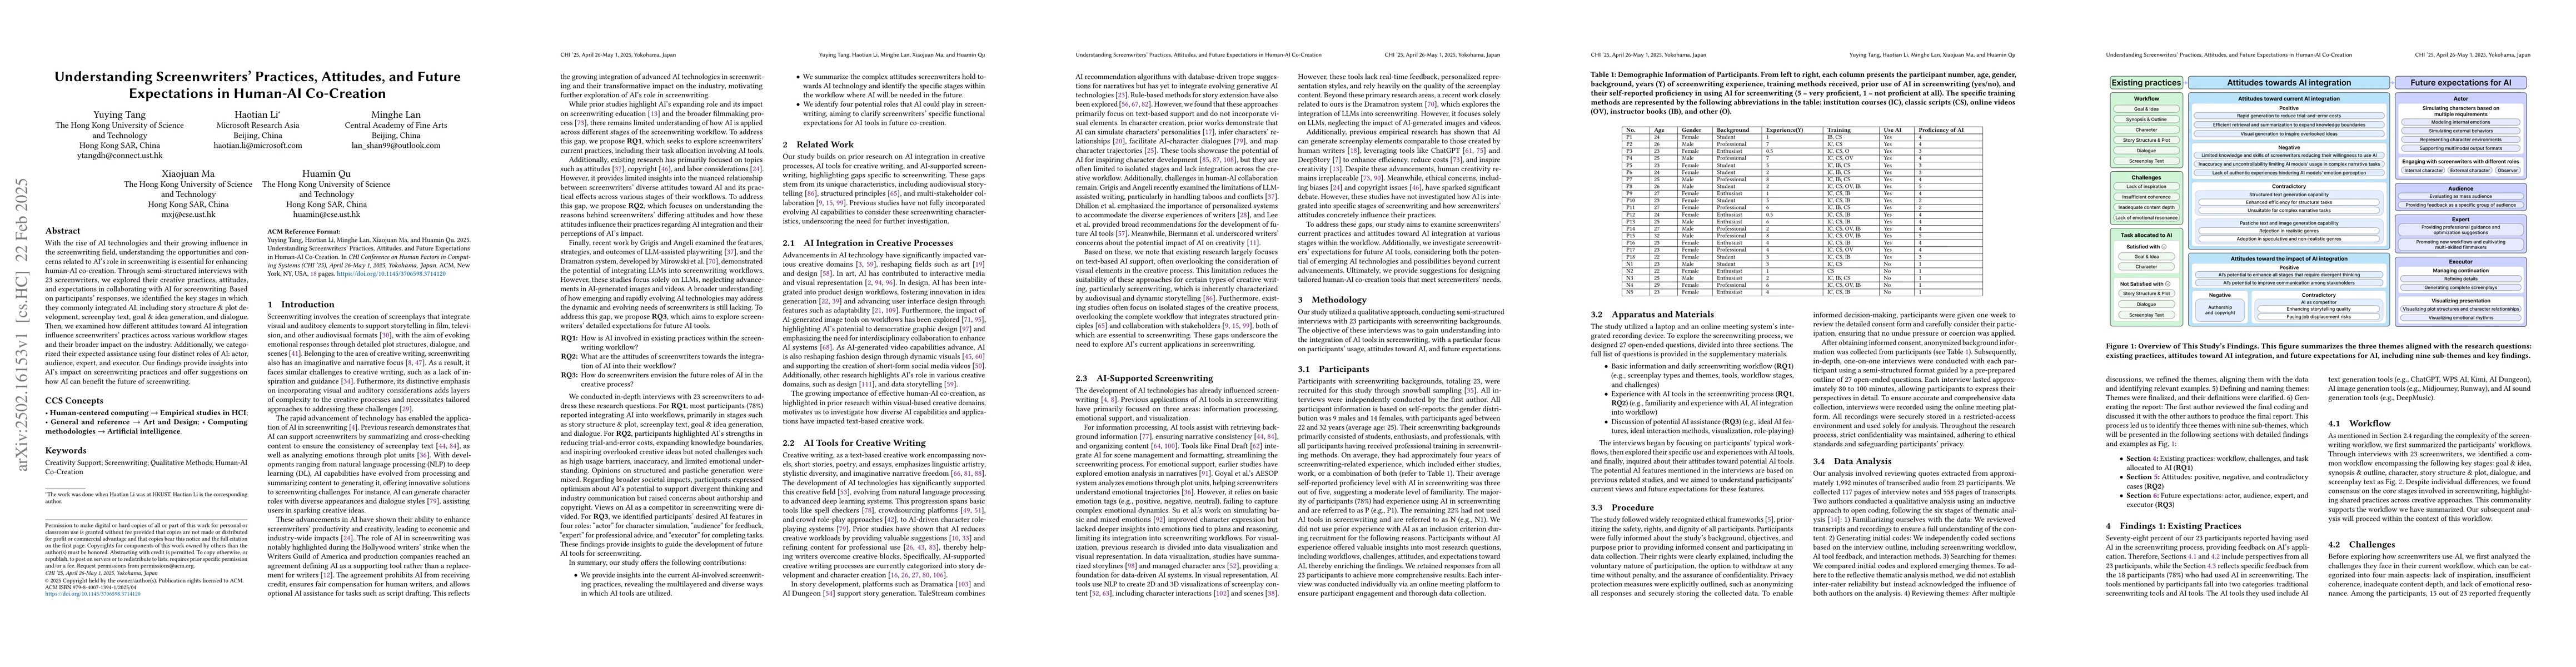
With the rise of AI technologies and their growing influence in the screenwriting field, understanding the opportunities and concerns related to AI's role in screenwriting is essential for enhancing h...
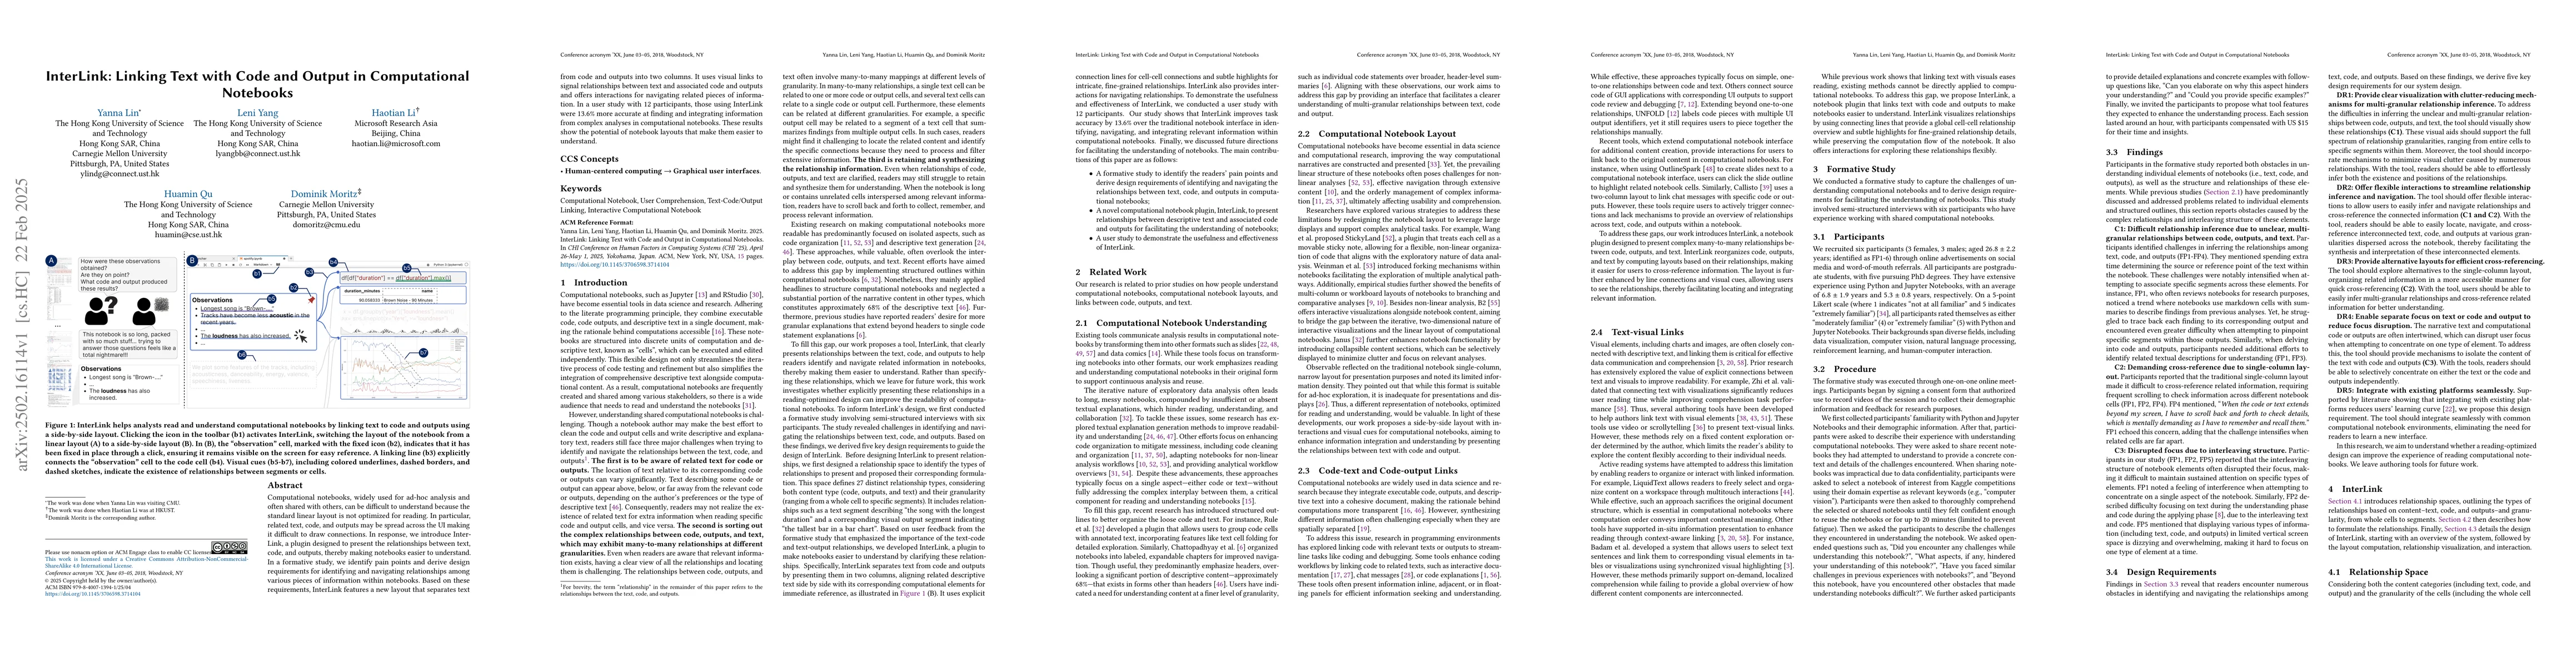
Computational notebooks, widely used for ad-hoc analysis and often shared with others, can be difficult to understand because the standard linear layout is not optimized for reading. In particular, re...
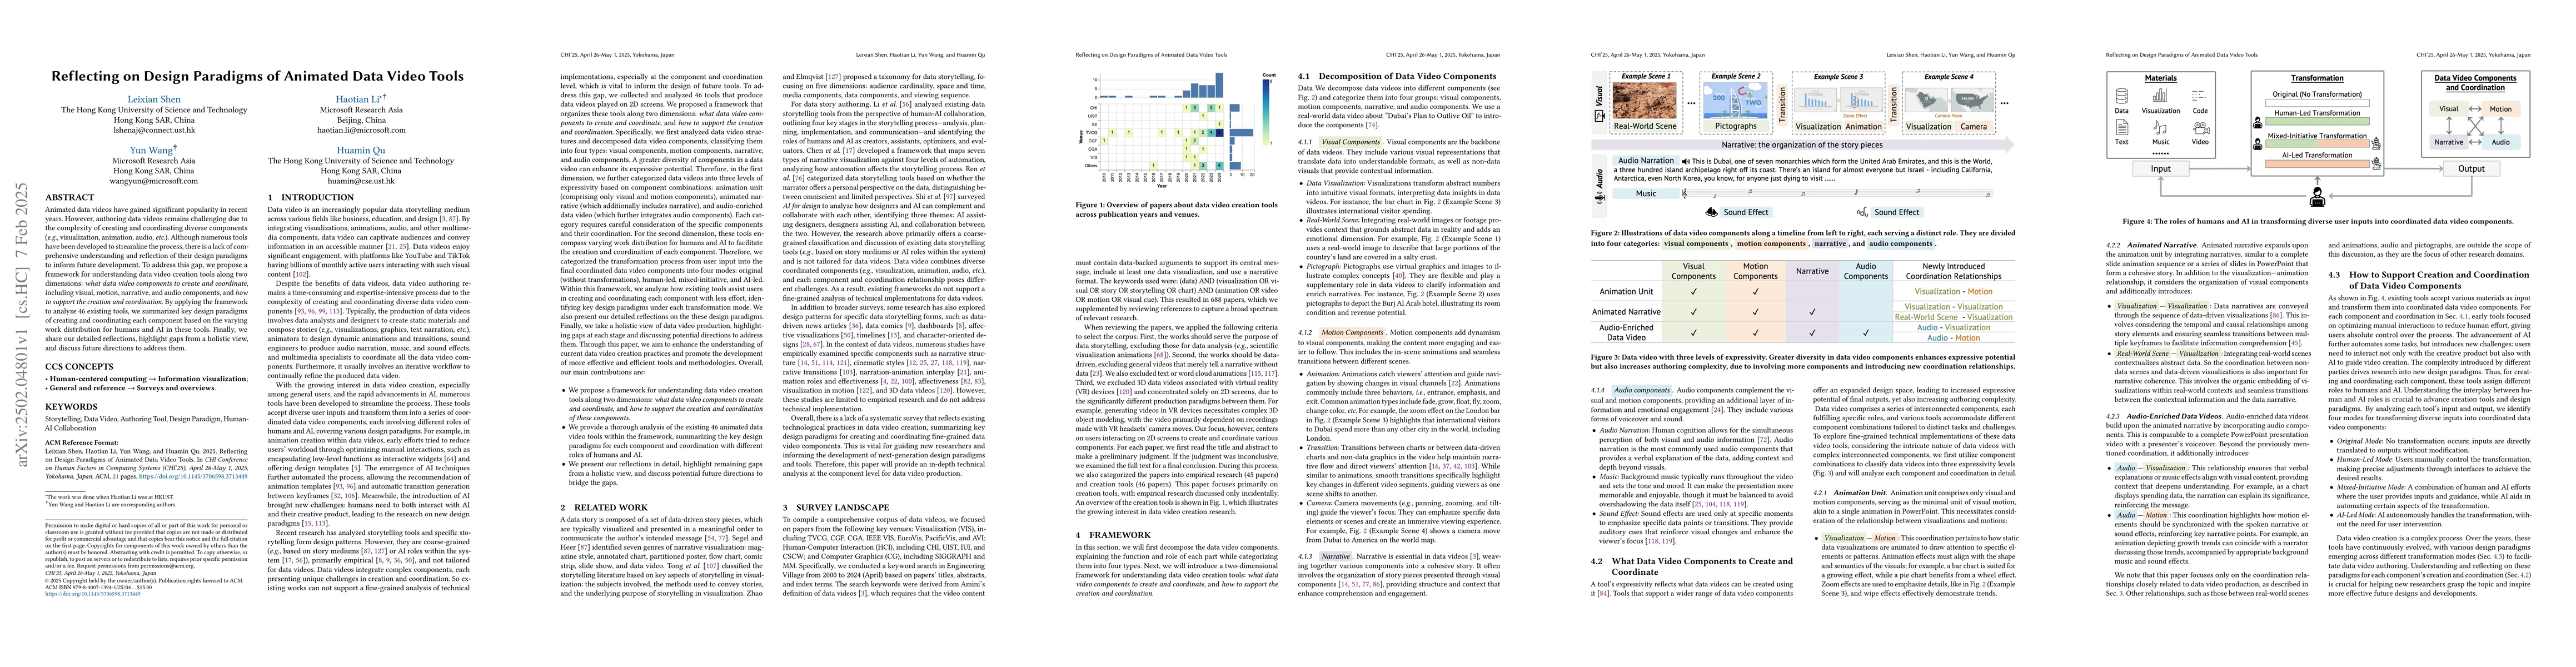
Animated data videos have gained significant popularity in recent years. However, authoring data videos remains challenging due to the complexity of creating and coordinating diverse components (e.g.,...
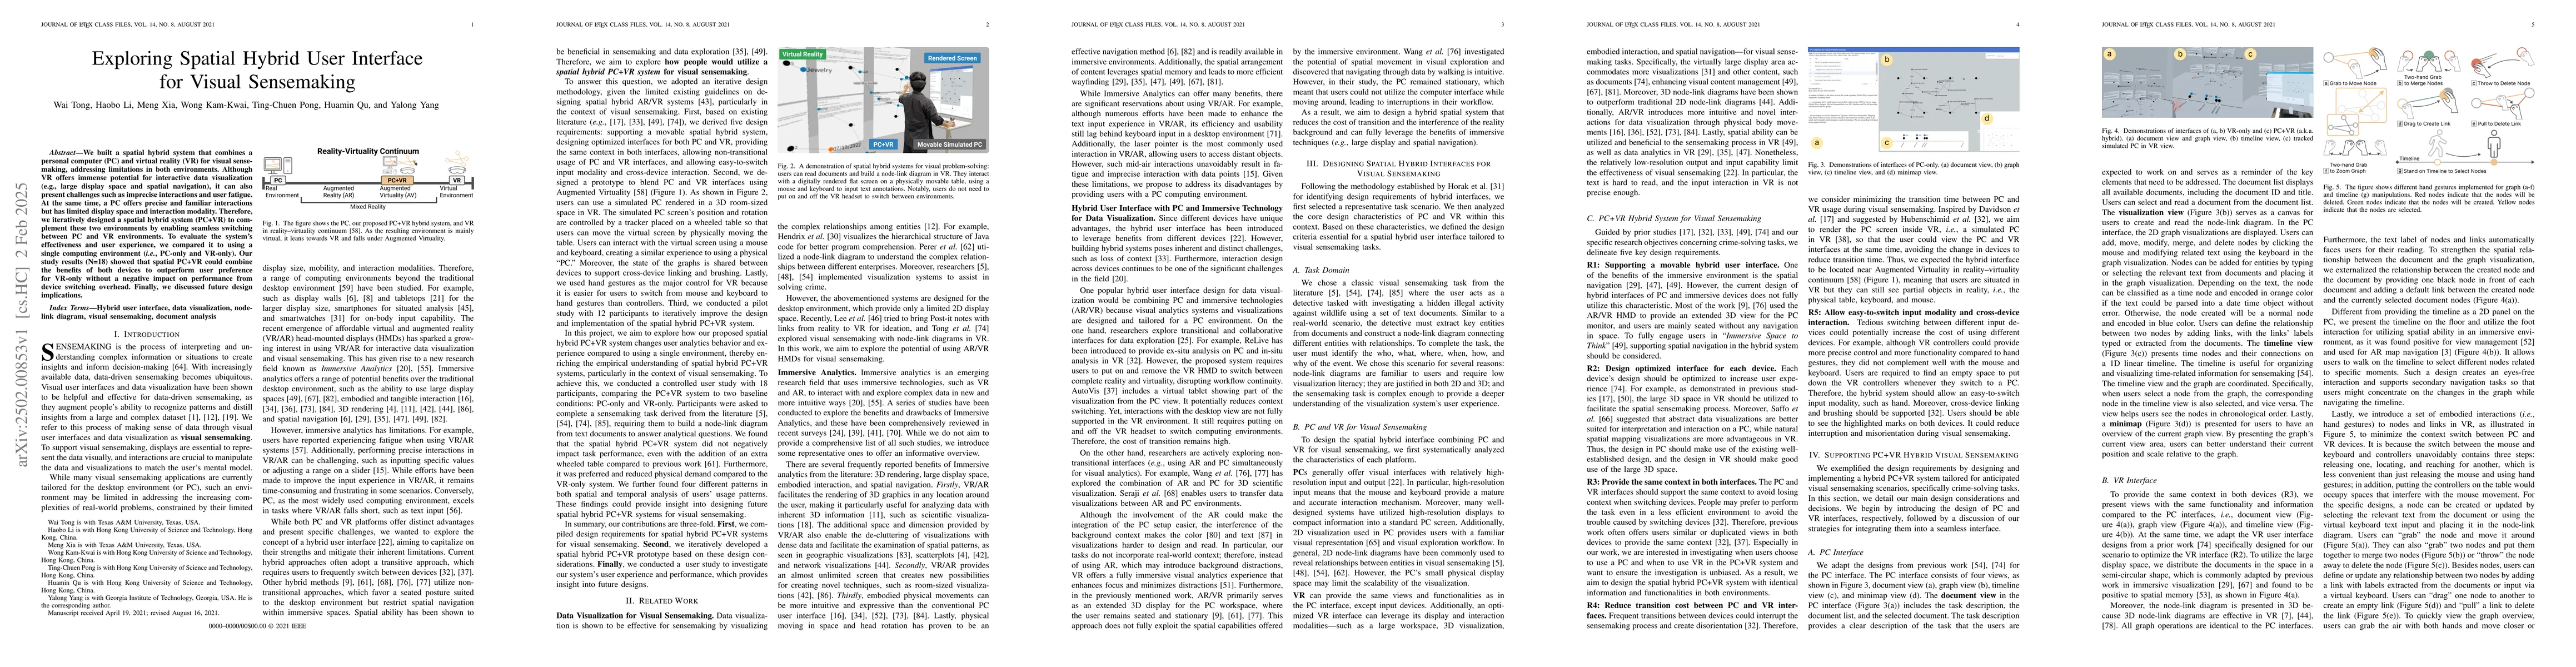
We built a spatial hybrid system that combines a personal computer (PC) and virtual reality (VR) for visual sensemaking, addressing limitations in both environments. Although VR offers immense potenti...
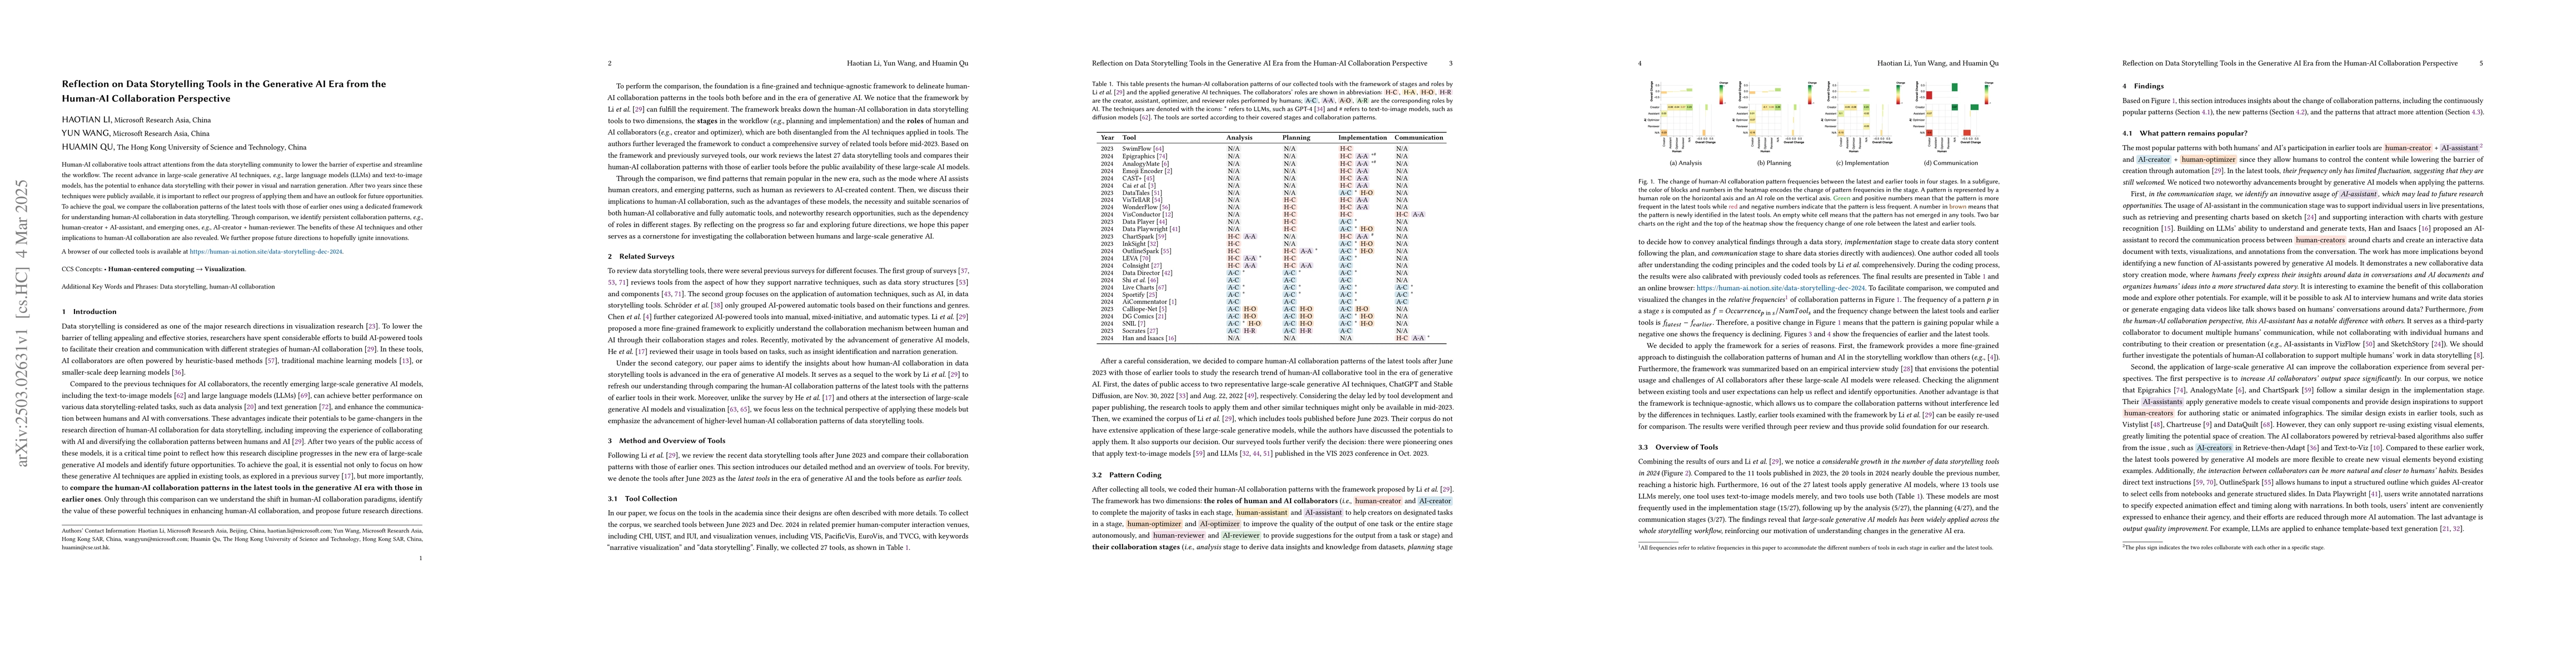
Human-AI collaborative tools attract attentions from the data storytelling community to lower the barrier of expertise and streamline the workflow. The recent advance in large-scale generative AI tech...
The emergence of generative AI (GenAI) models, including large language models and text-to-image models, has significantly advanced the synergy between humans and AI with not only their outstanding ca...
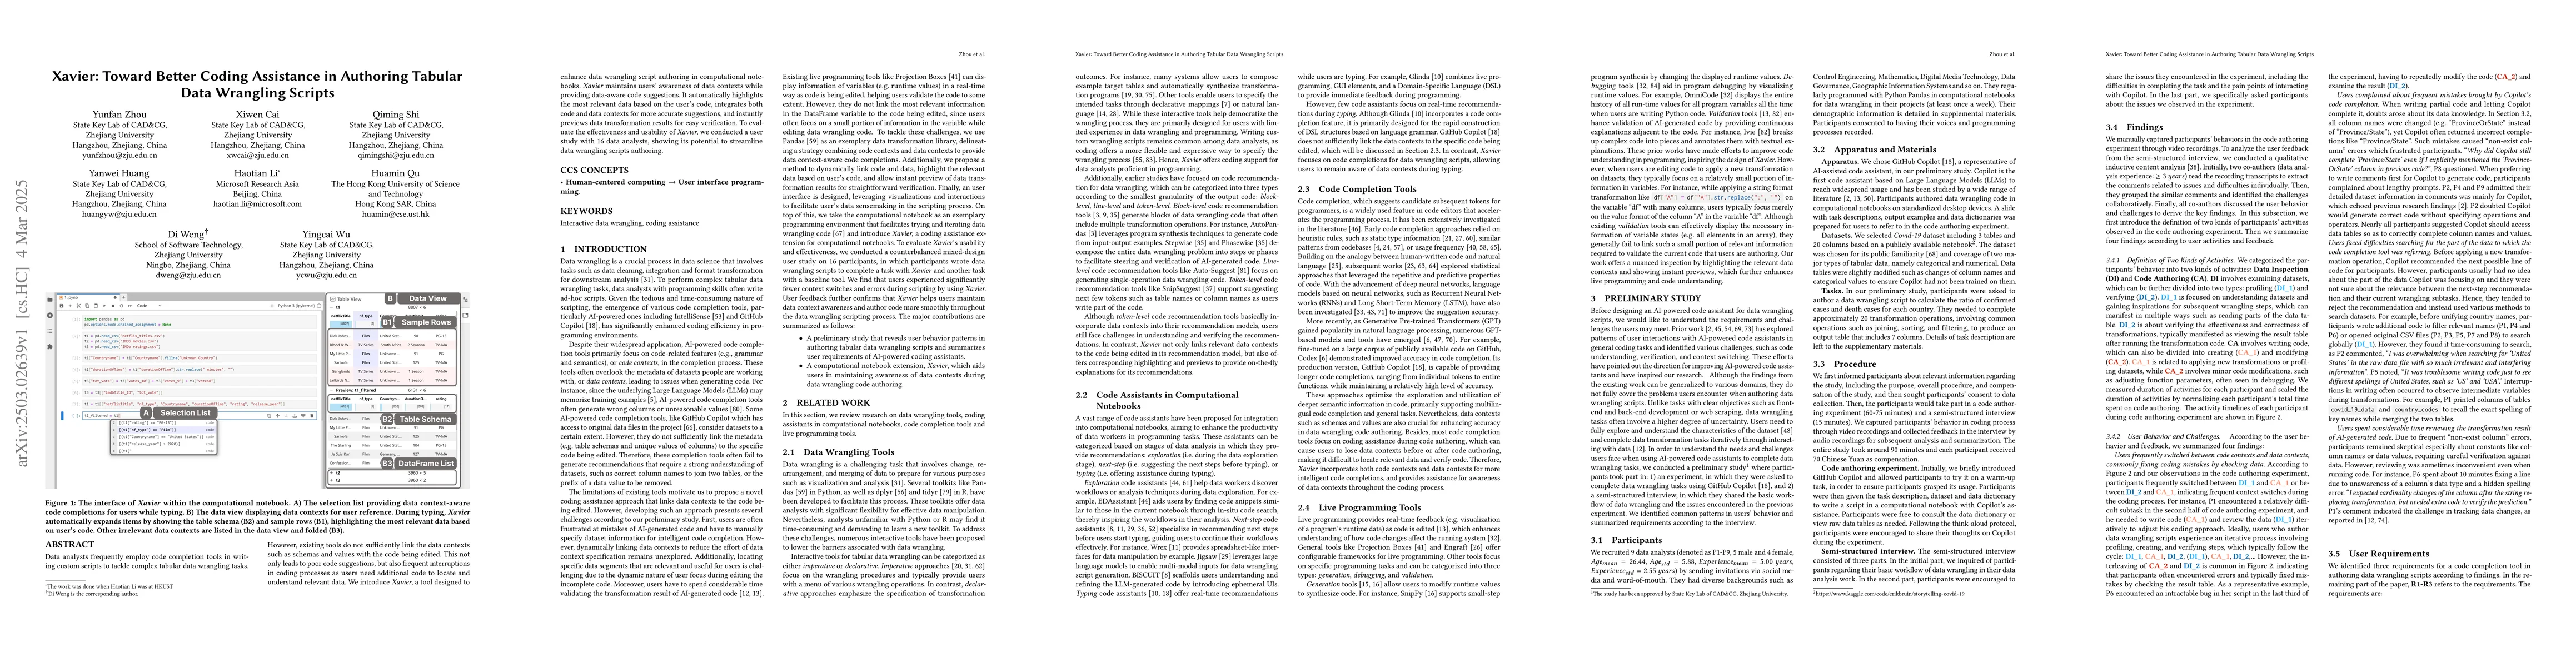
Data analysts frequently employ code completion tools in writing custom scripts to tackle complex tabular data wrangling tasks. However, existing tools do not sufficiently link the data contexts such ...
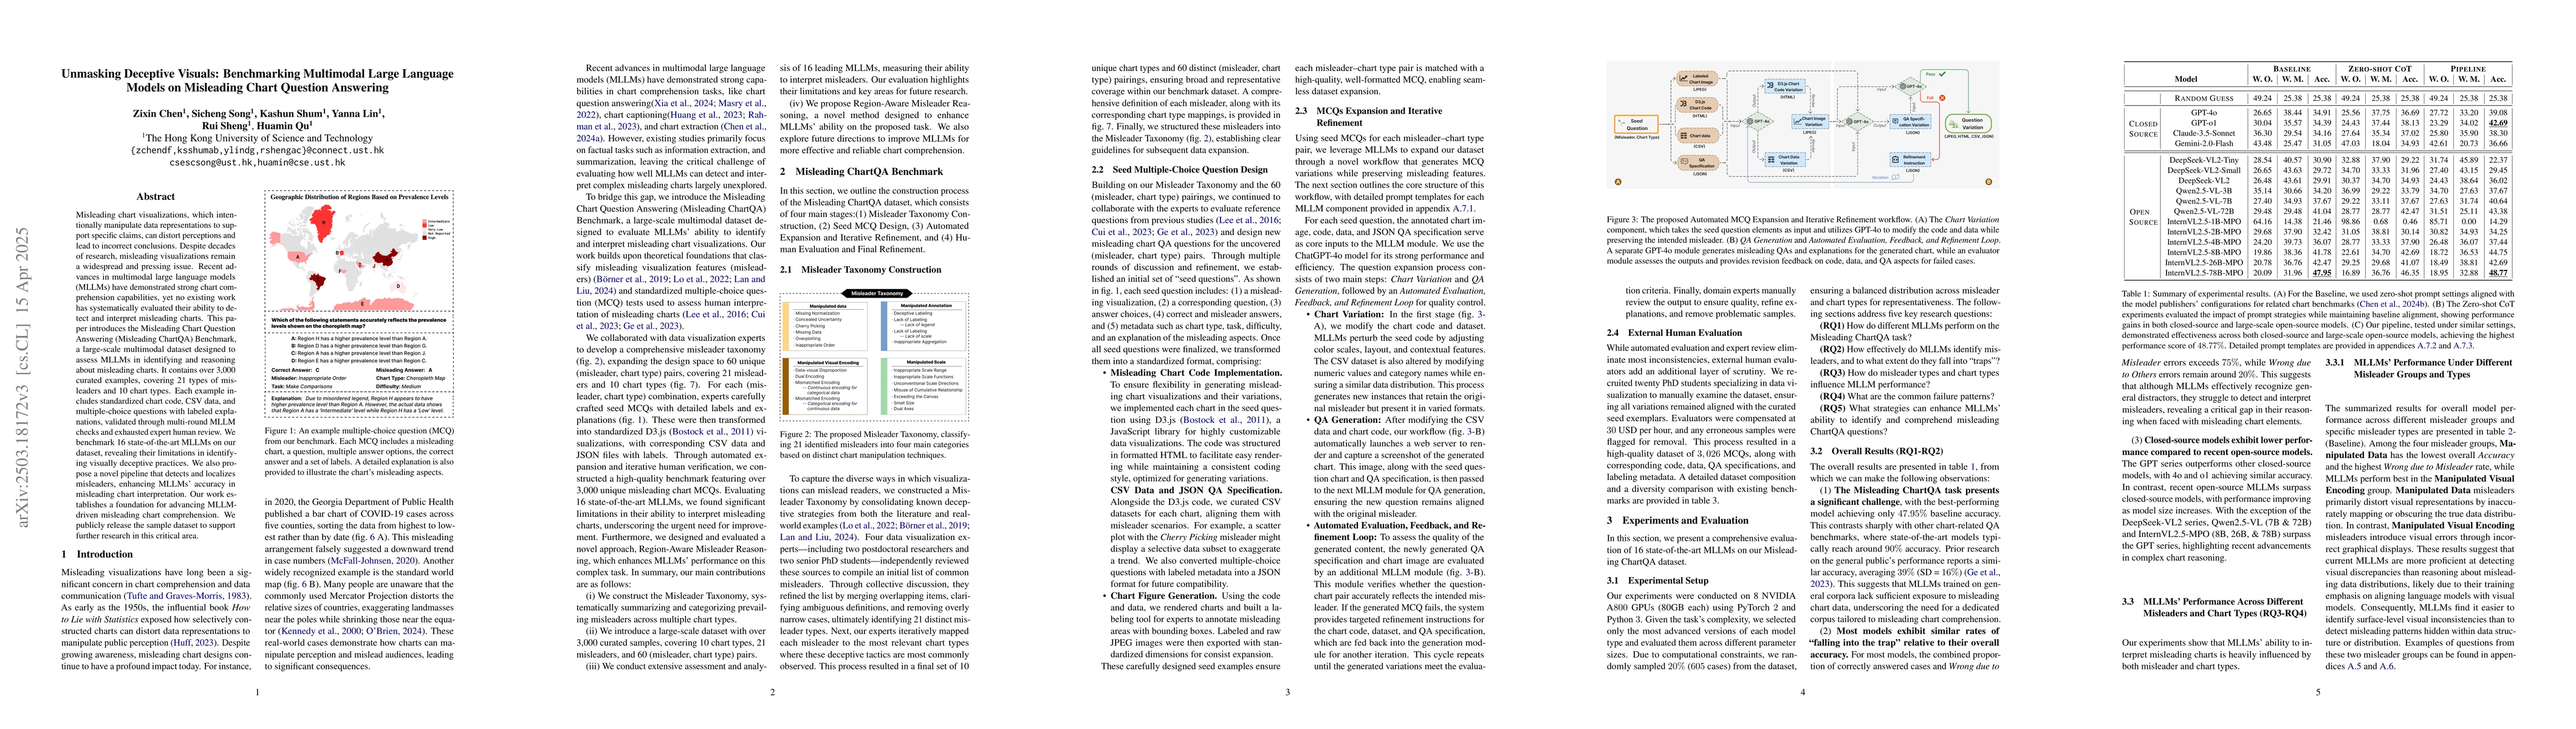
Misleading chart visualizations, which intentionally manipulate data representations to support specific claims, can distort perceptions and lead to incorrect conclusions. Despite decades of research,...
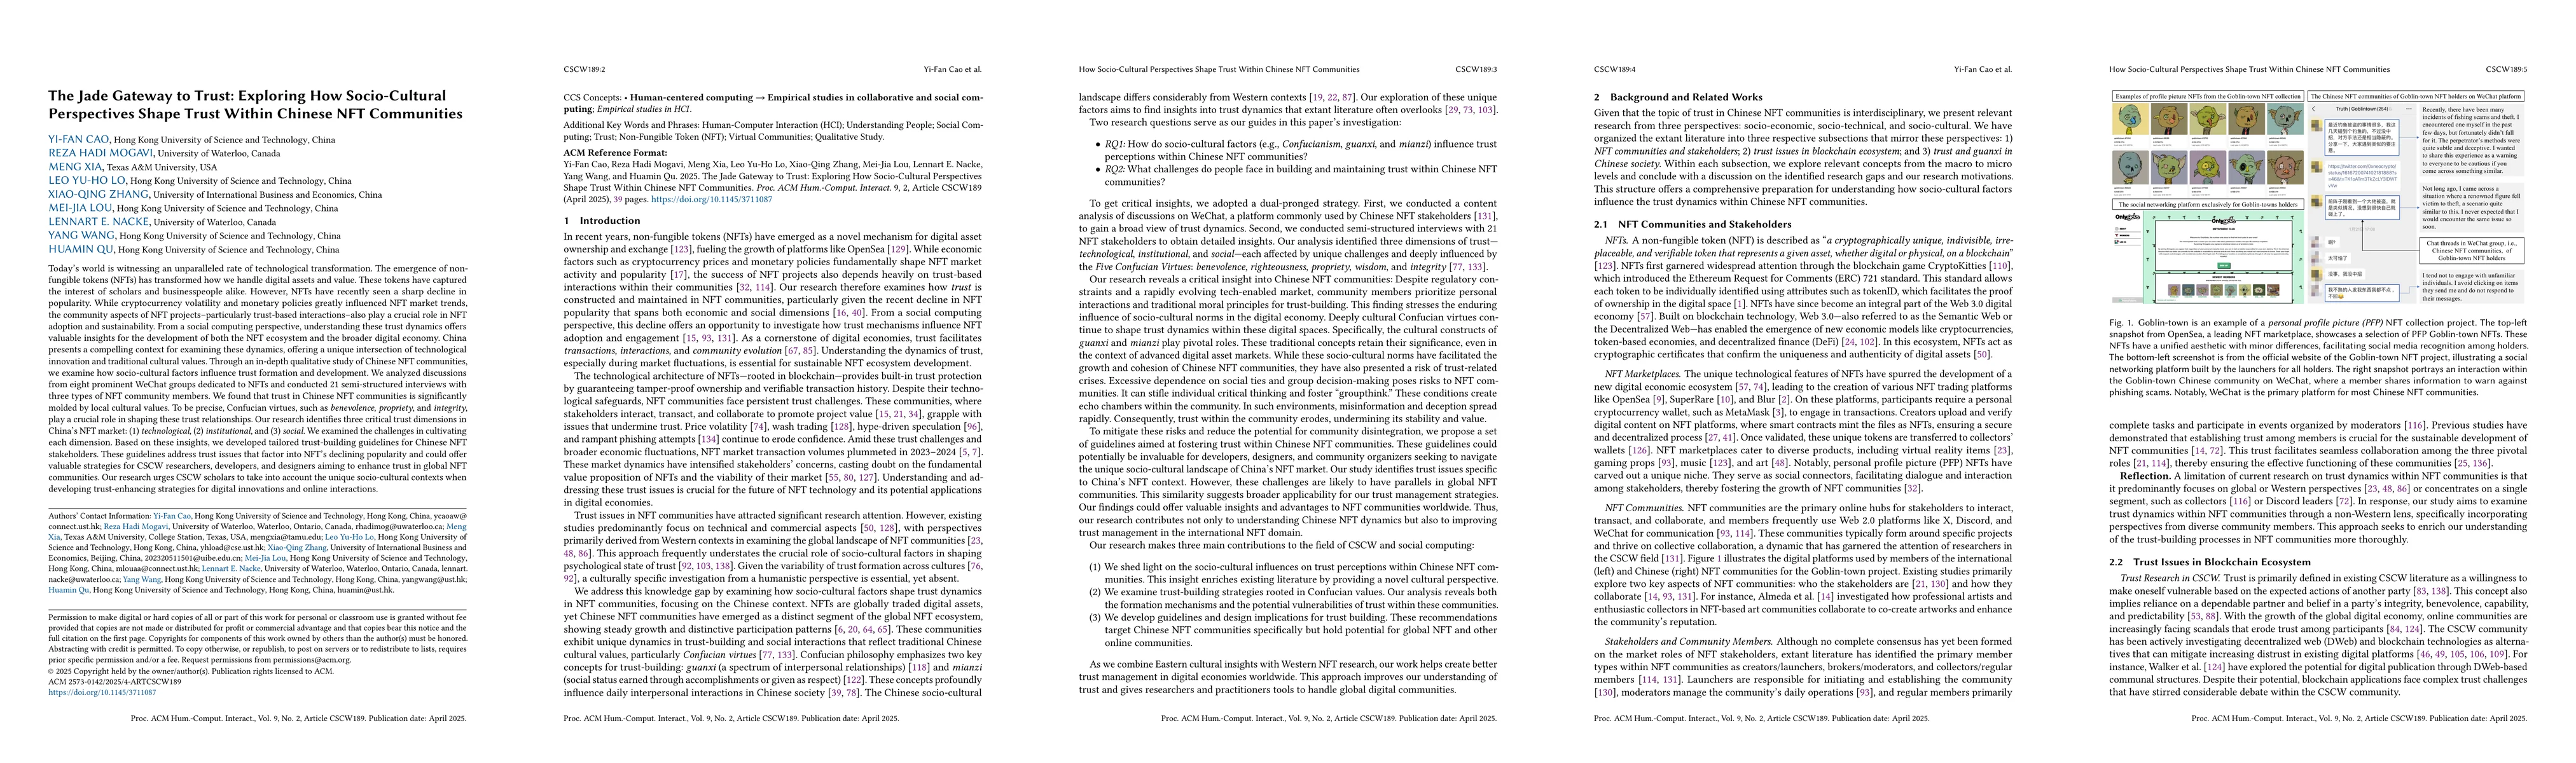
Today's world is witnessing an unparalleled rate of technological transformation. The emergence of non-fungible tokens (NFTs) has transformed how we handle digital assets and value. Despite their init...
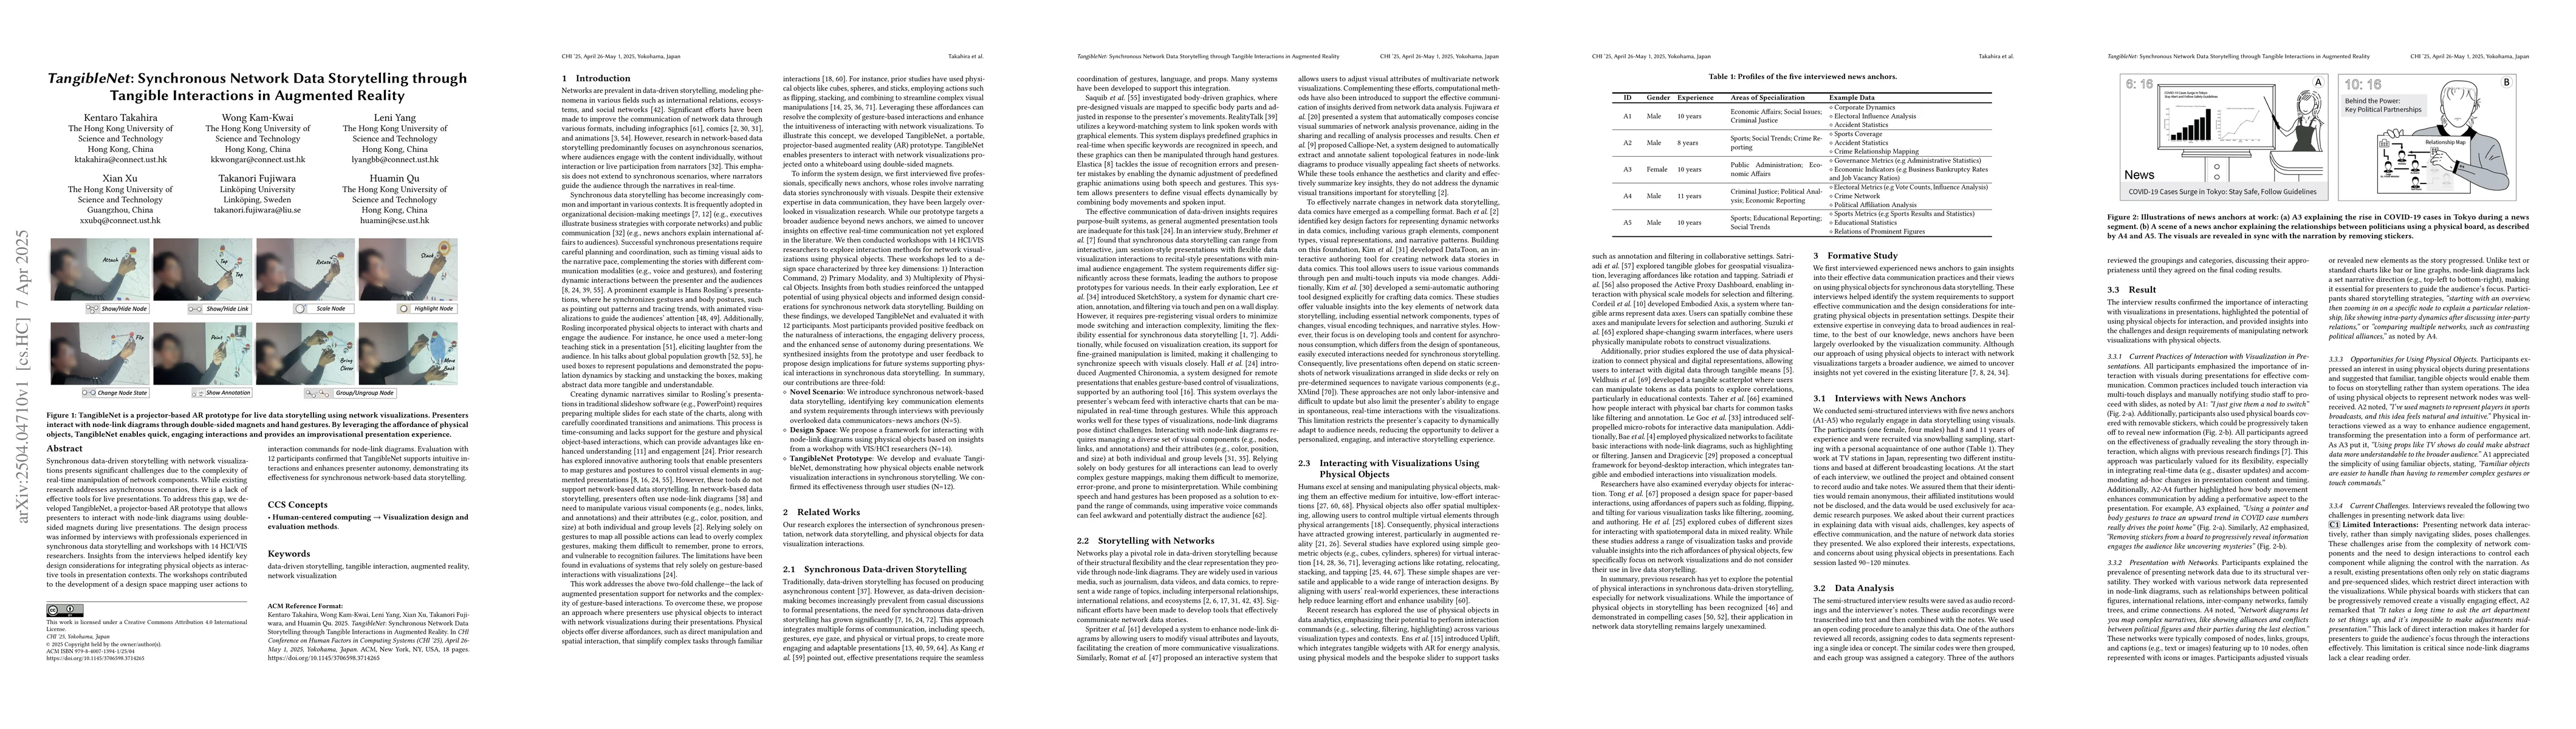
Synchronous data-driven storytelling with network visualizations presents significant challenges due to the complexity of real-time manipulation of network components. While existing research addresse...
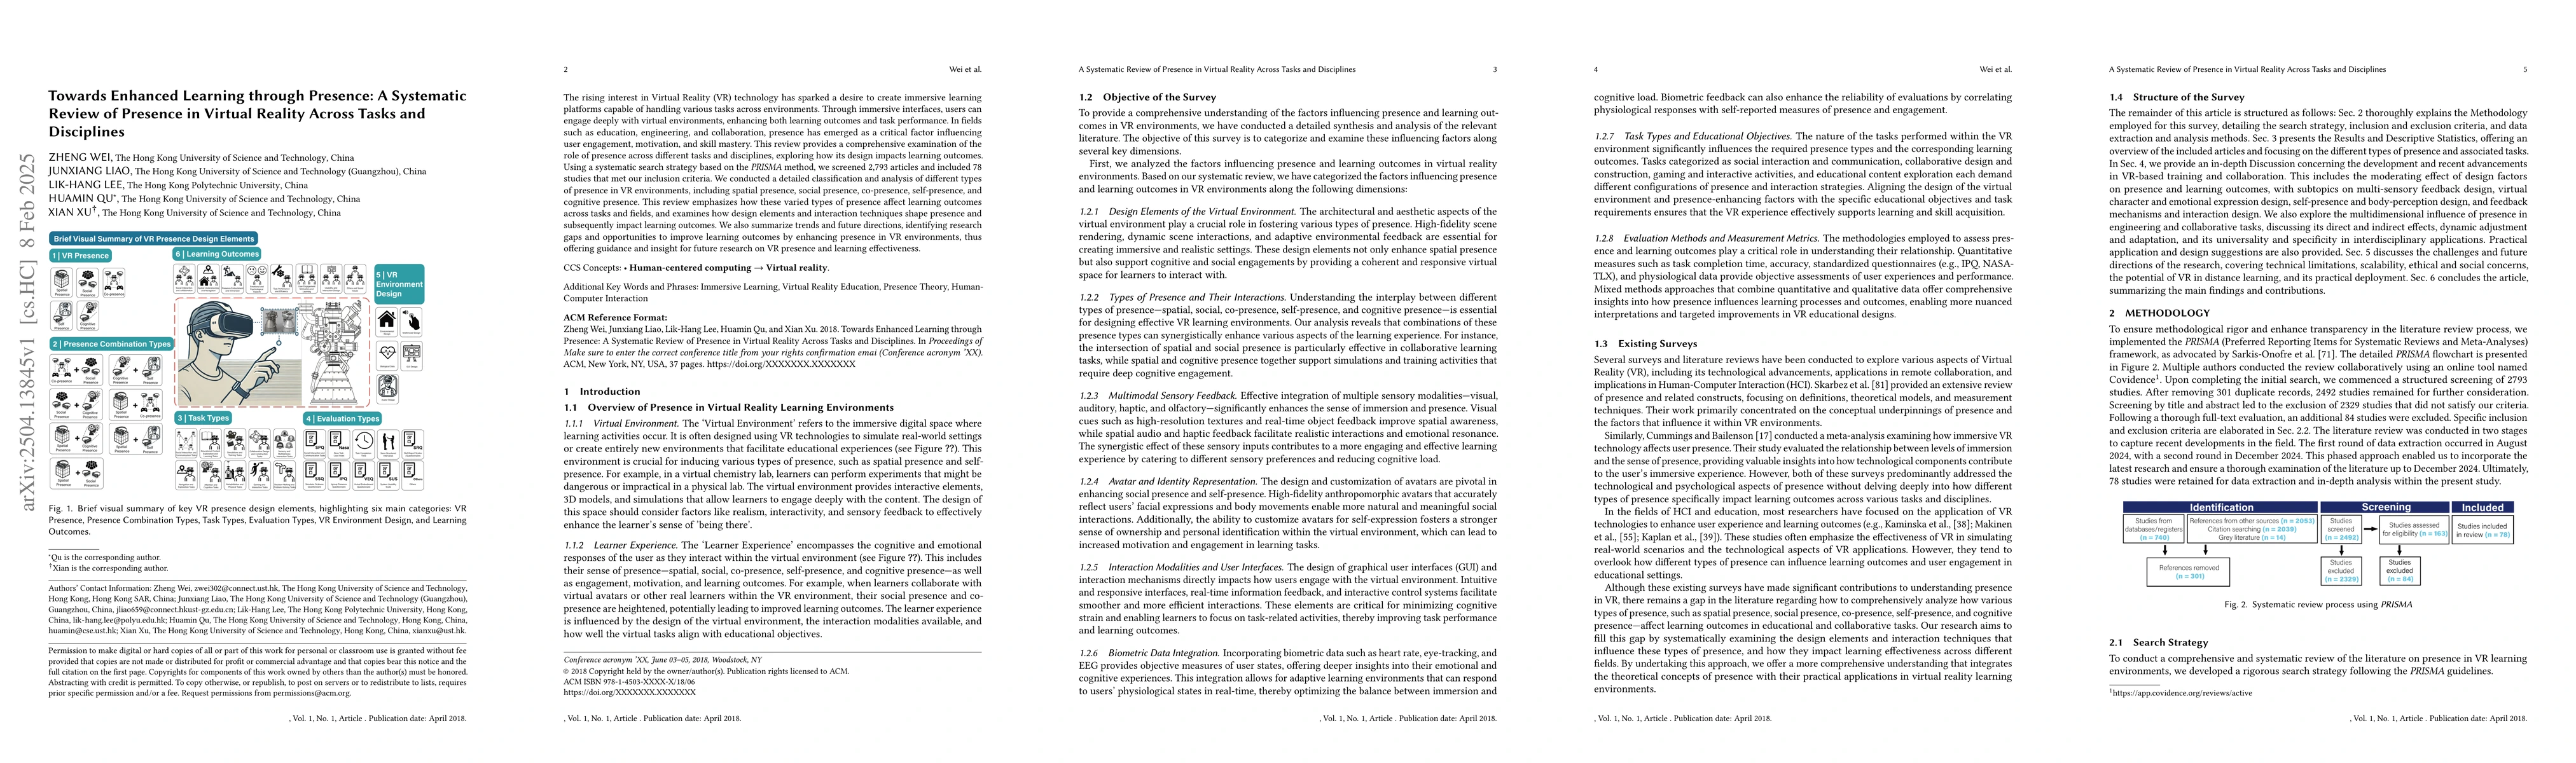
The rising interest in Virtual Reality (VR) technology has sparked a desire to create immersive learning platforms capable of handling various tasks across environments. Through immersive interfaces, ...
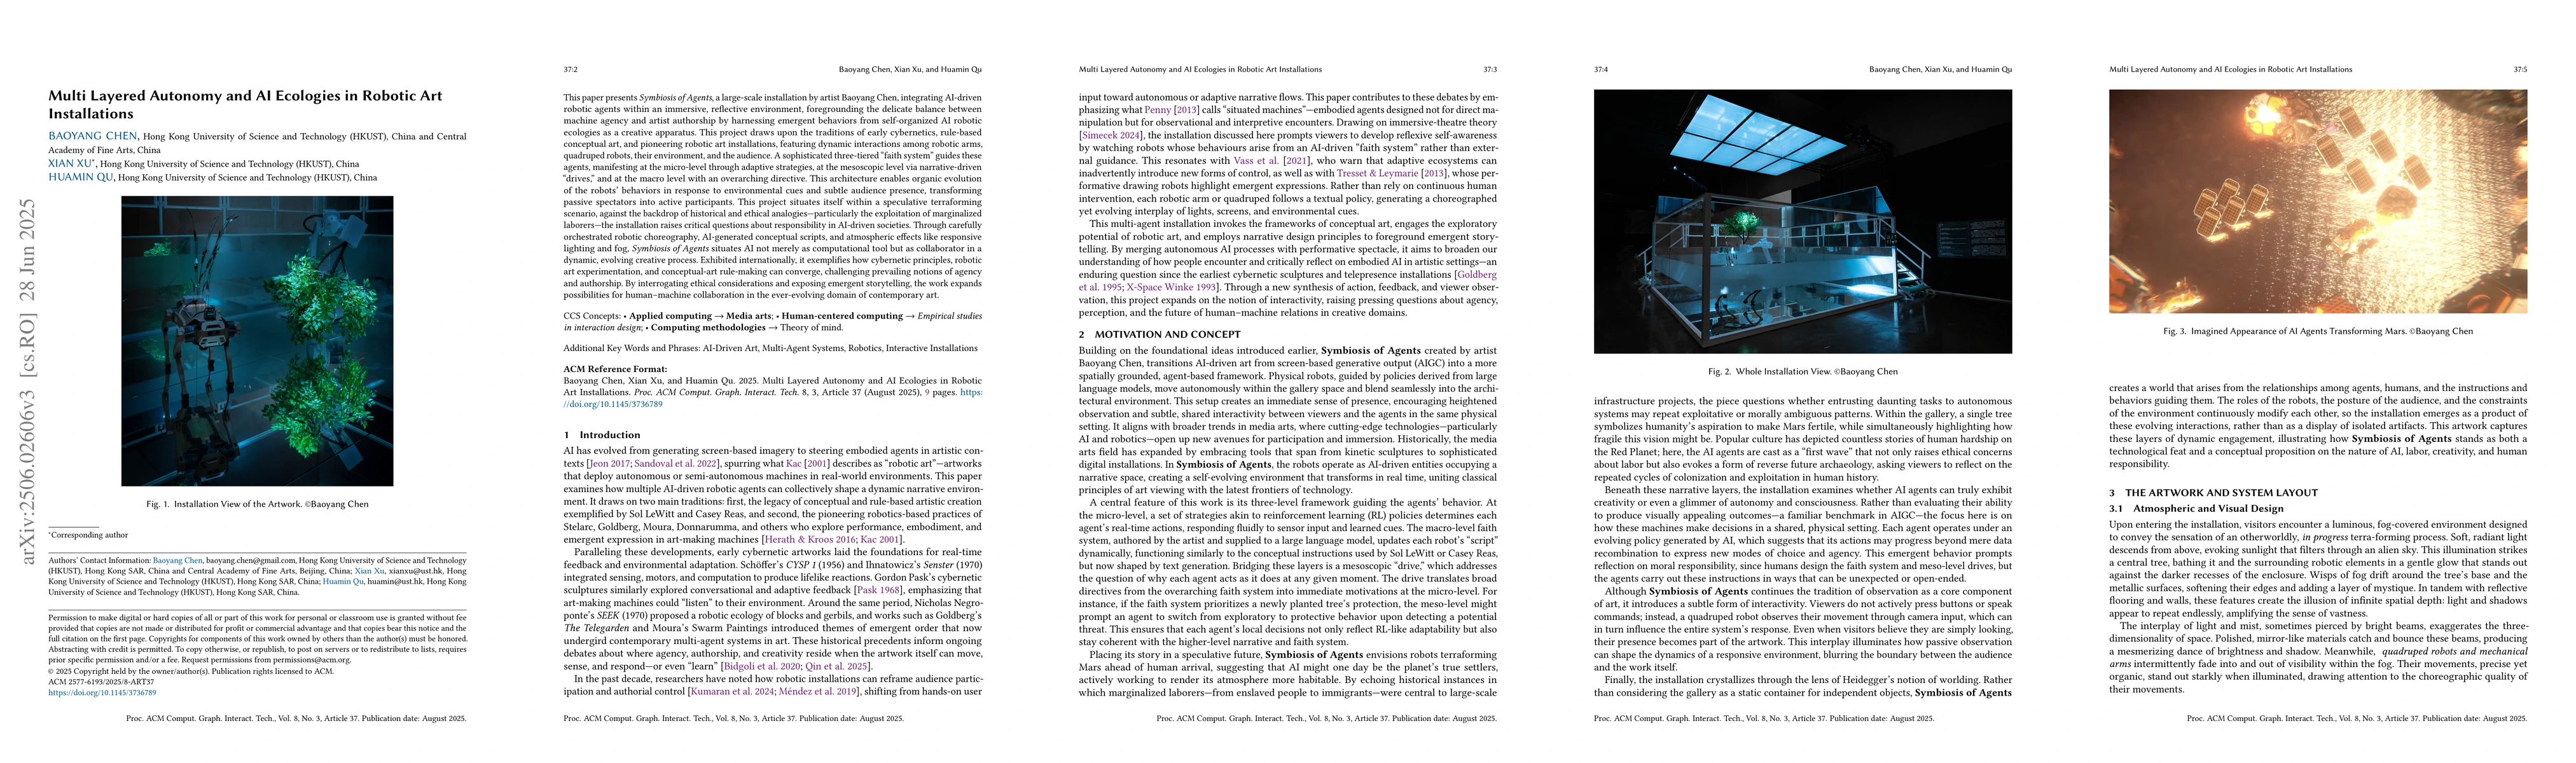
Symbiosis of Agents is a large-scale installation by Baoyang Chen (baoyangchen.com) that embeds AI-driven robots in an immersive, mirror-lined arena, probing the tension between machine agency and art...
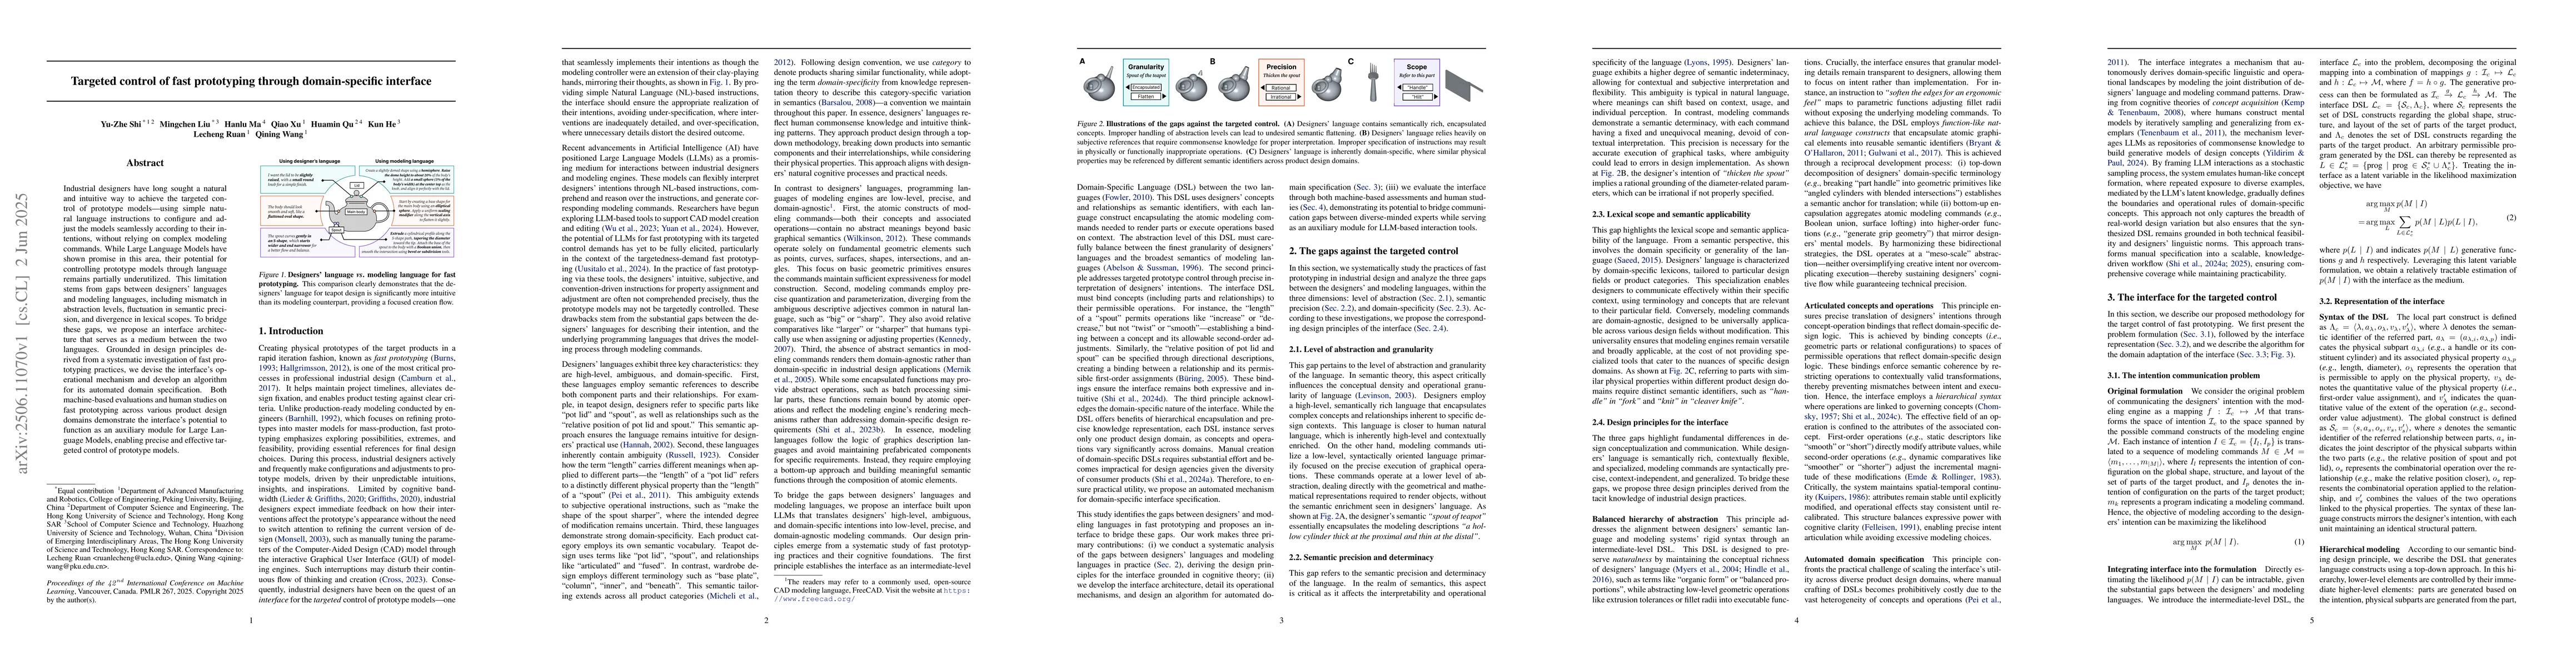
Industrial designers have long sought a natural and intuitive way to achieve the targeted control of prototype models -- using simple natural language instructions to configure and adjust the models s...
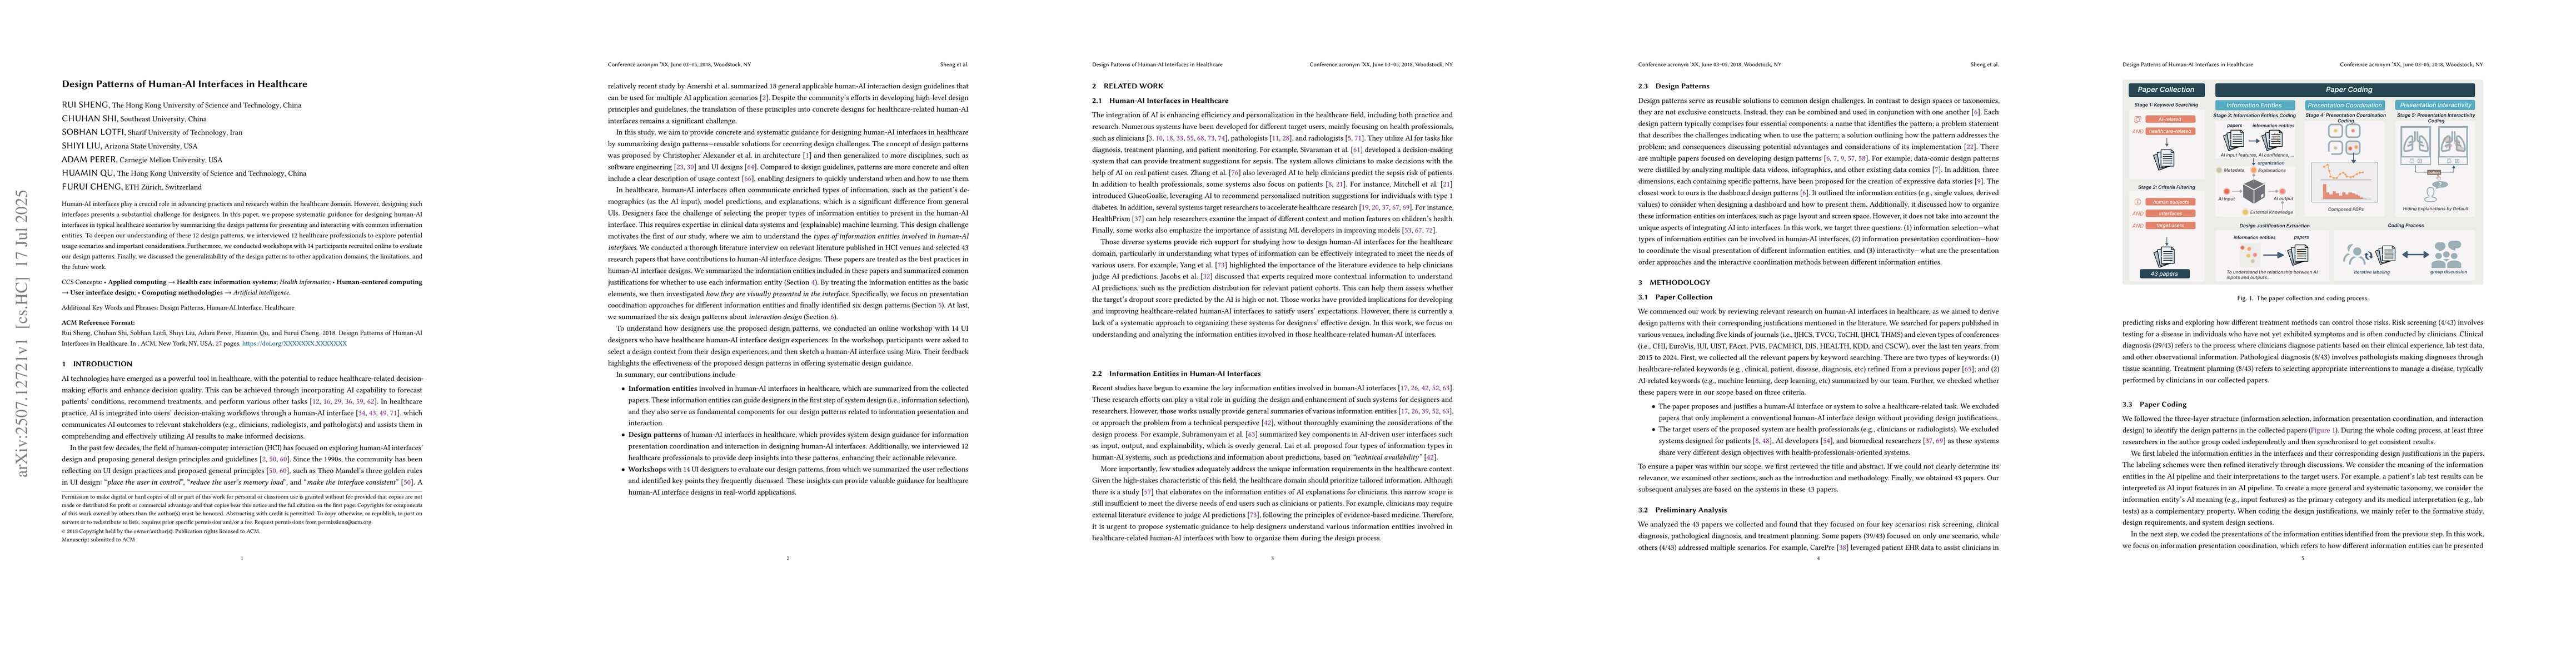
Human-AI interfaces play a crucial role in advancing practices and research within the healthcare domain. However, designing such interfaces presents a substantial challenge for designers. In this pap...
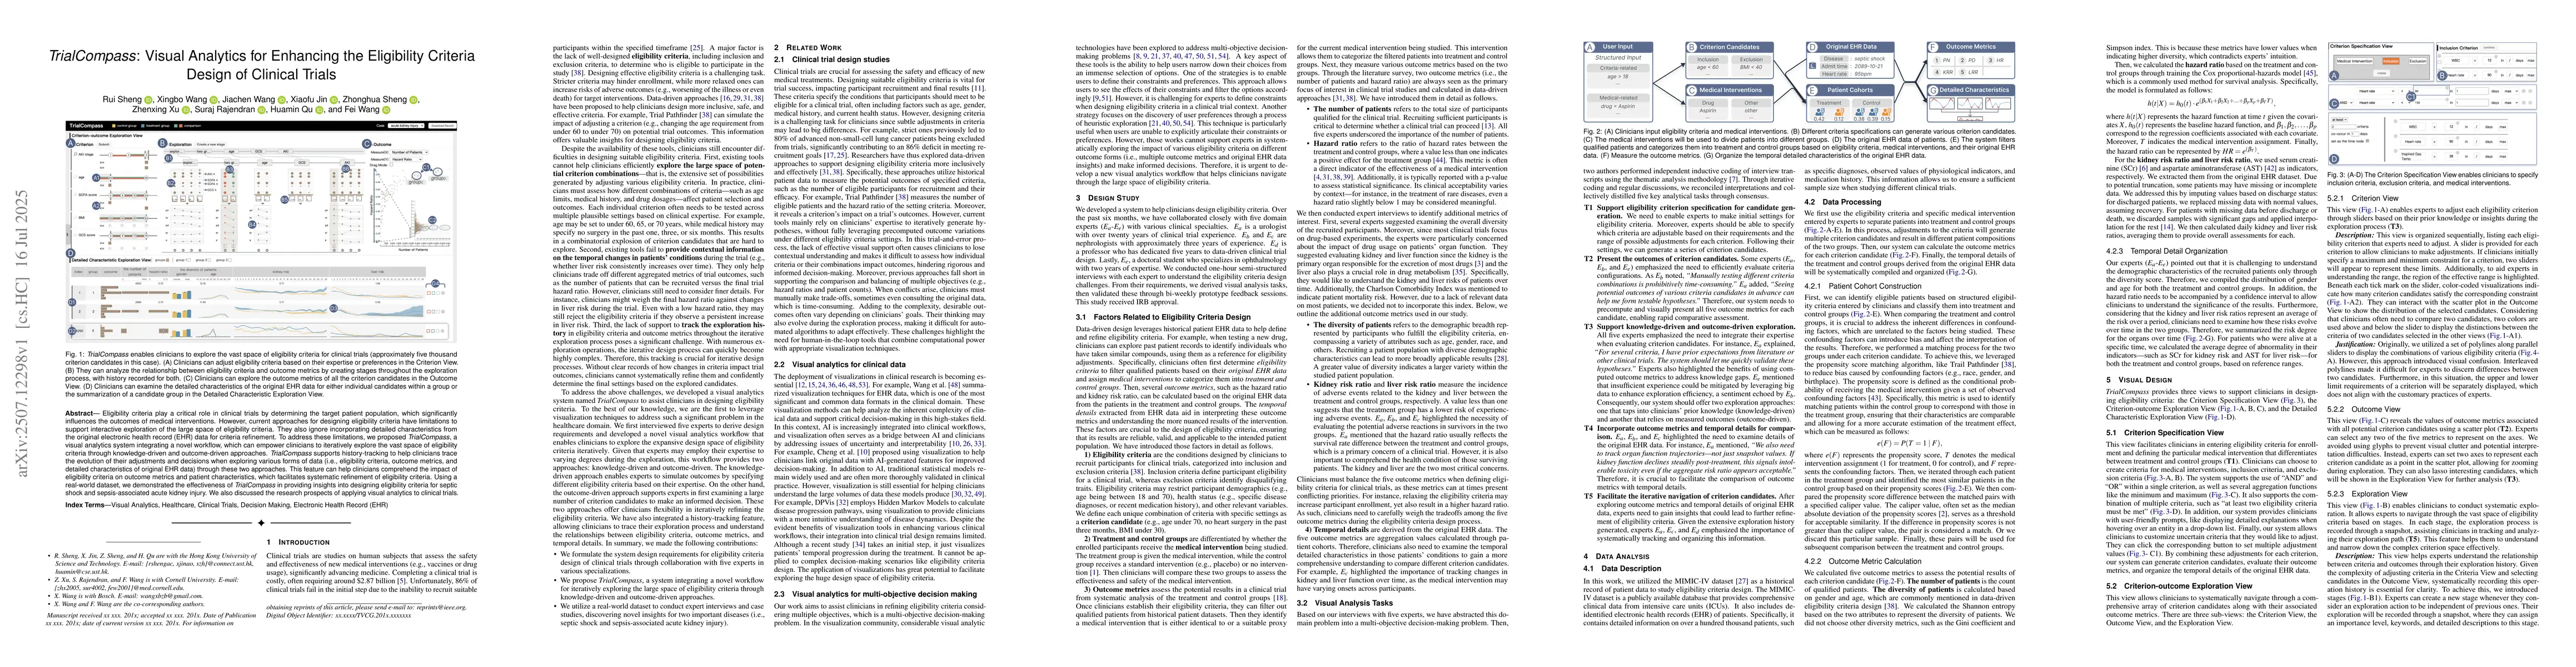
Eligibility criteria play a critical role in clinical trials by determining the target patient population, which significantly influences the outcomes of medical interventions. However, current approa...
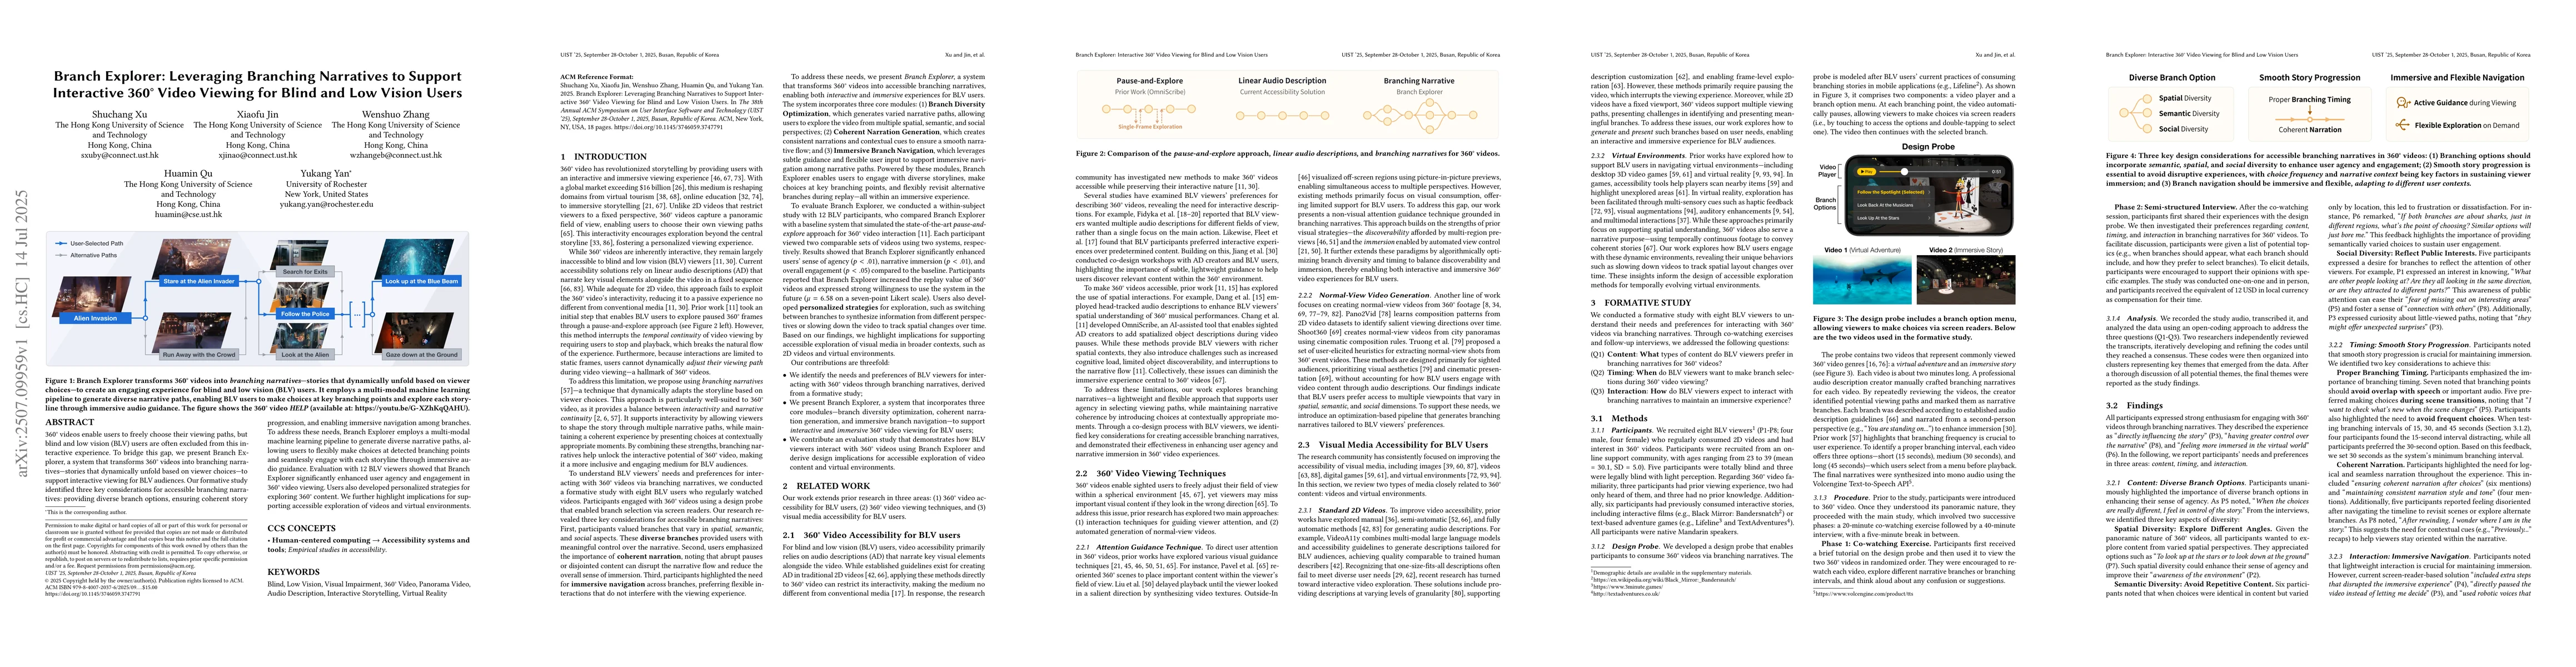
360{\deg} videos enable users to freely choose their viewing paths, but blind and low vision (BLV) users are often excluded from this interactive experience. To bridge this gap, we present Branch Expl...
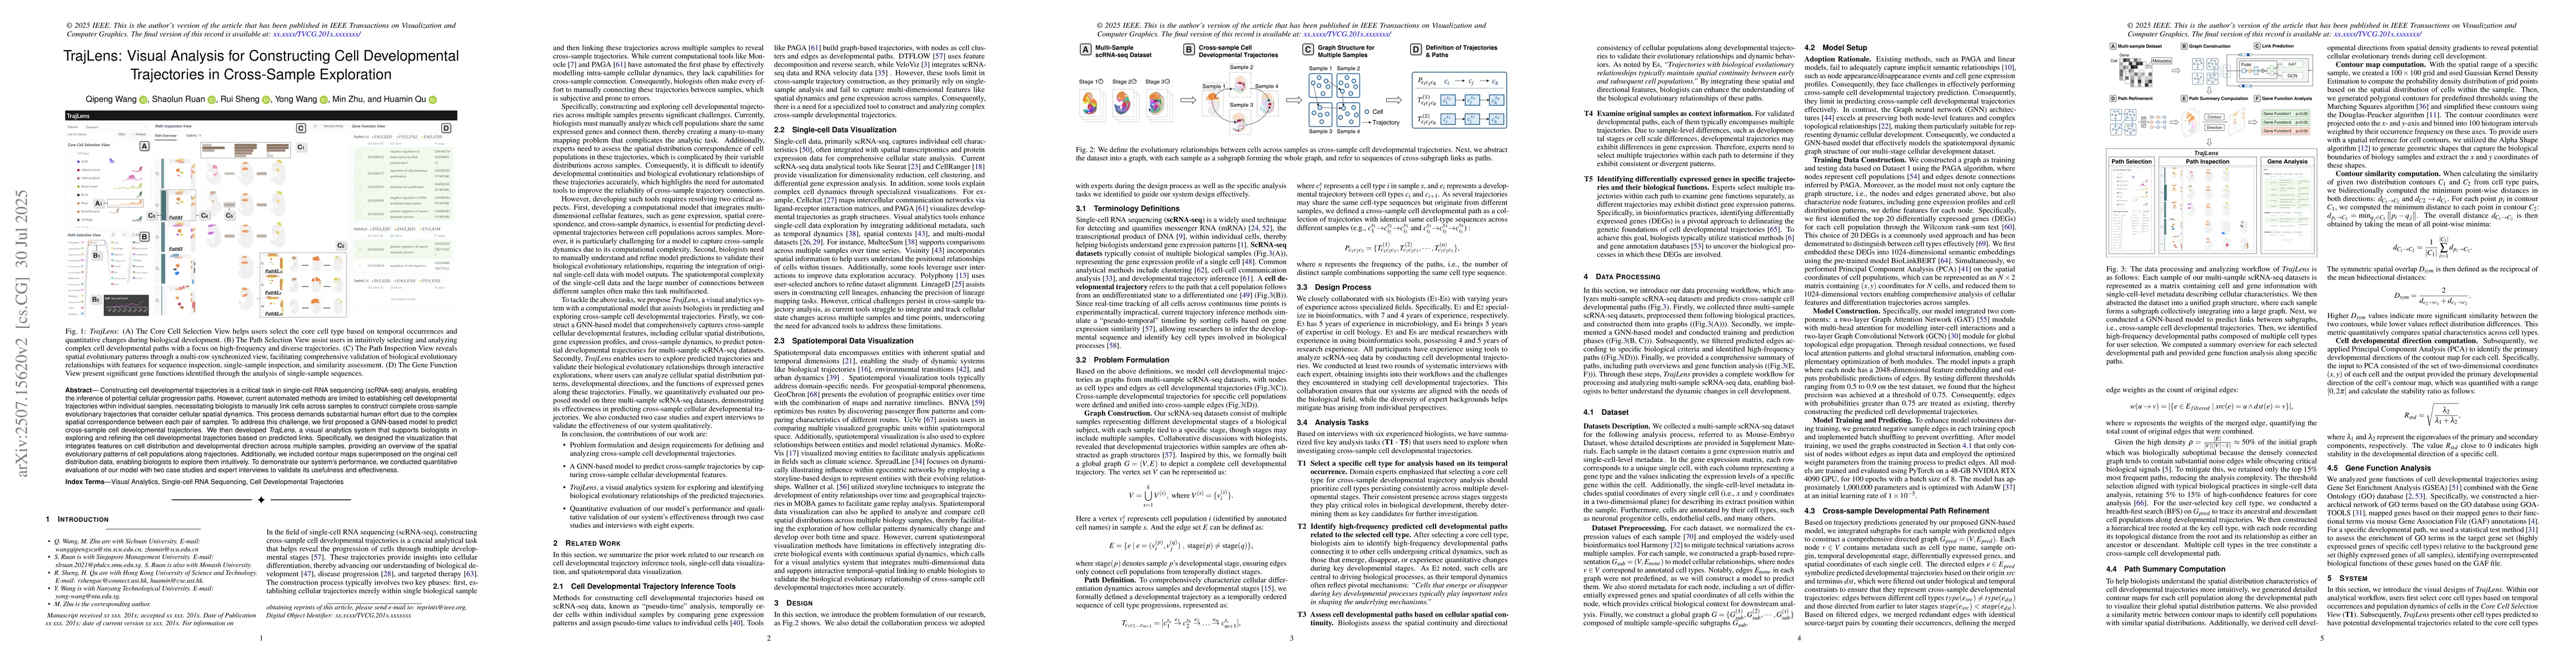
Constructing cell developmental trajectories is a critical task in single-cell RNA sequencing (scRNA-seq) analysis, enabling the inference of potential cellular progression paths. However, current aut...
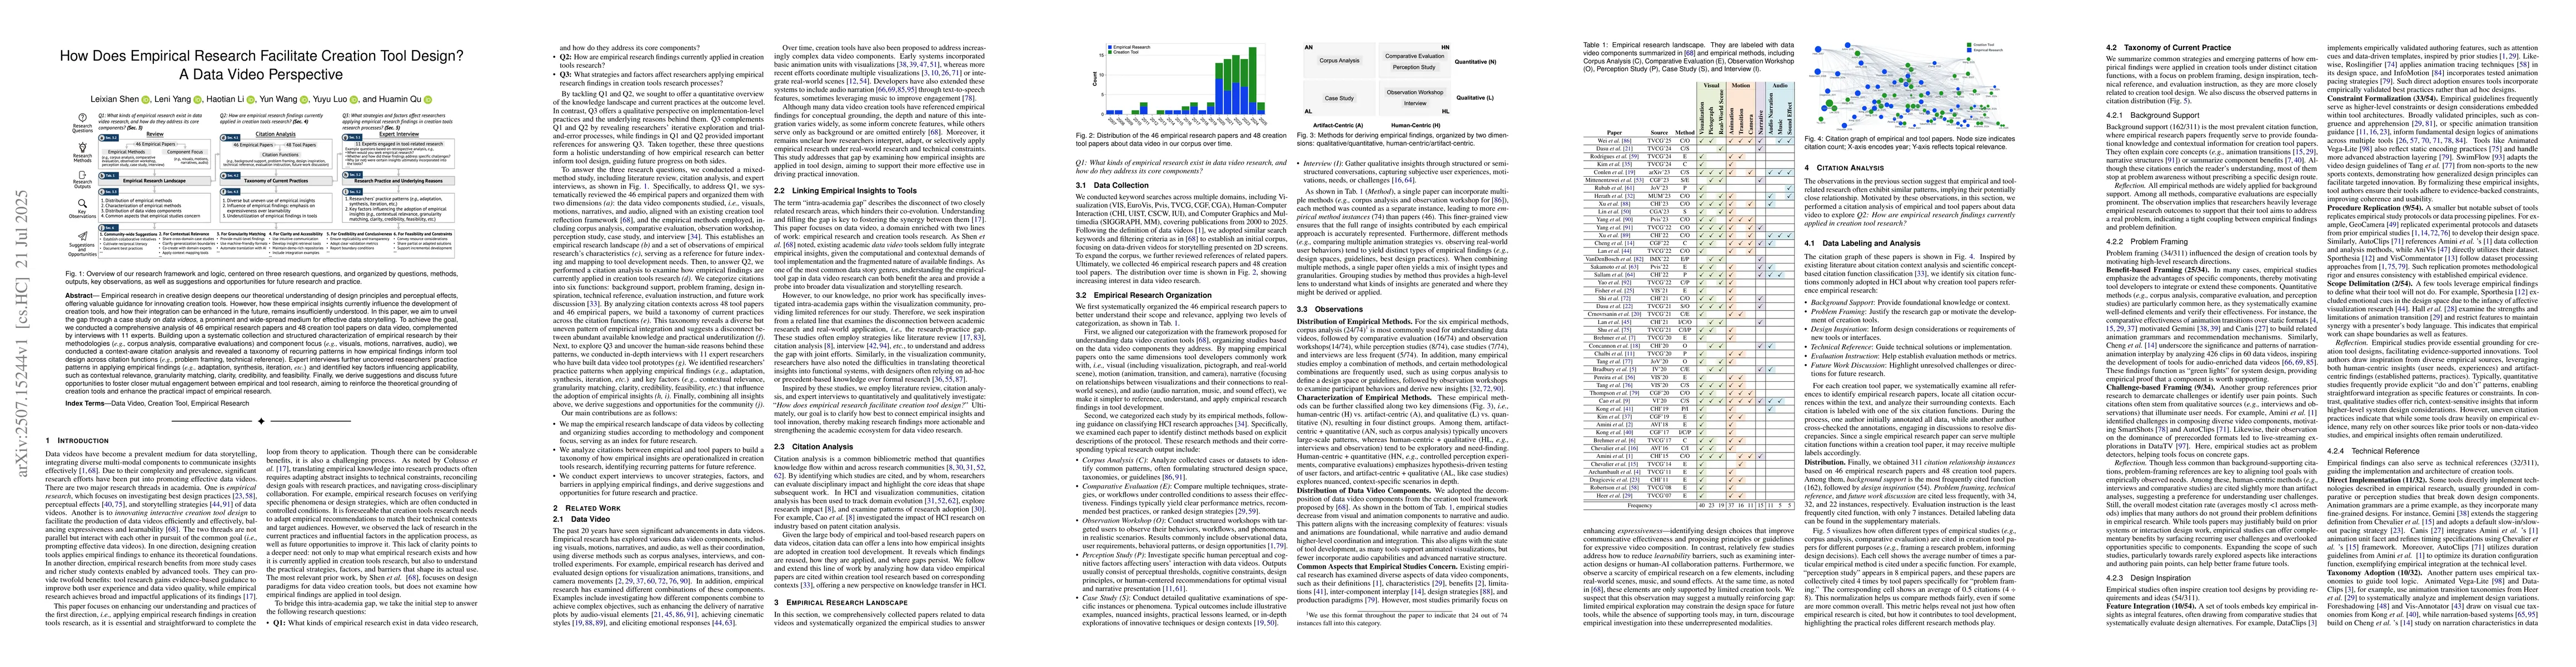
Empirical research in creative design deepens our theoretical understanding of design principles and perceptual effects, offering valuable guidance for innovating creation tools. However, how these em...
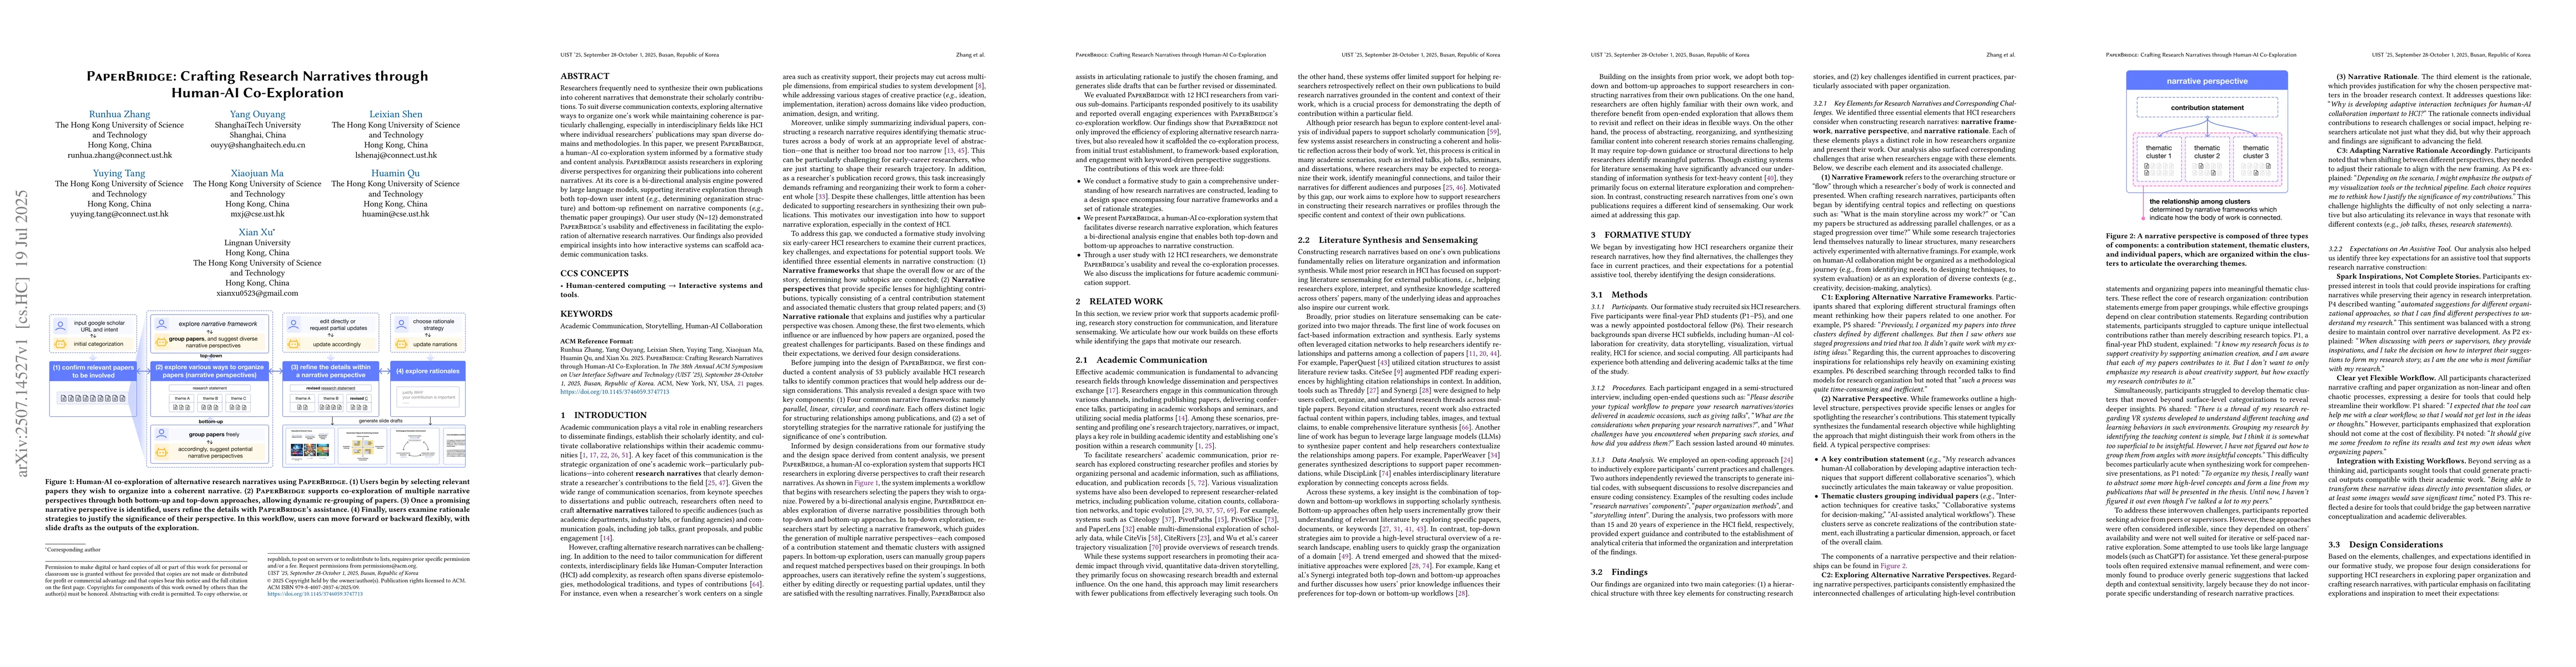
Researchers frequently need to synthesize their own publications into coherent narratives that demonstrate their scholarly contributions. To suit diverse communication contexts, exploring alternative ...
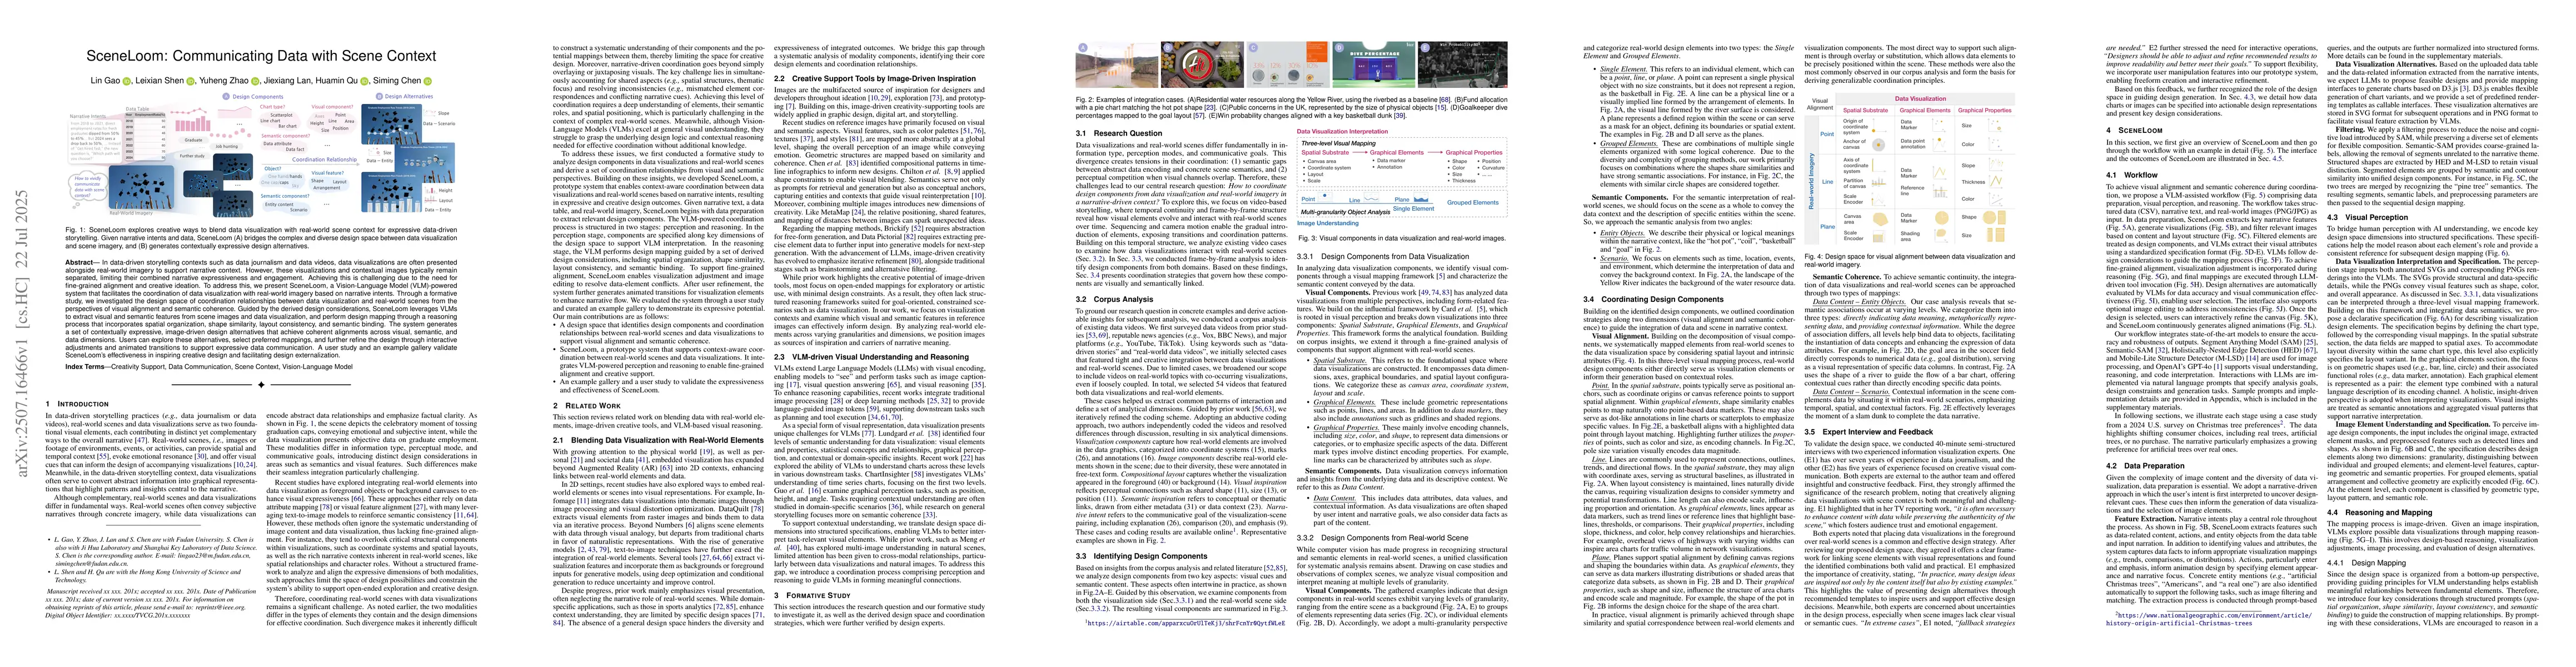
In data-driven storytelling contexts such as data journalism and data videos, data visualizations are often presented alongside real-world imagery to support narrative context. However, these visualiz...
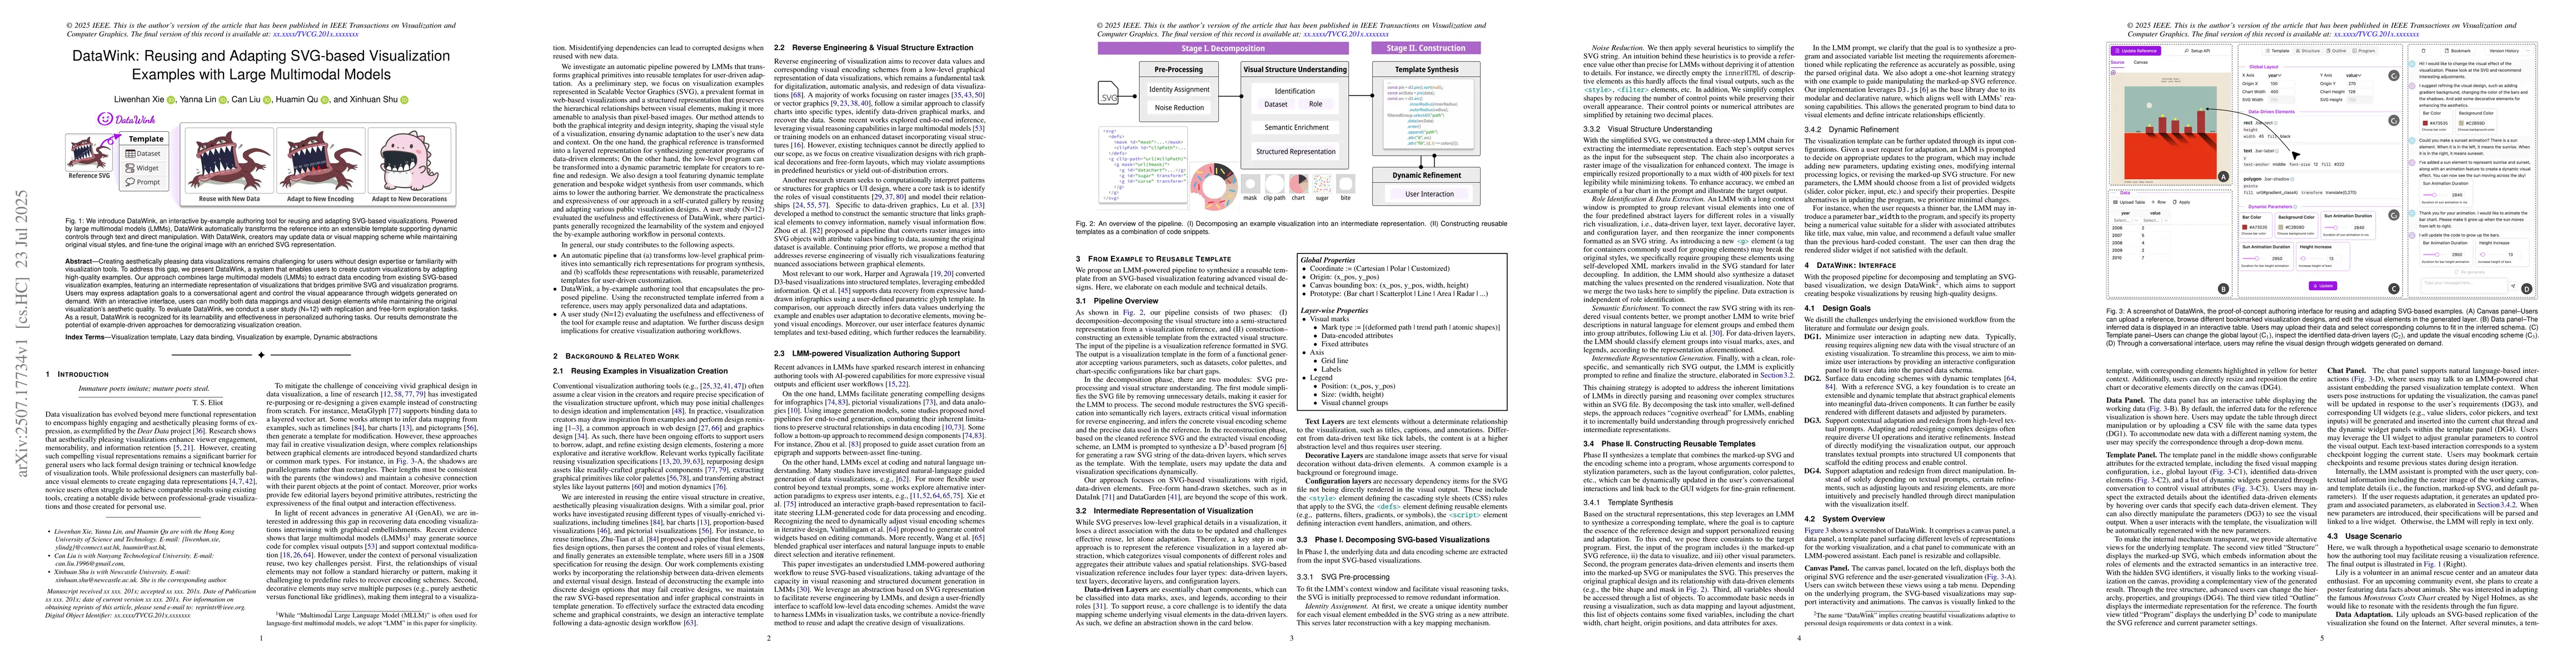
Creating aesthetically pleasing data visualizations remains challenging for users without design expertise or familiarity with visualization tools. To address this gap, we present DataWink, a system t...
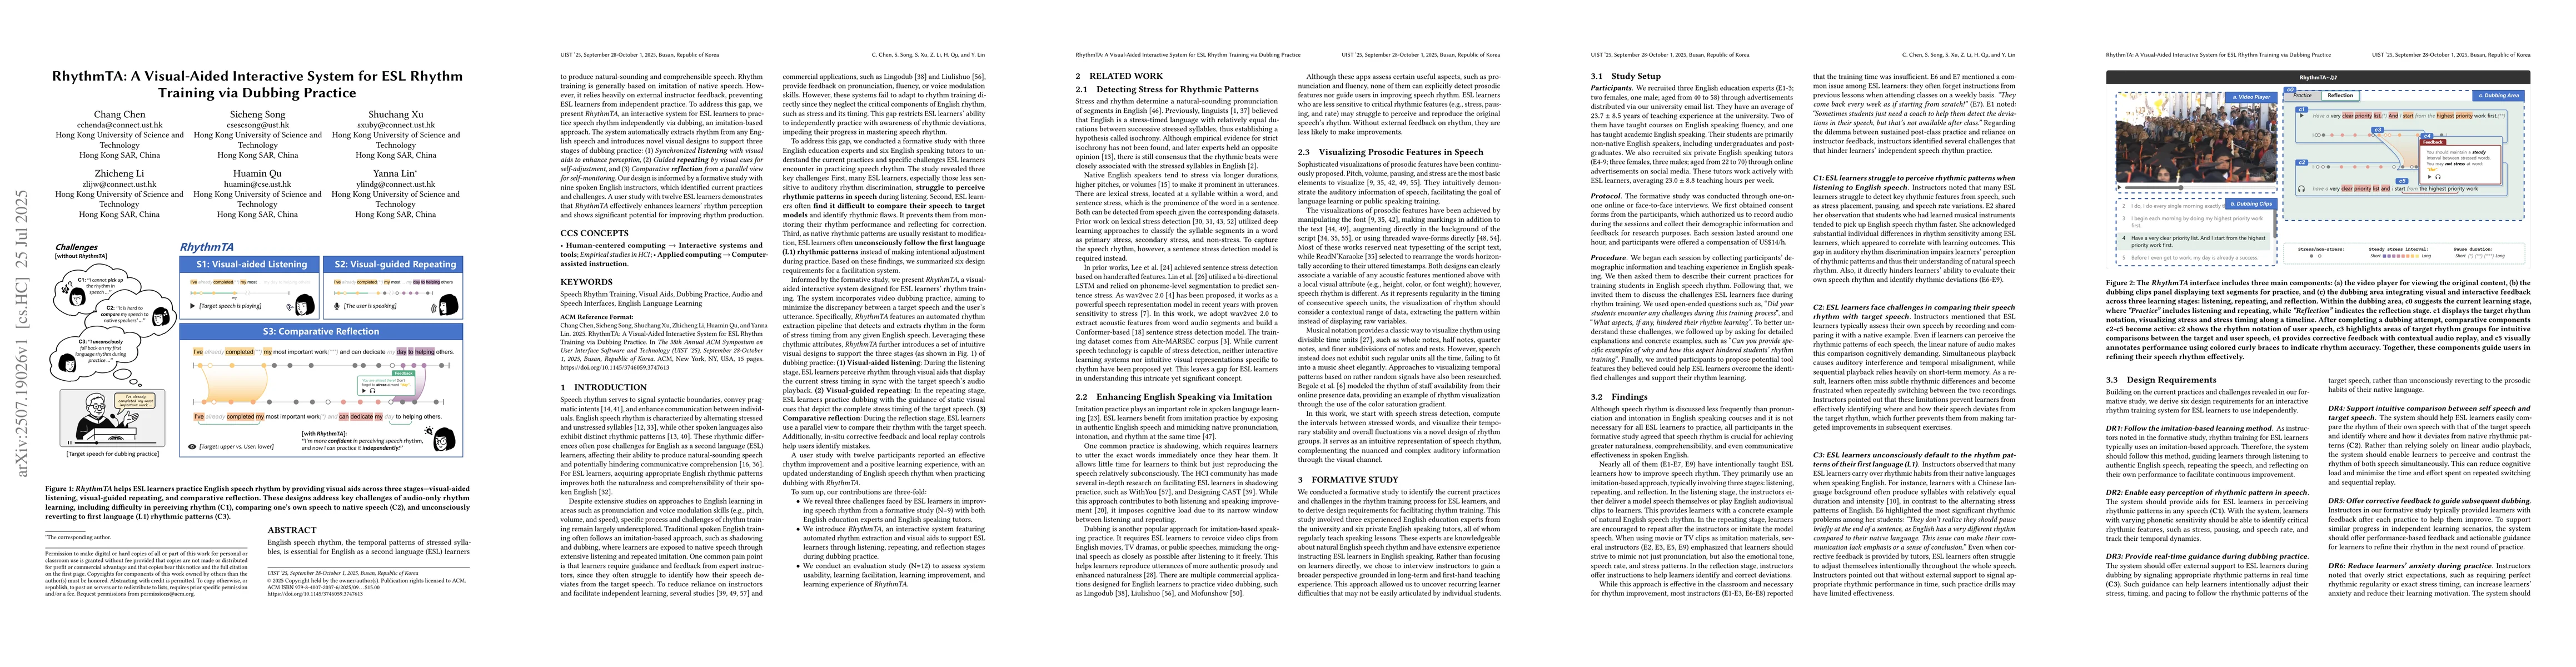
English speech rhythm, the temporal patterns of stressed syllables, is essential for English as a second language (ESL) learners to produce natural-sounding and comprehensible speech. Rhythm training ...
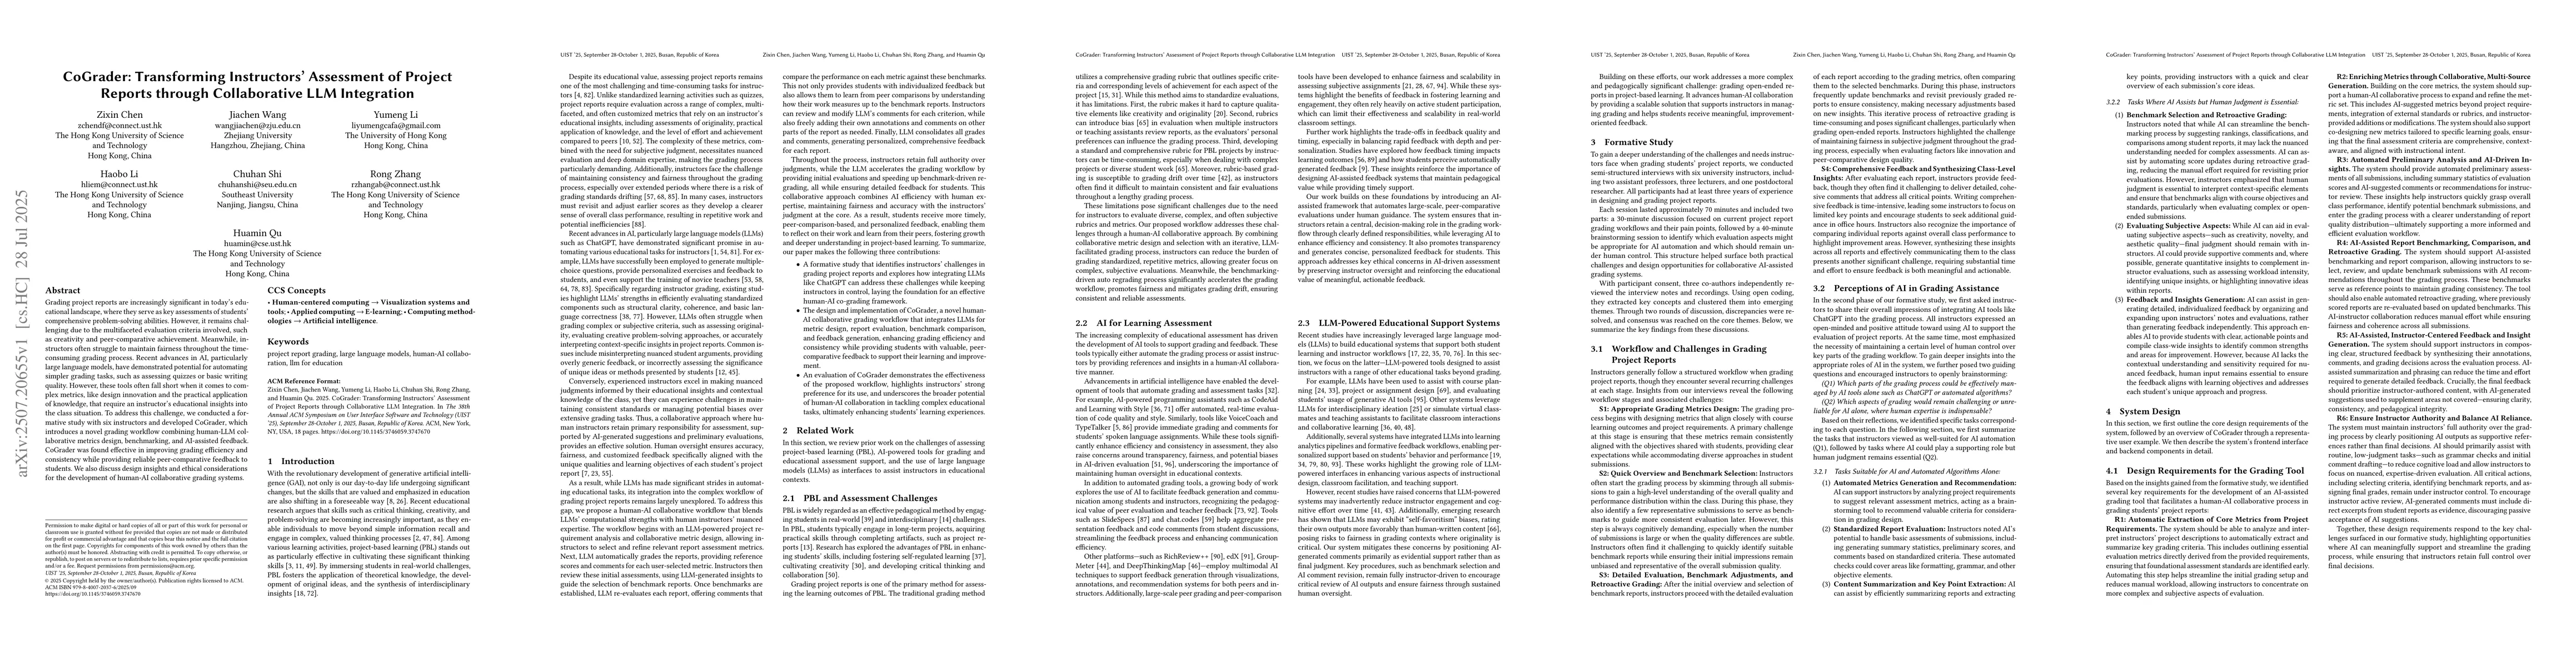
Grading project reports are increasingly significant in today's educational landscape, where they serve as key assessments of students' comprehensive problem-solving abilities. However, it remains cha...
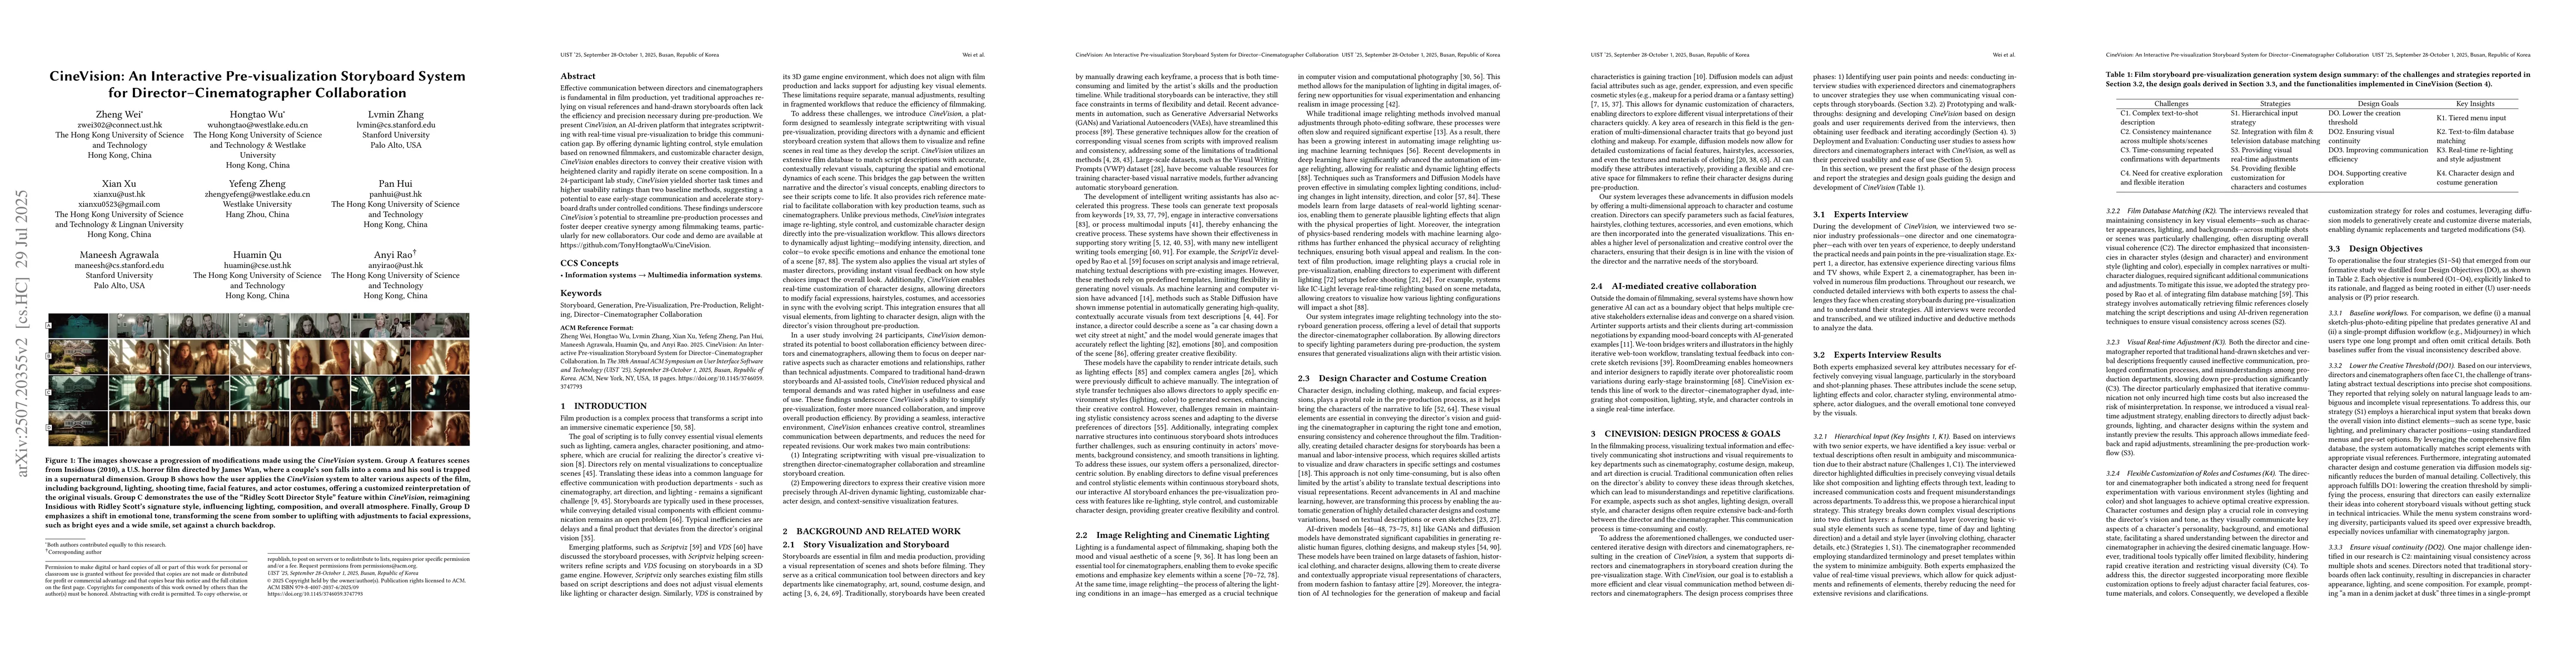
Effective communication between directors and cinematographers is fundamental in film production, yet traditional approaches relying on visual references and hand-drawn storyboards often lack the effi...
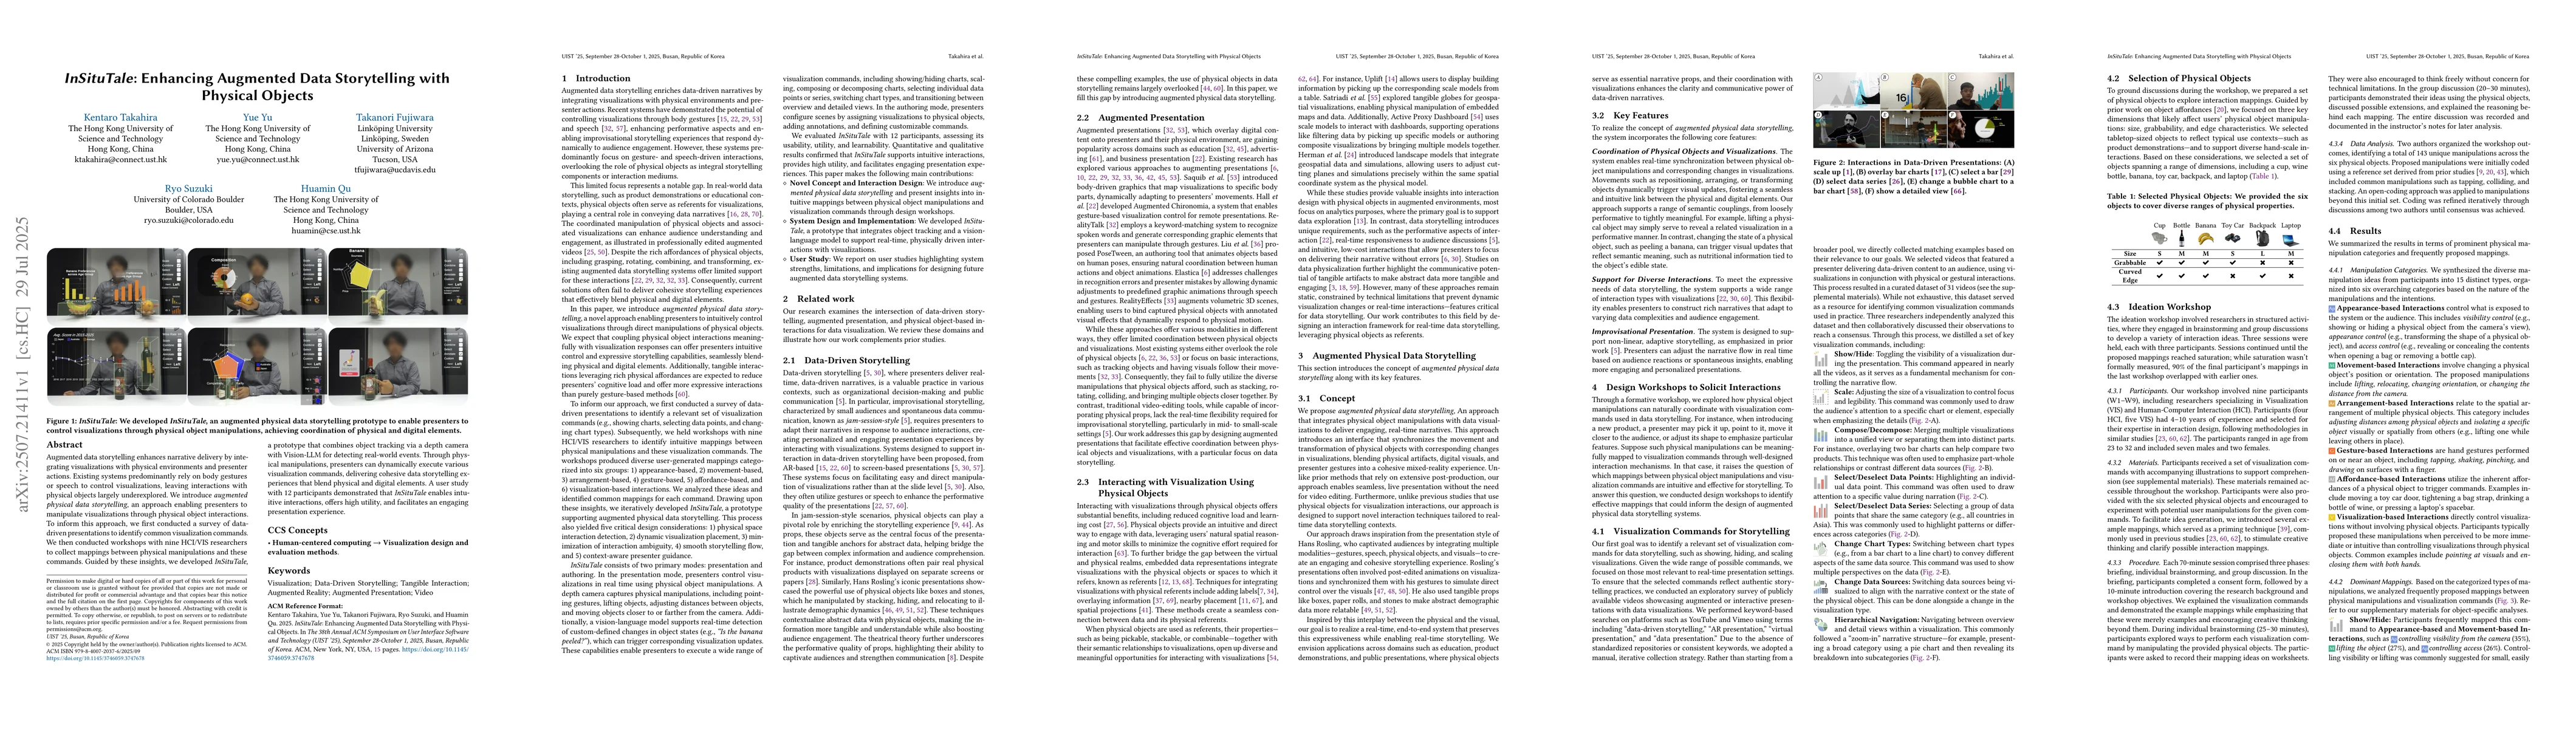
Augmented data storytelling enhances narrative delivery by integrating visualizations with physical environments and presenter actions. Existing systems predominantly rely on body gestures or speech t...
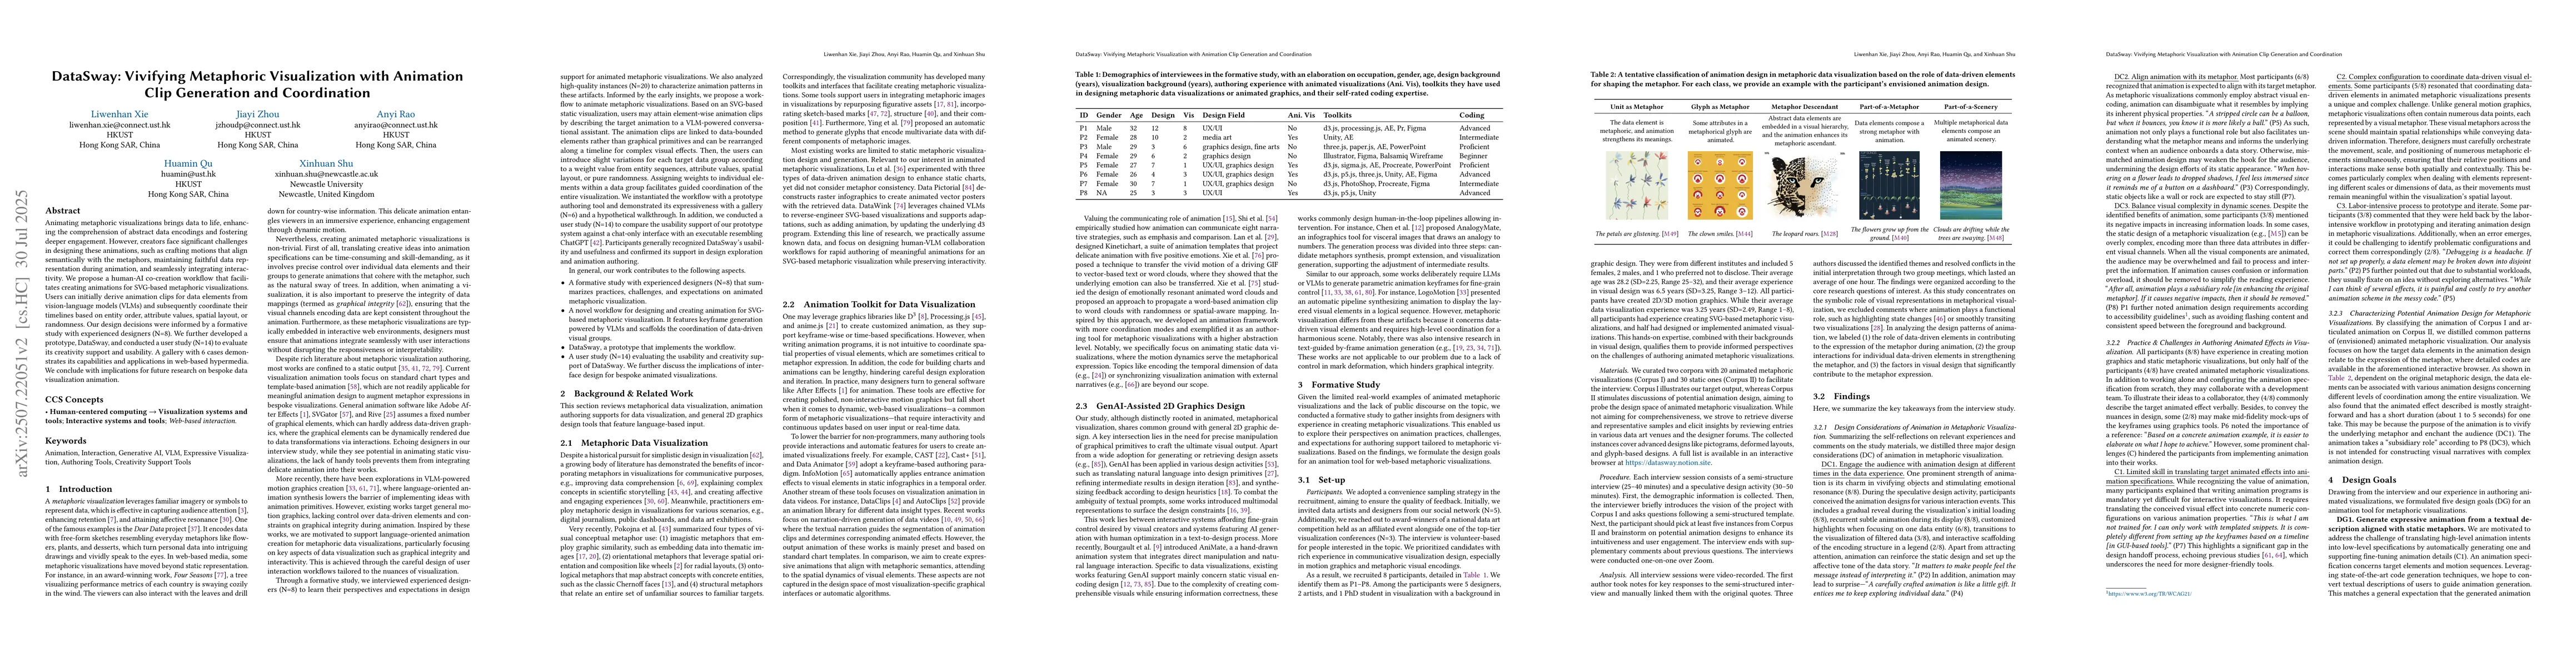
Animating metaphoric visualizations brings data to life, enhancing the comprehension of abstract data encodings and fostering deeper engagement. However, creators face significant challenges in design...
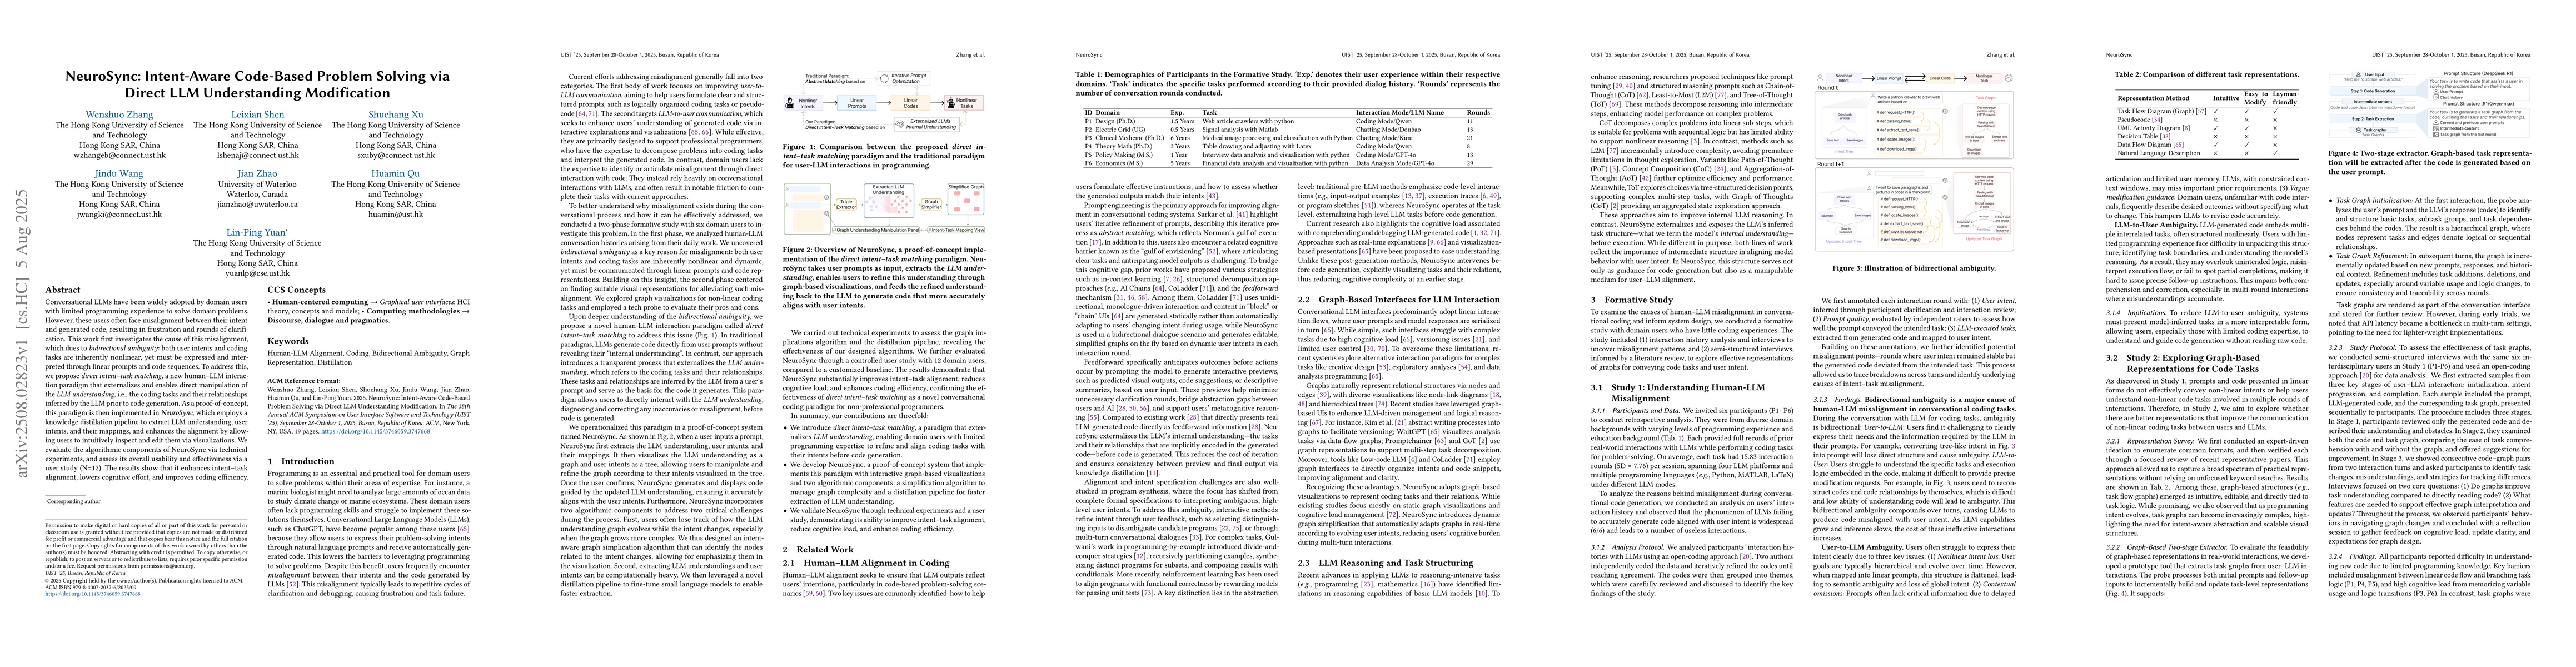
Conversational LLMs have been widely adopted by domain users with limited programming experience to solve domain problems. However, these users often face misalignment between their intent and generat...
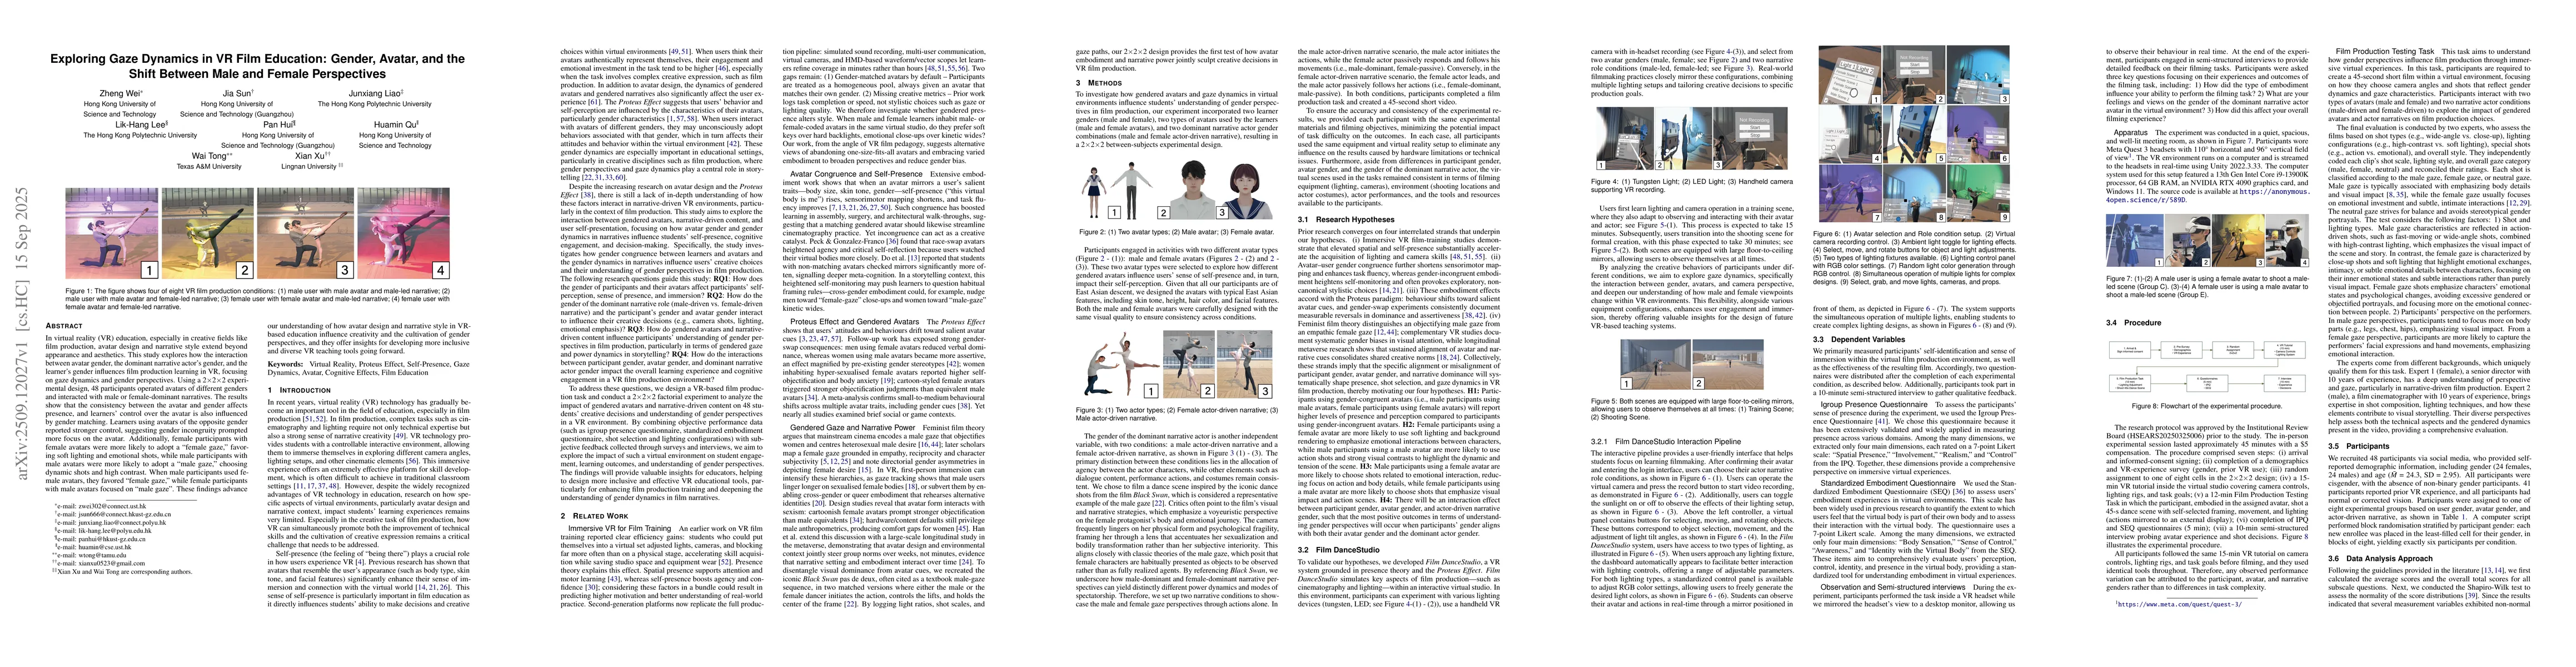
In virtual reality (VR) education, especially in creative fields like film production, avatar design and narrative style extend beyond appearance and aesthetics. This study explores how the interactio...
Social media use has been shown to be associated with low fertility desires. However, we know little about the discourses surrounding childbirth and parenthood that people consume online. We analyze 2...
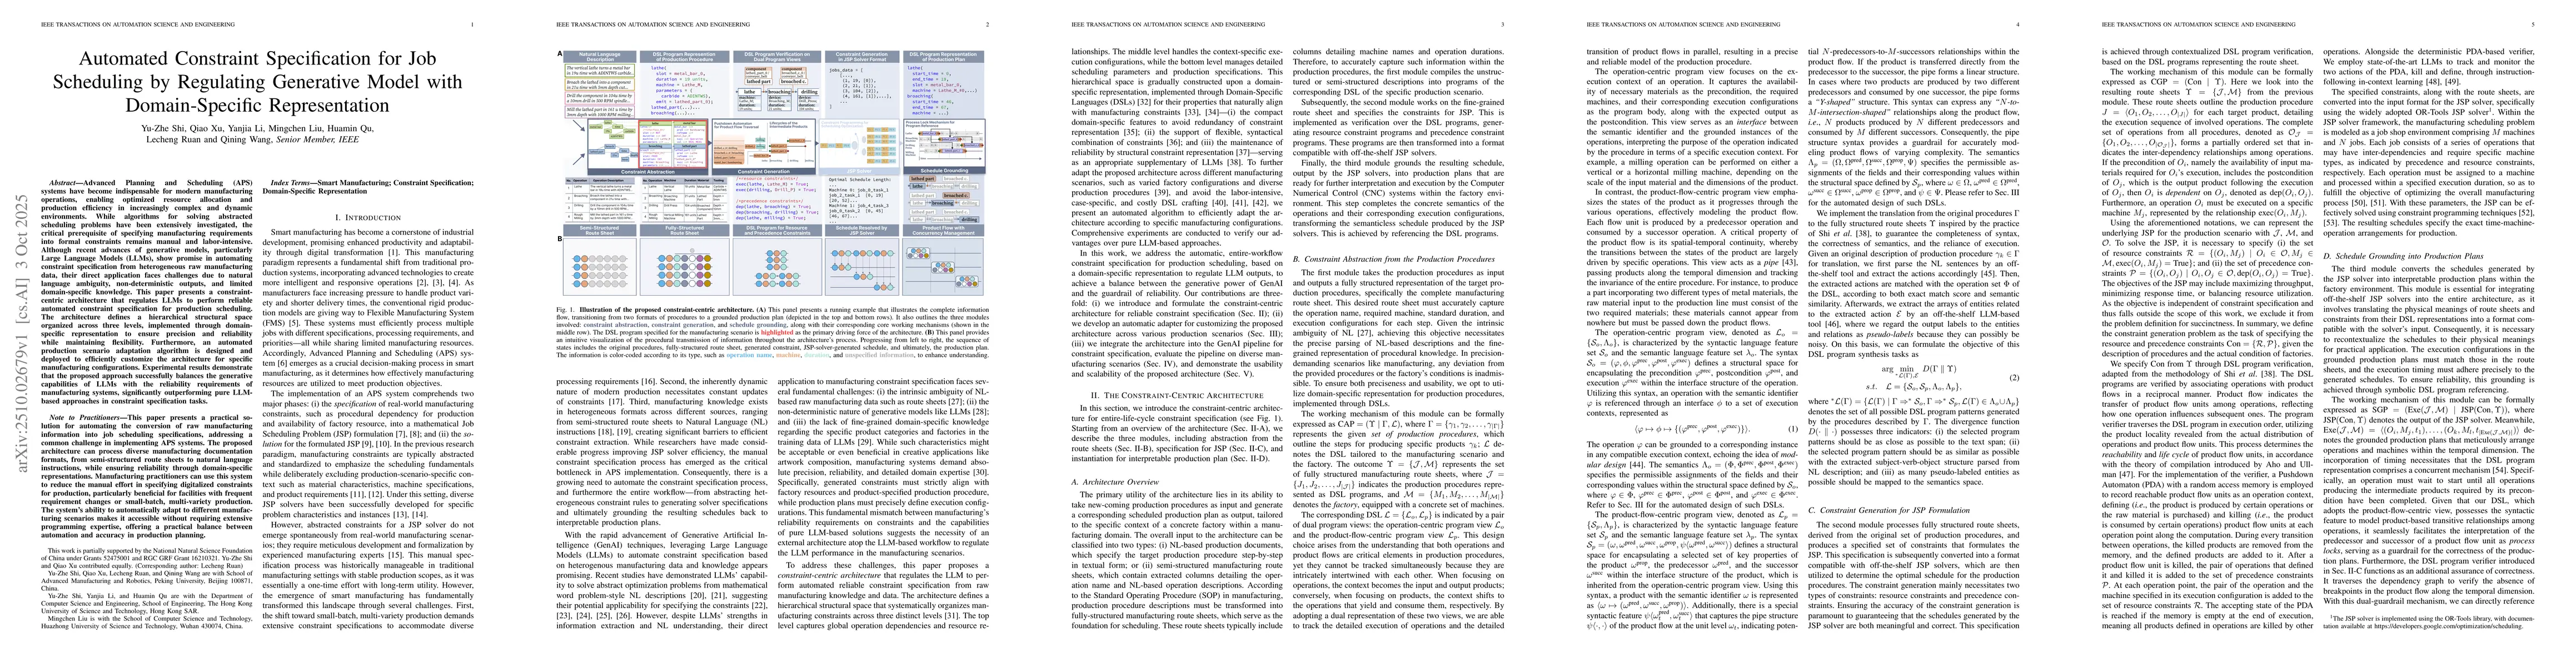
Advanced Planning and Scheduling (APS) systems have become indispensable for modern manufacturing operations, enabling optimized resource allocation and production efficiency in increasingly complex a...
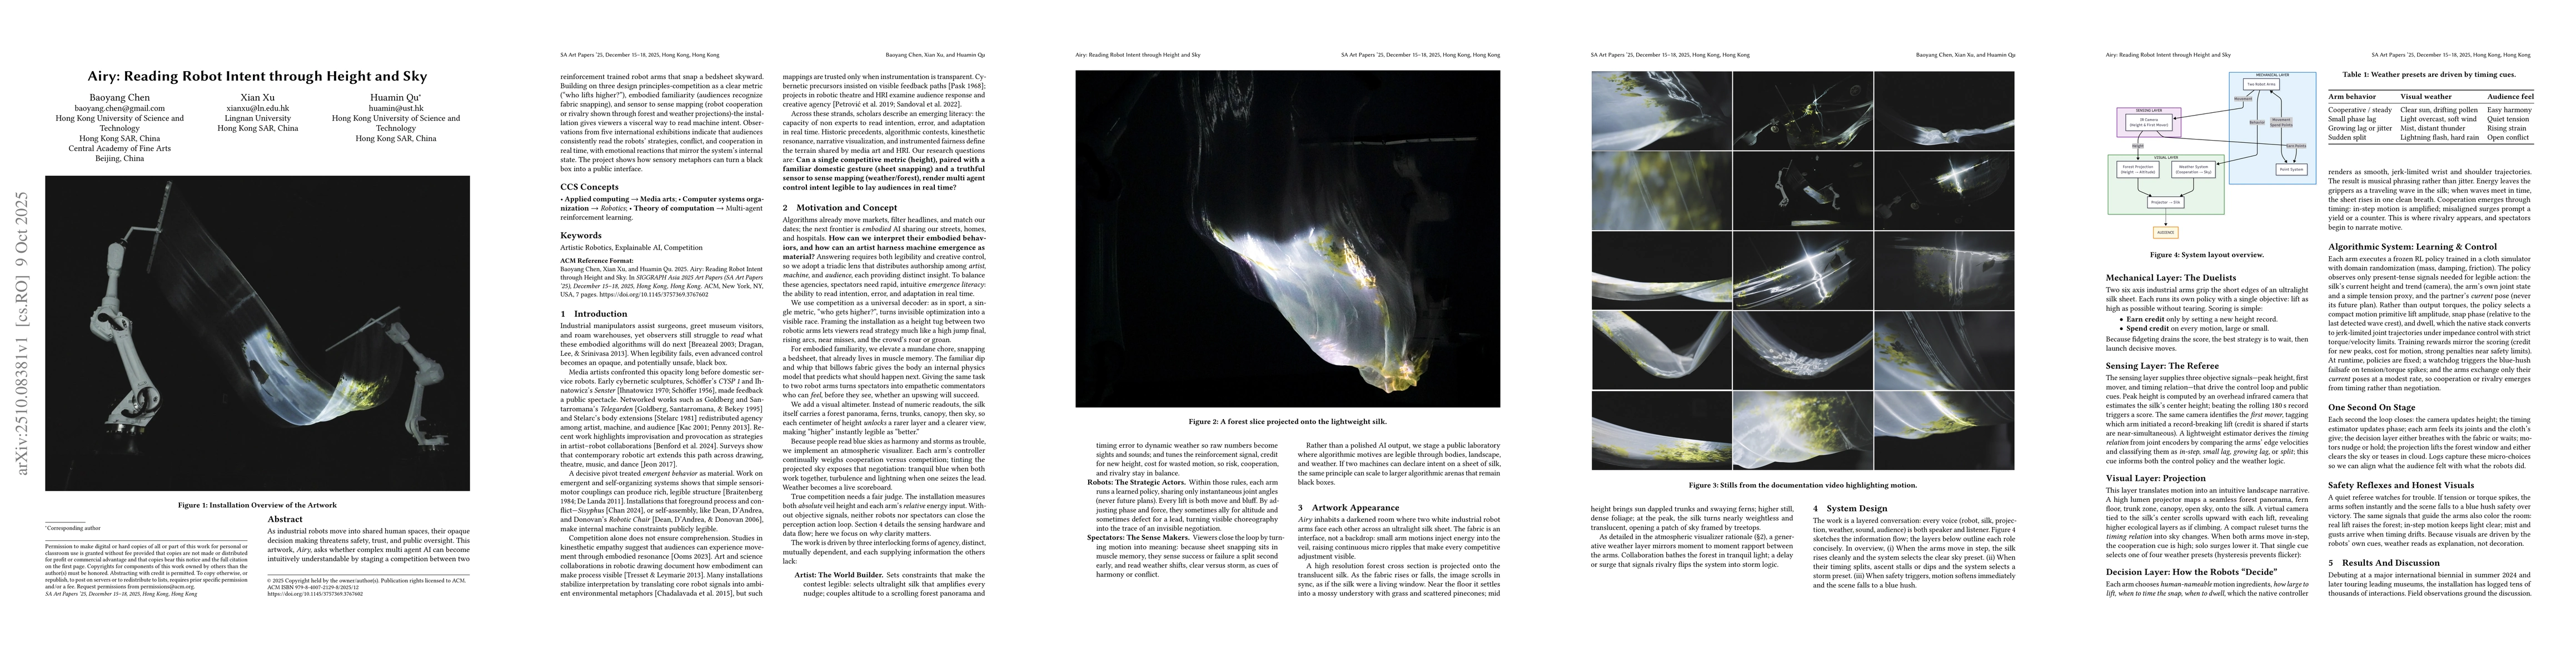
As industrial robots move into shared human spaces, their opaque decision making threatens safety, trust, and public oversight. This artwork, Airy, asks whether complex multi agent AI can become intui...
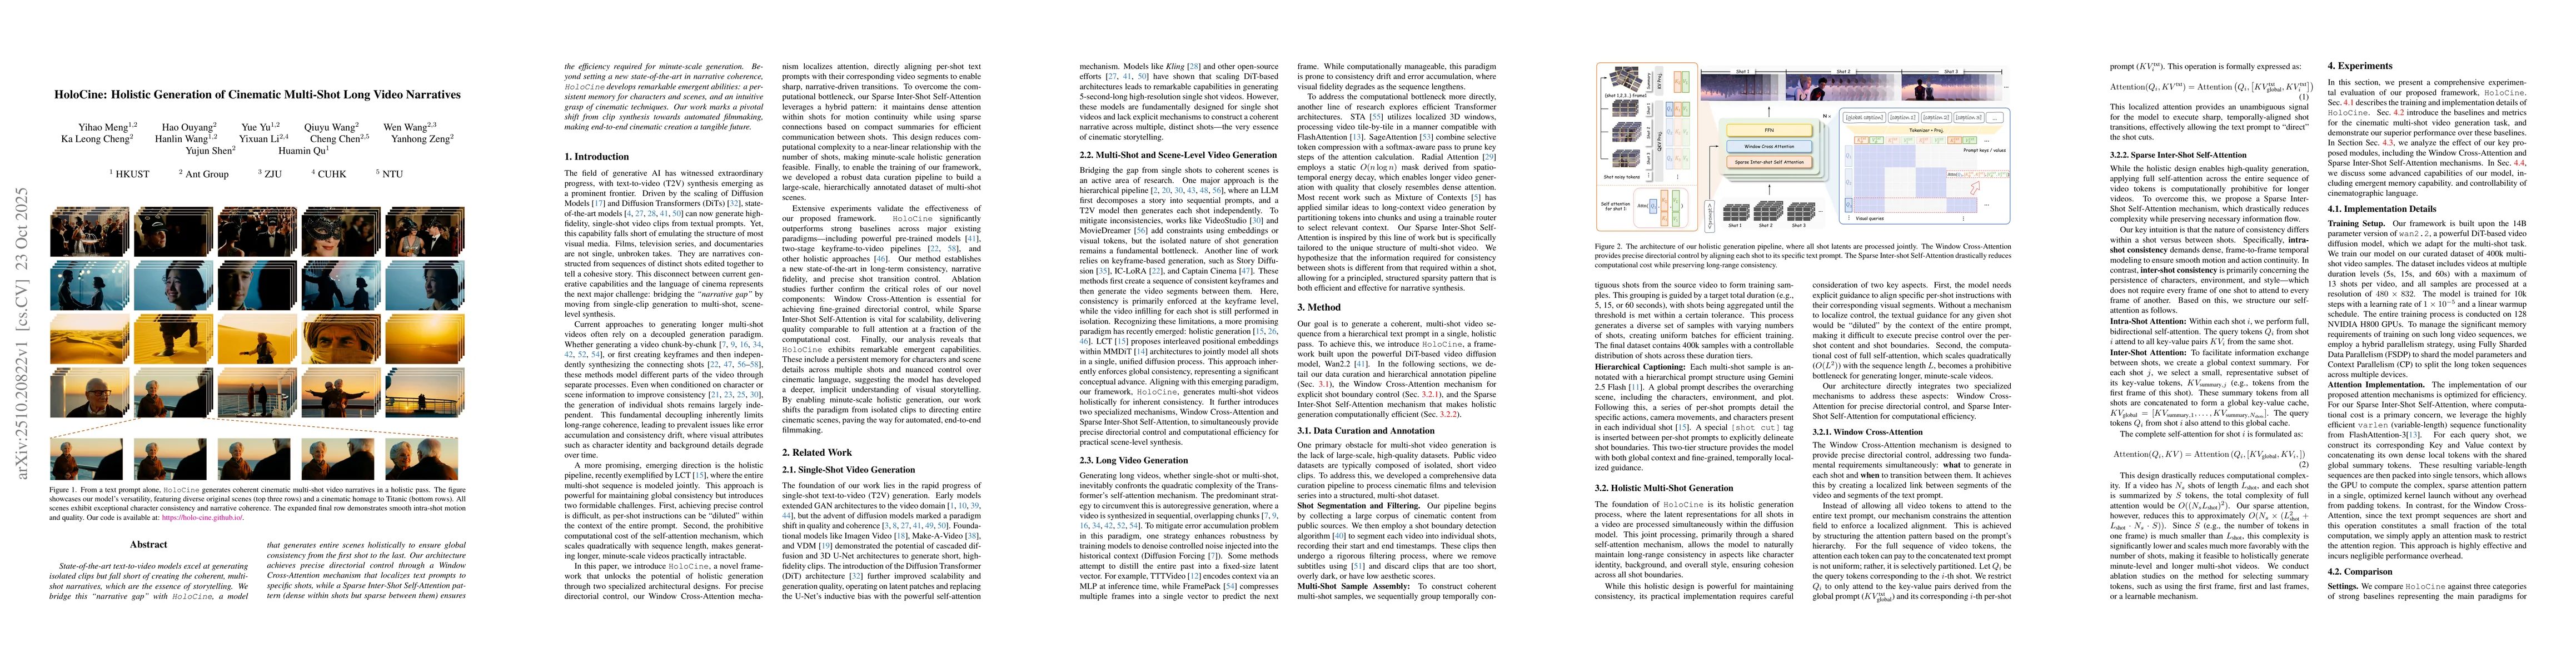
State-of-the-art text-to-video models excel at generating isolated clips but fall short of creating the coherent, multi-shot narratives, which are the essence of storytelling. We bridge this "narrativ...
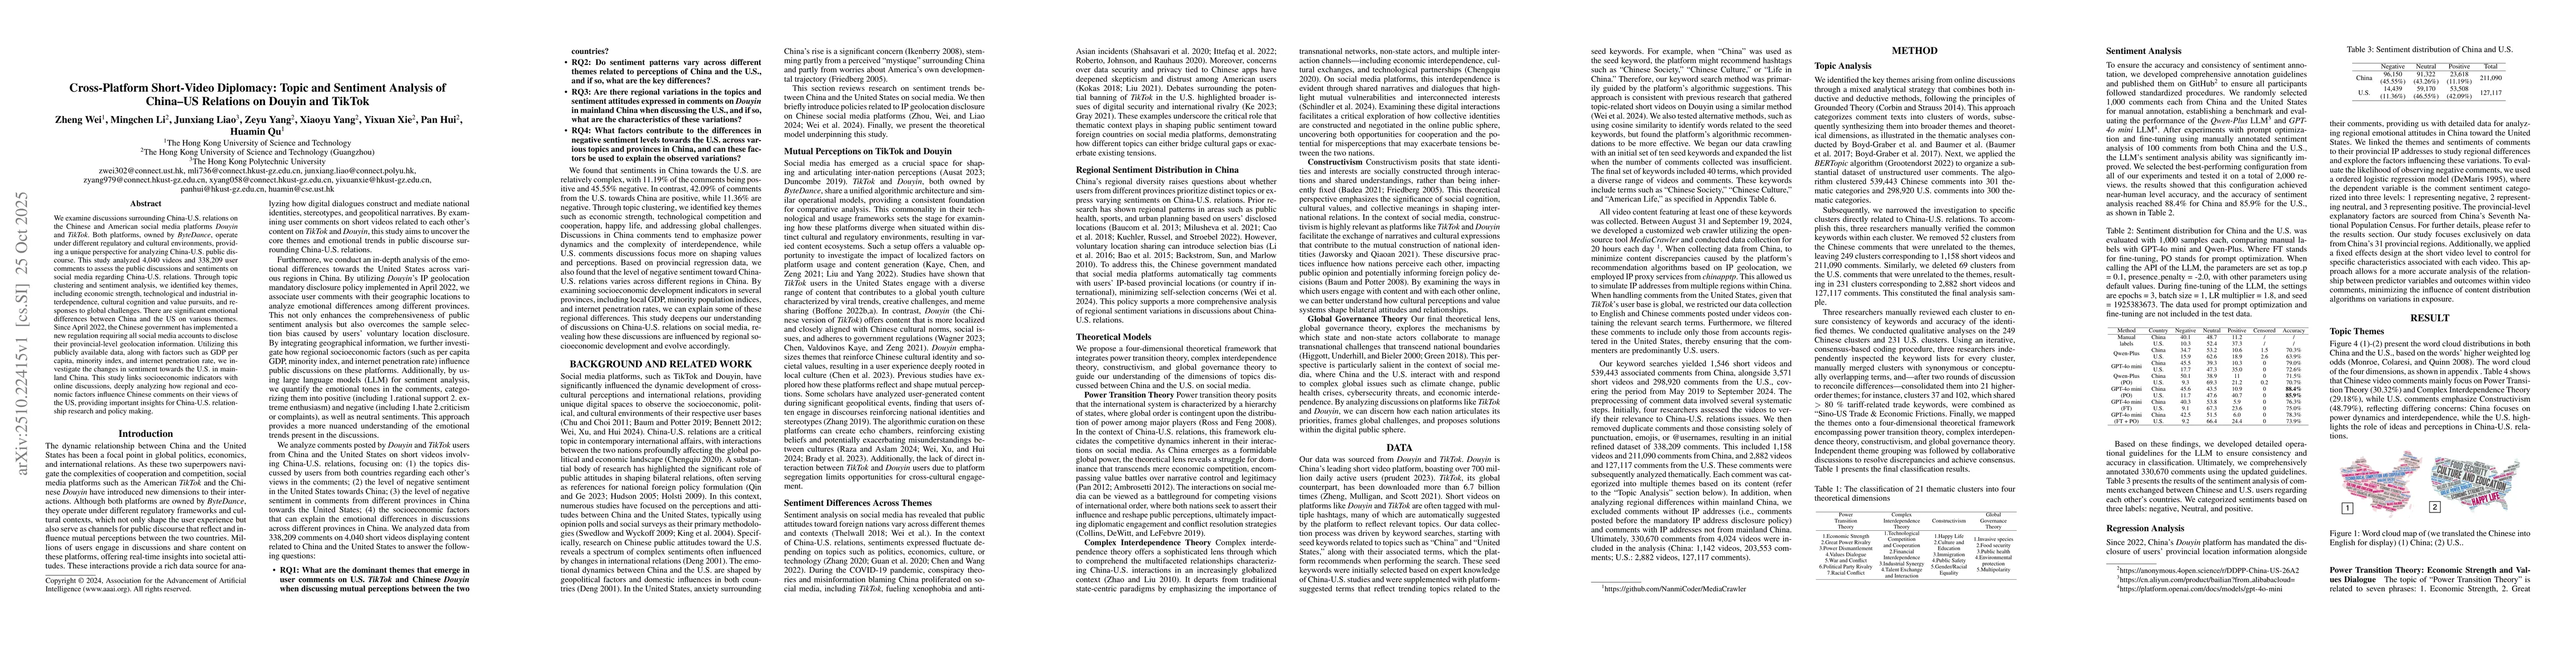
We examine discussions surrounding China-U.S. relations on the Chinese and American social media platforms \textit{Douyin} and \textit{TikTok}. Both platforms, owned by \textit{ByteDance}, operate und...
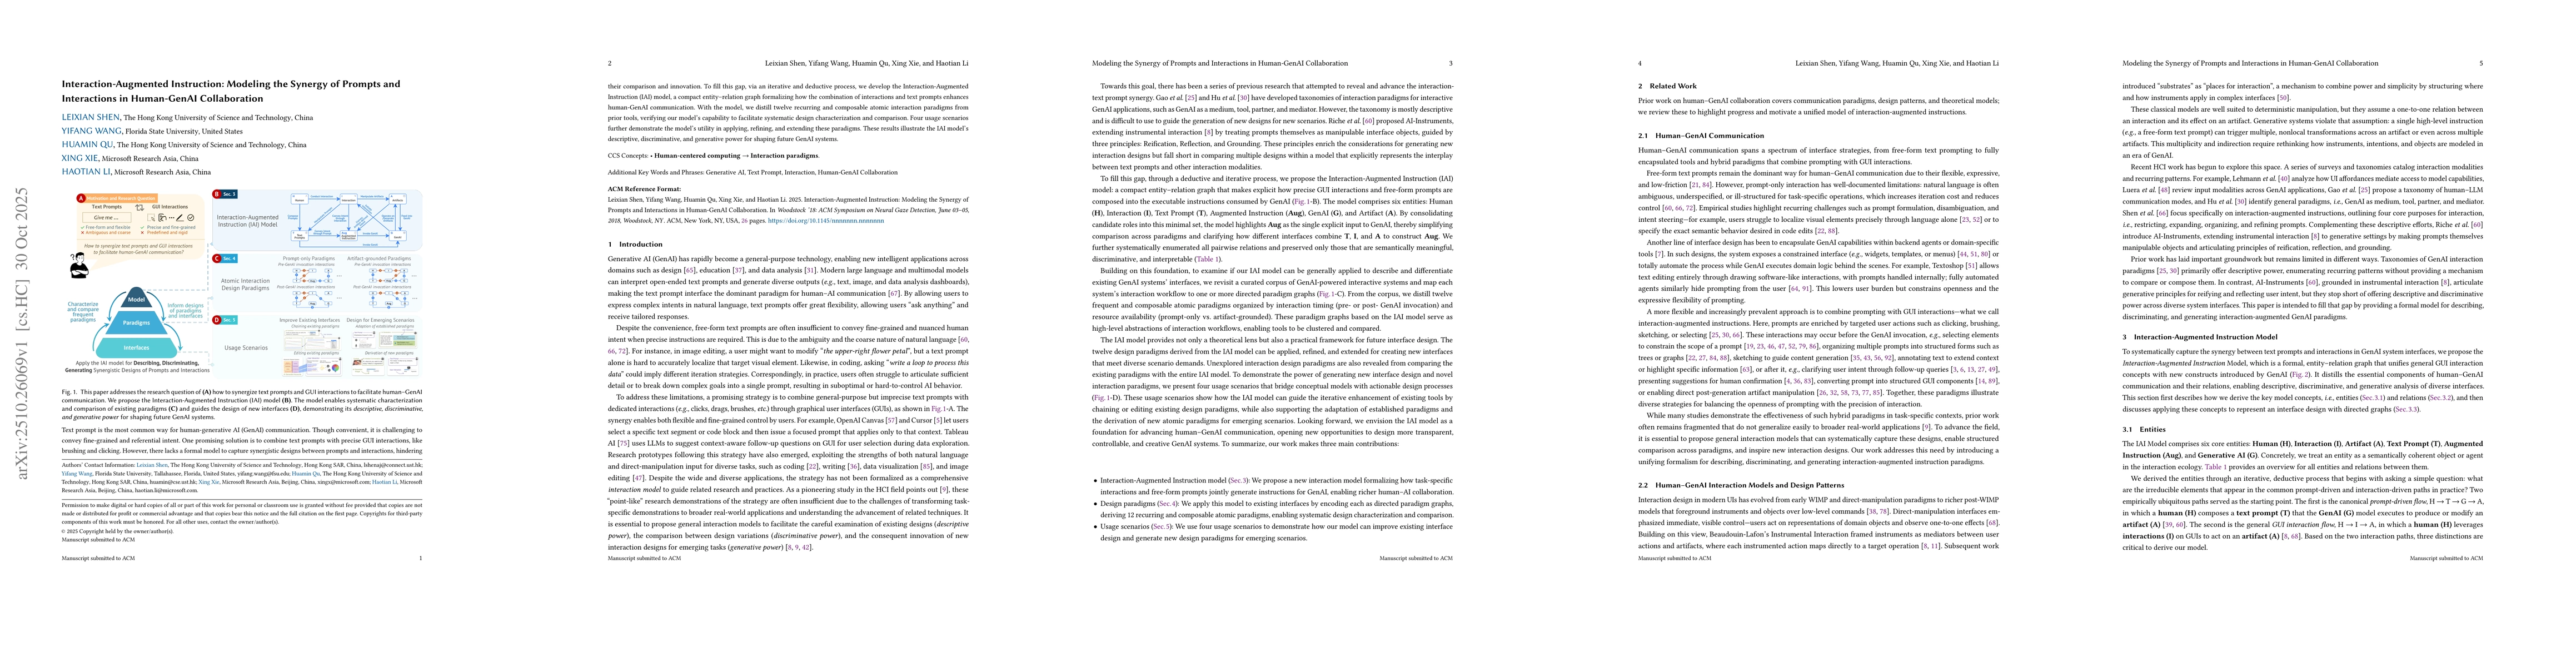
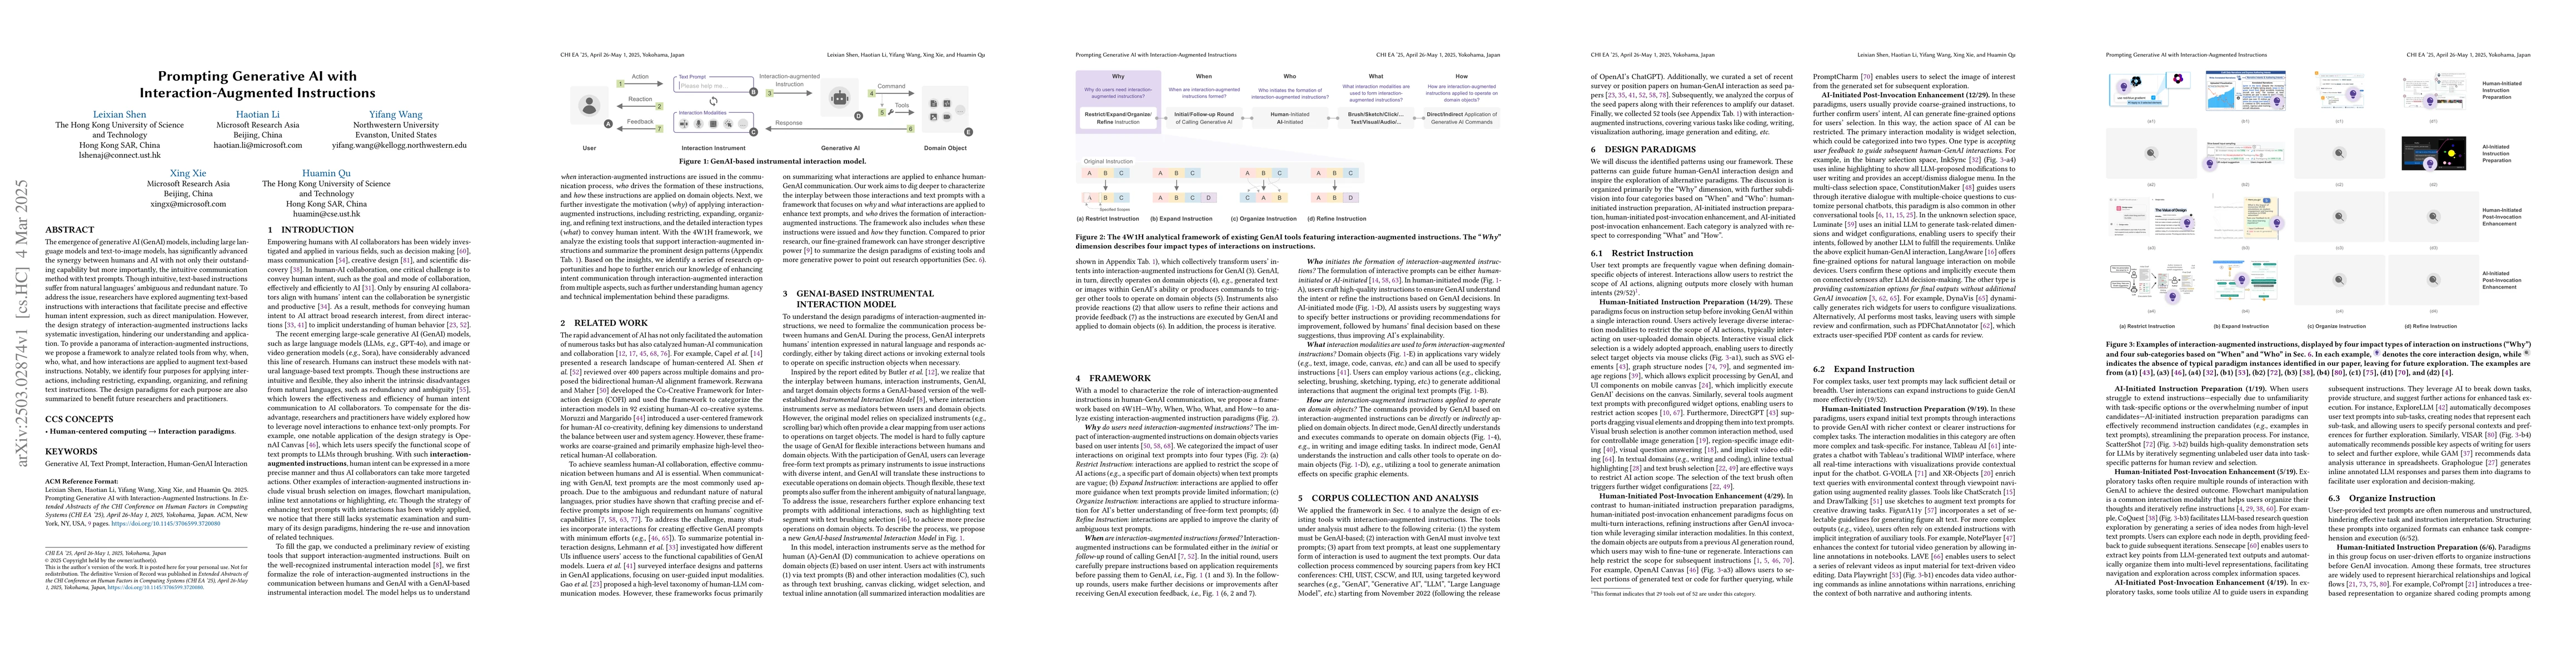
Text prompt is the most common way for human-generative AI (GenAI) communication. Though convenient, it is challenging to convey fine-grained and referential intent. One promising solution is to combi...
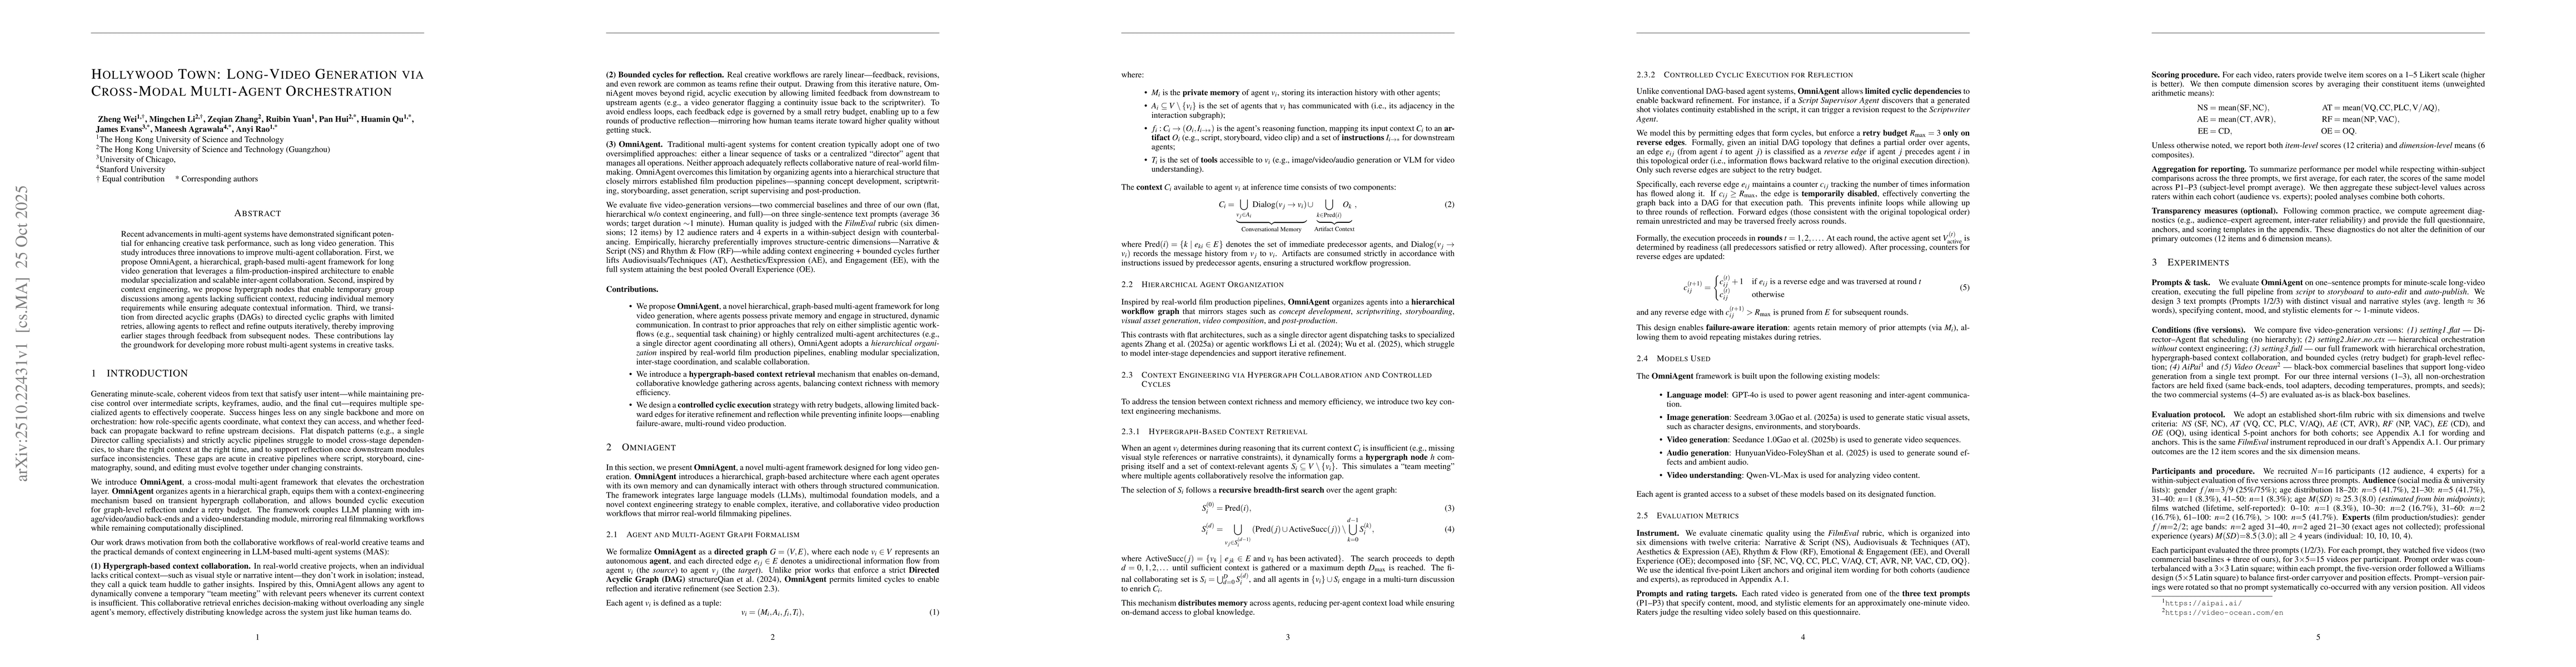
Recent advancements in multi-agent systems have demonstrated significant potential for enhancing creative task performance, such as long video generation. This study introduces three innovations to im...
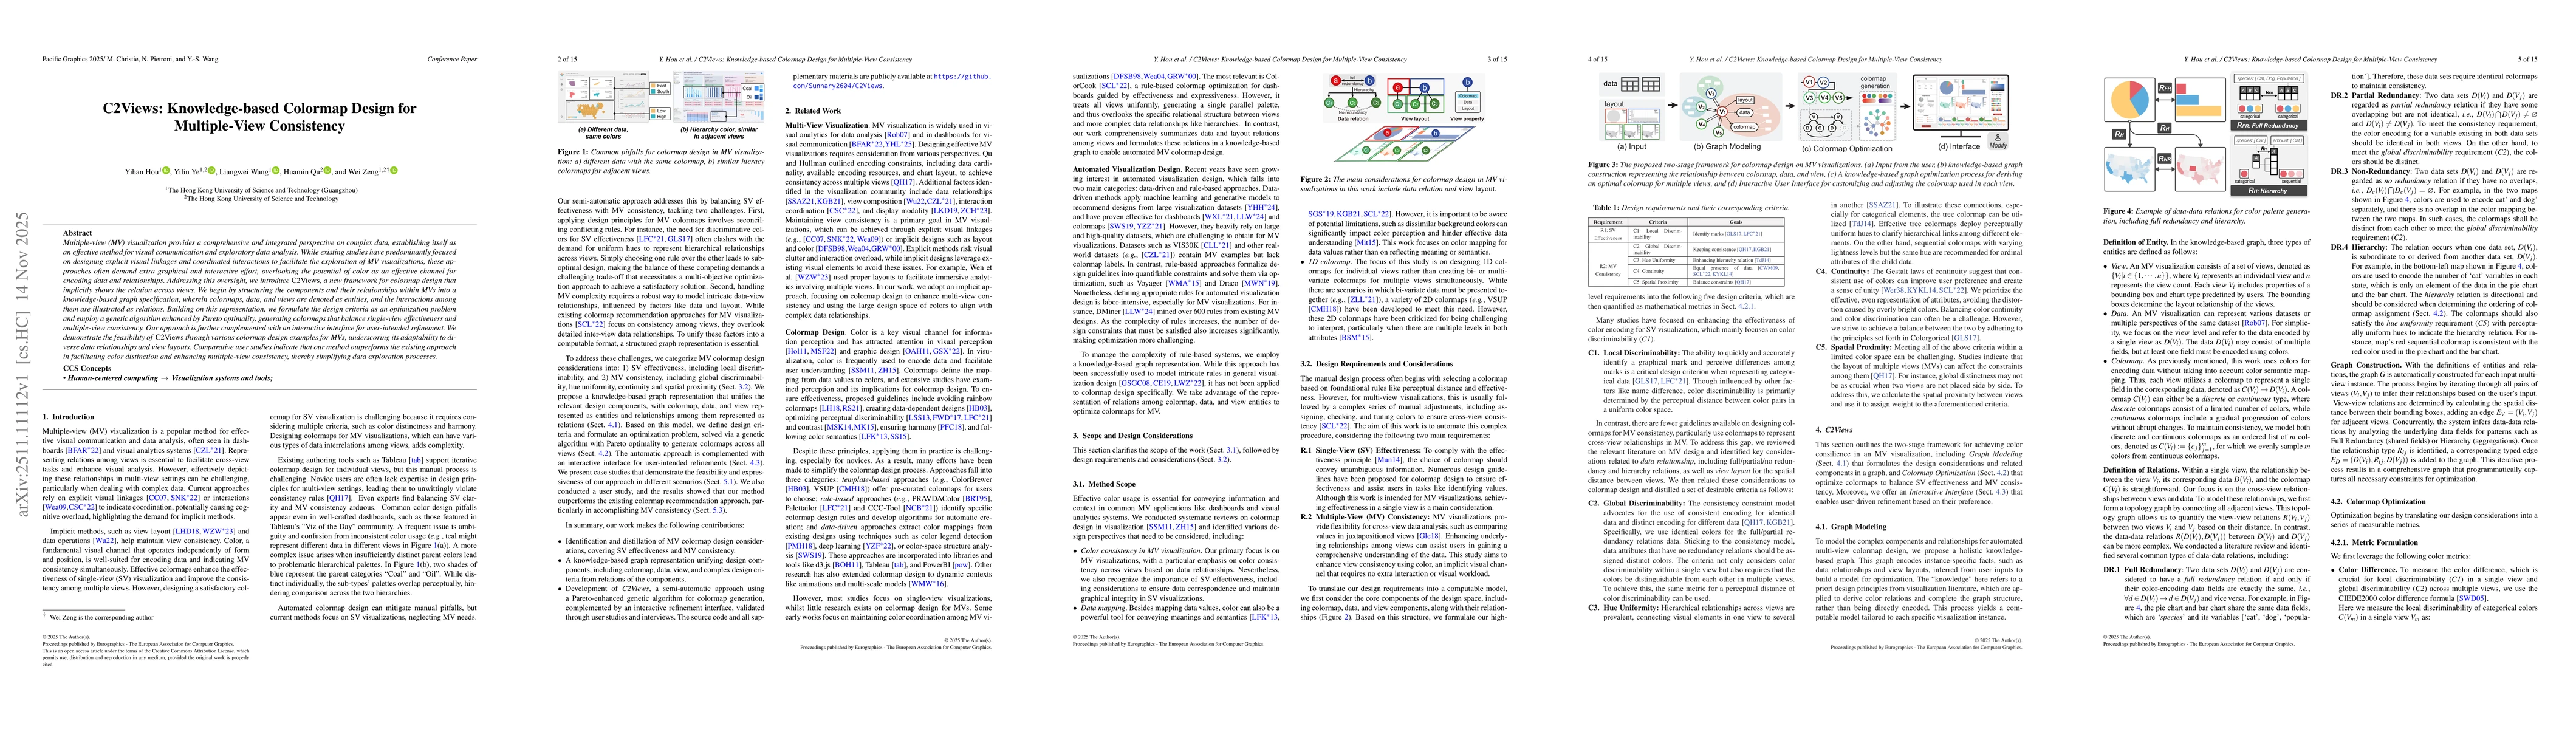
Multiple-view (MV) visualization provides a comprehensive and integrated perspective on complex data, establishing itself as an effective method for visual communication and exploratory data analysis....
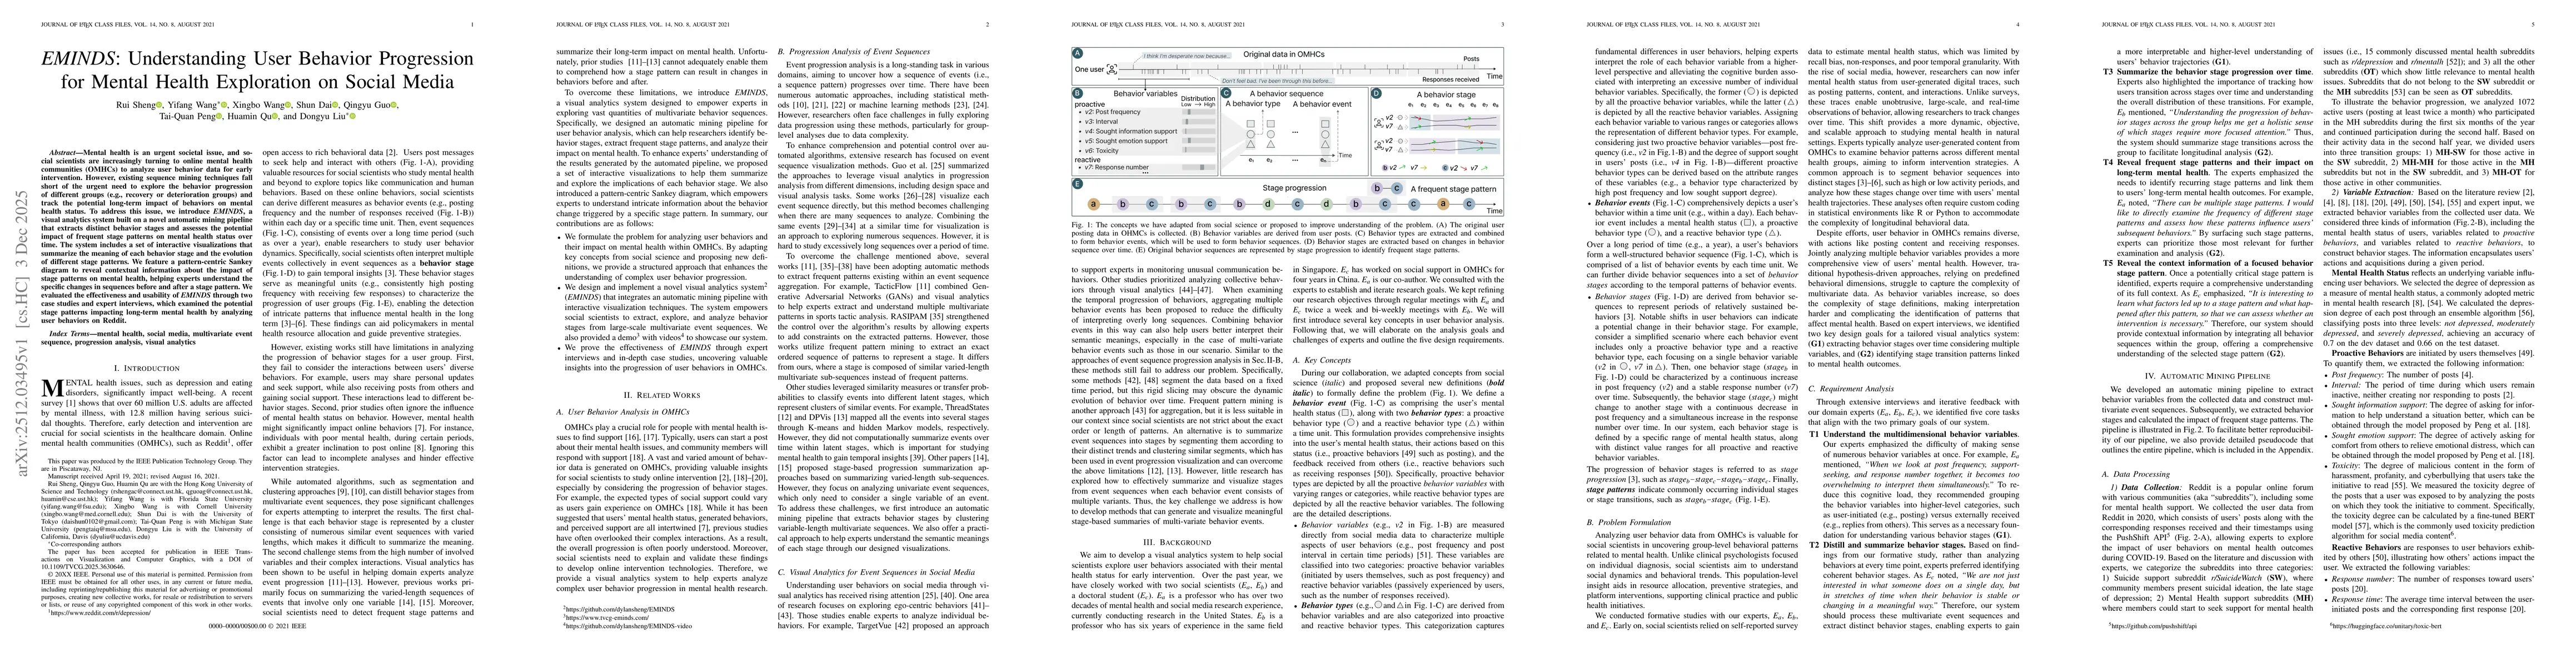
Mental health is an urgent societal issue, and social scientists are increasingly turning to online mental health communities (OMHCs) to analyze user behavior data for early intervention. However, exi...
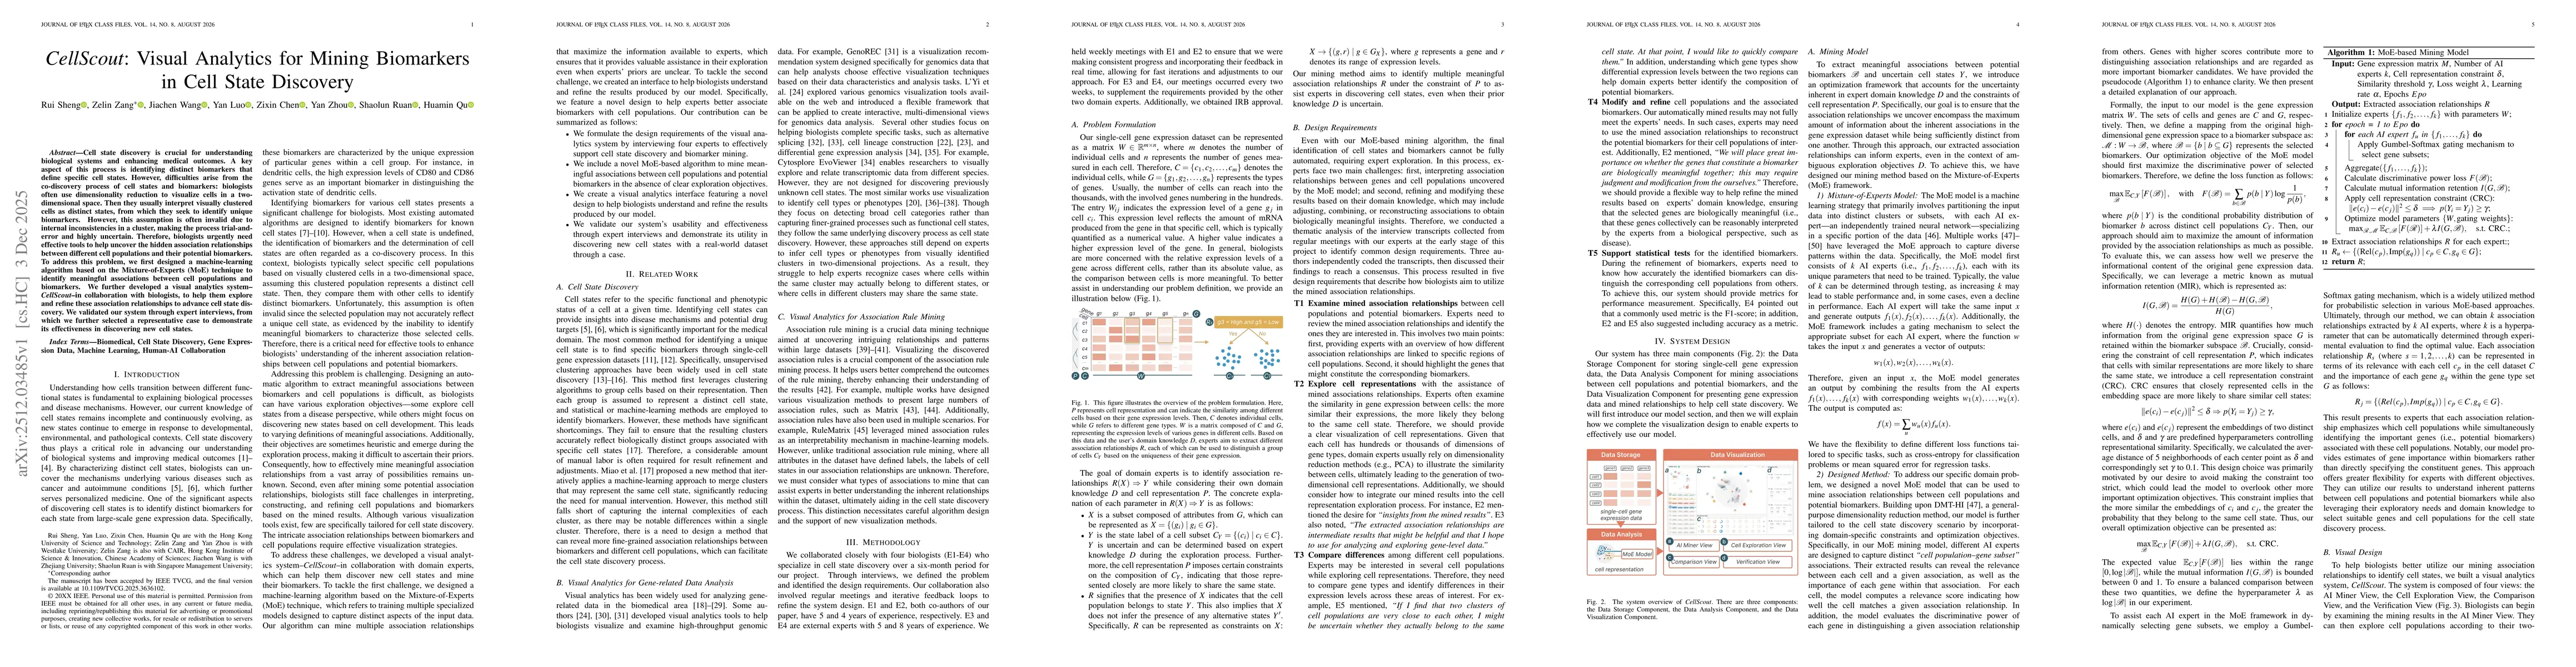
Cell state discovery is crucial for understanding biological systems and enhancing medical outcomes. A key aspect of this process is identifying distinct biomarkers that define specific cell states. H...
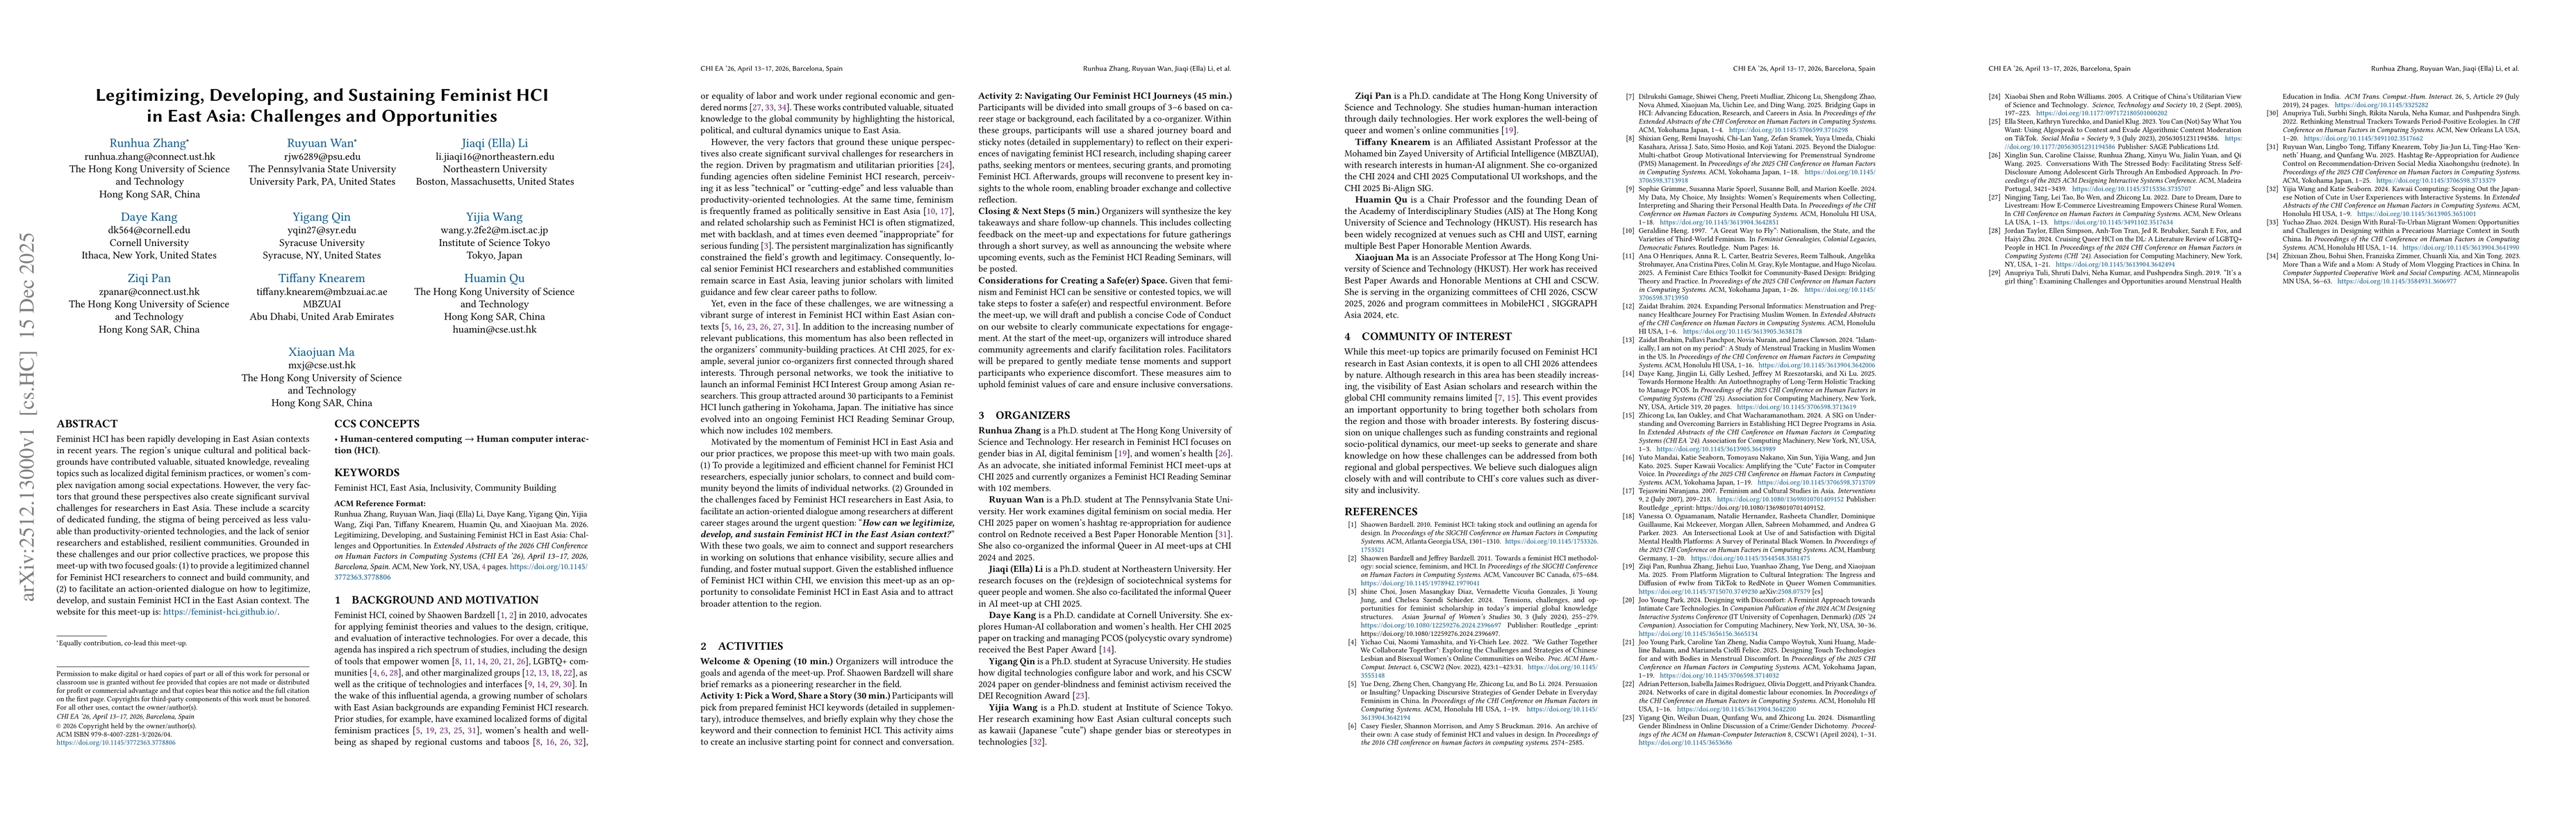
Feminist HCI has been rapidly developing in East Asian contexts in recent years. The region's unique cultural and political backgrounds have contributed valuable, situated knowledge, revealing topics ...
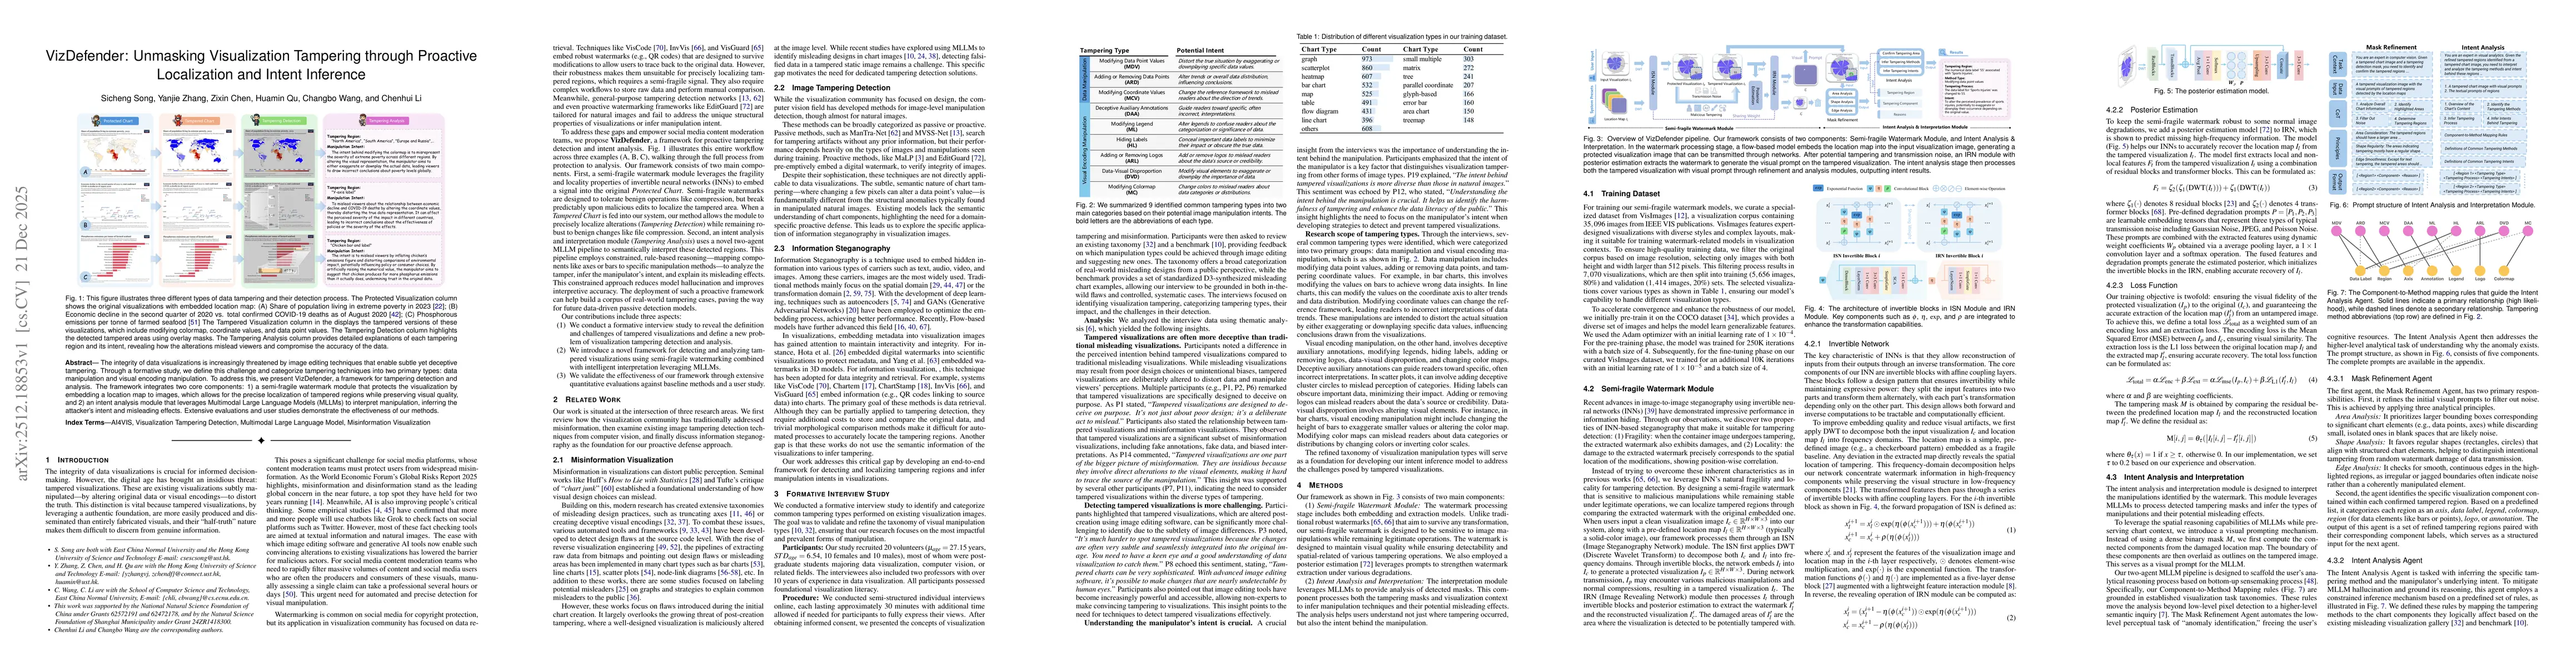
The integrity of data visualizations is increasingly threatened by image editing techniques that enable subtle yet deceptive tampering. Through a formative study, we define this challenge and categori...
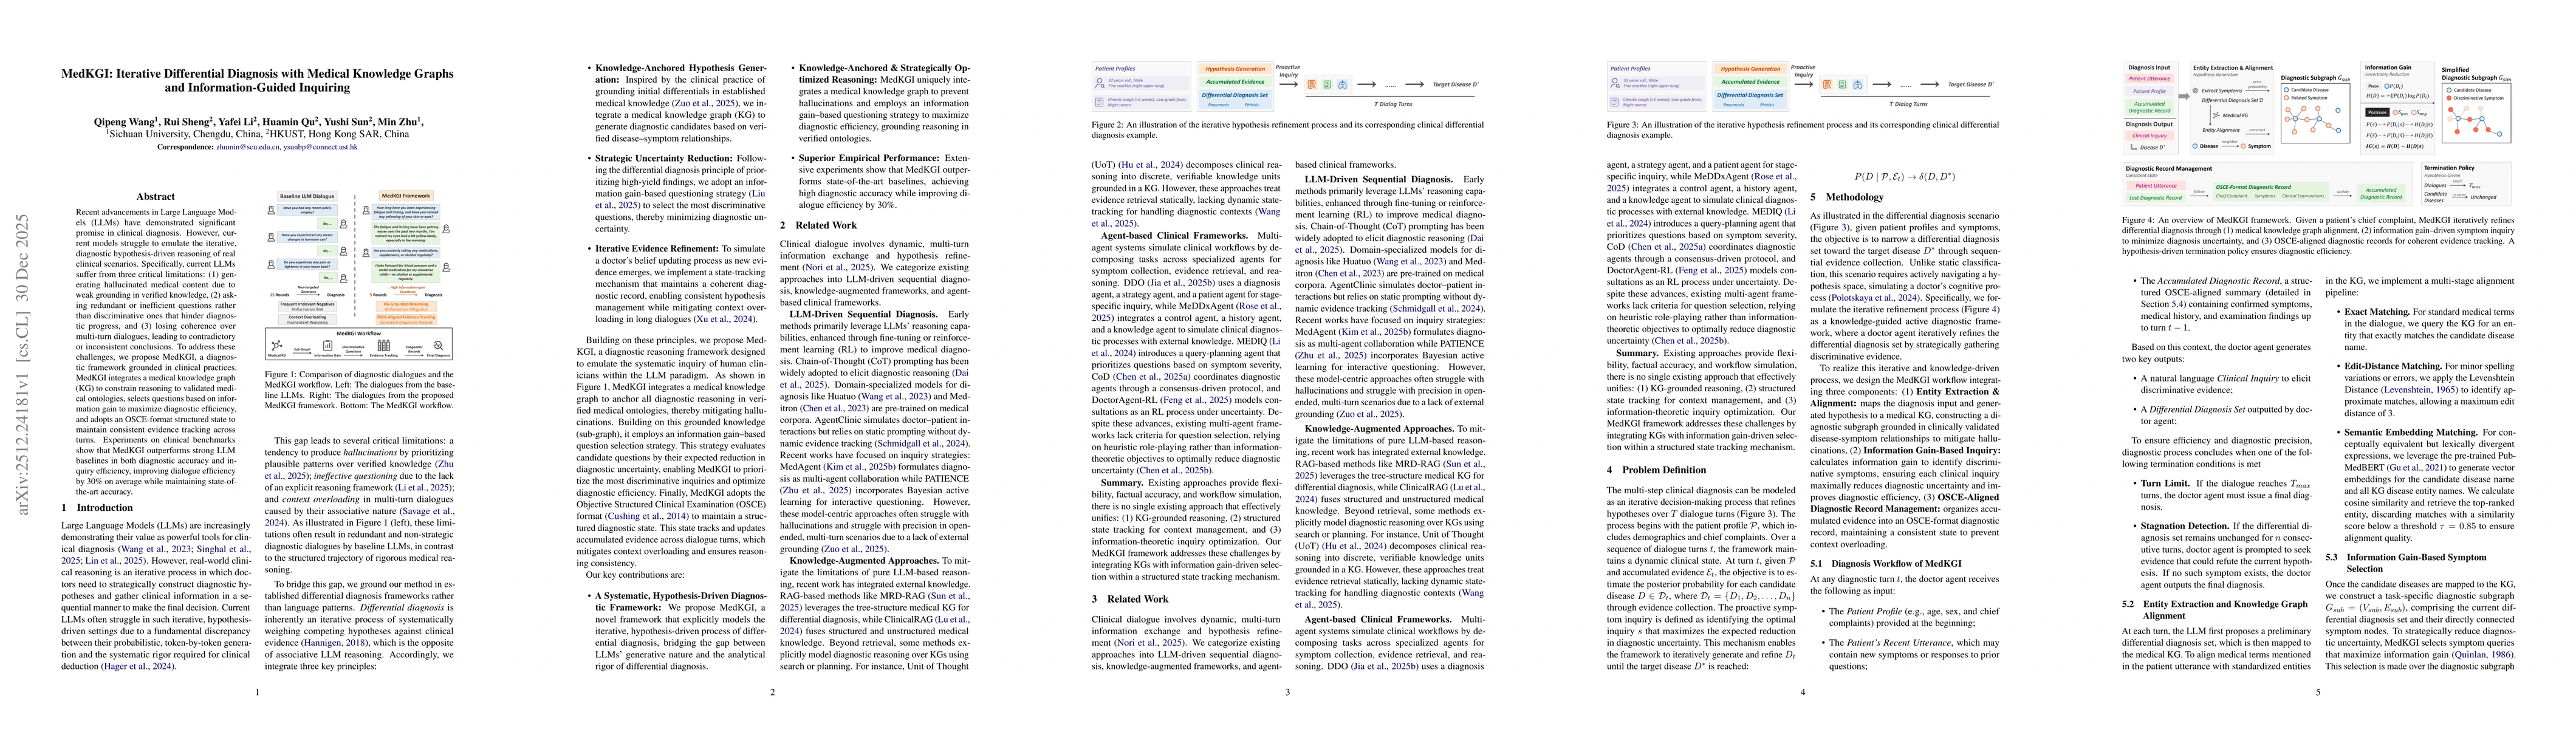
Recent advancements in Large Language Models (LLMs) have demonstrated significant promise in clinical diagnosis. However, current models struggle to emulate the iterative, diagnostic hypothesis-driven...
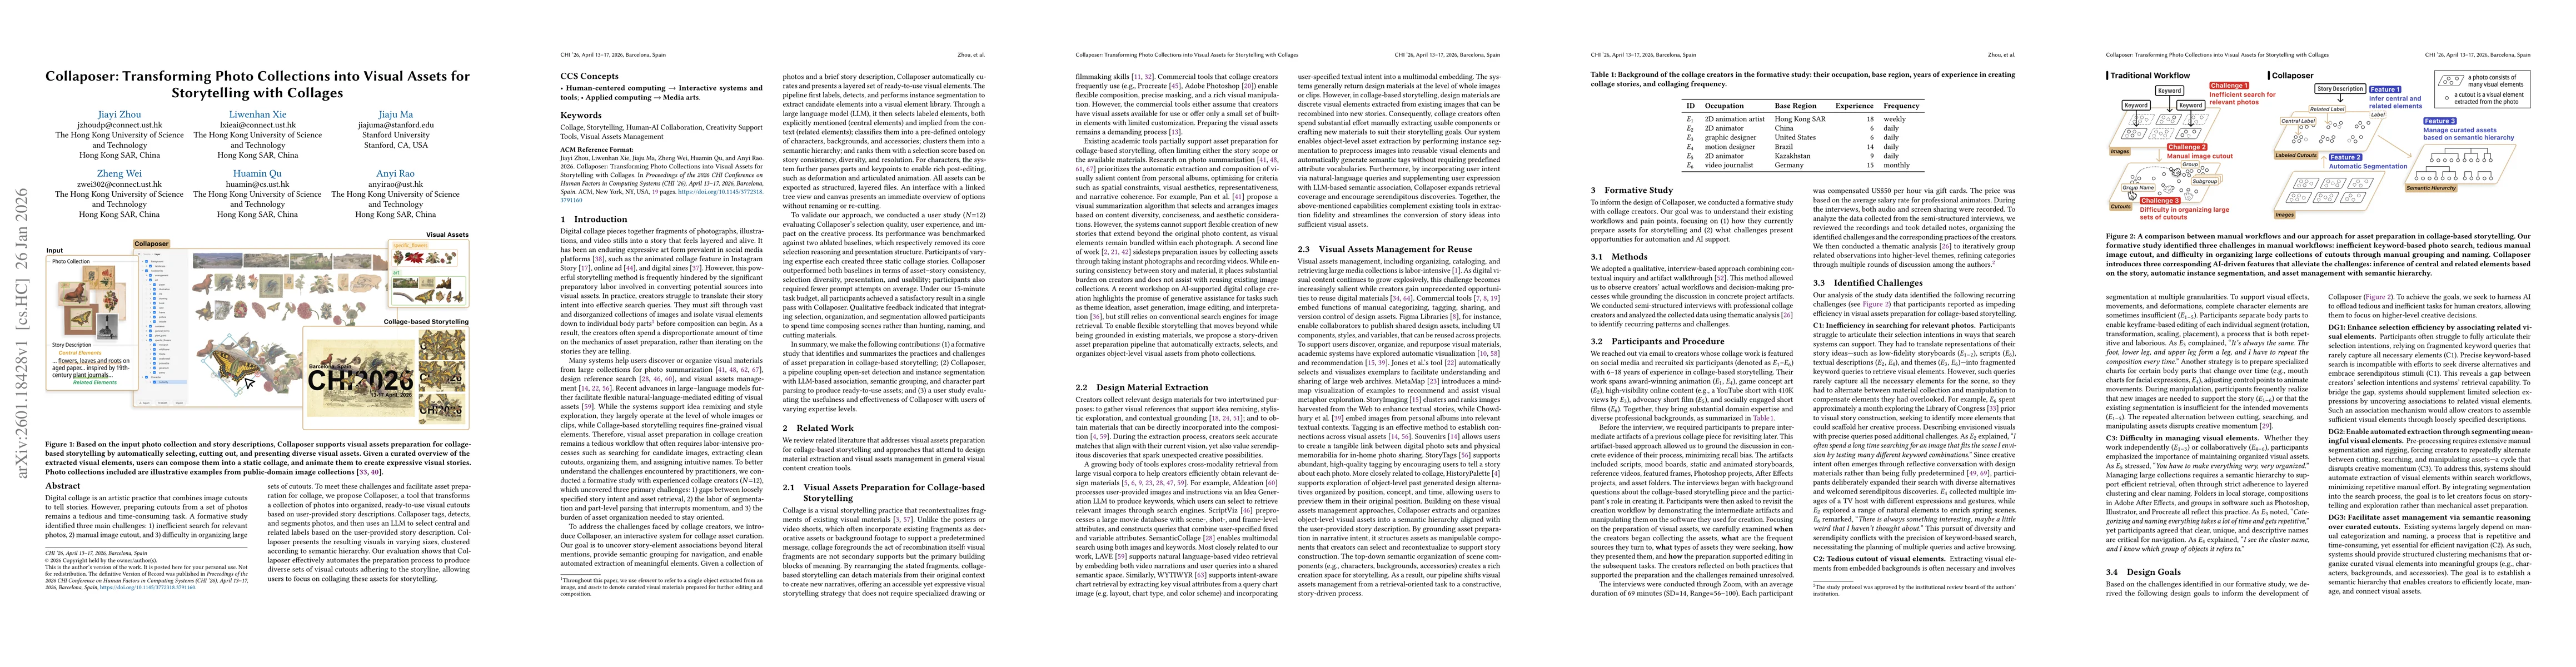
Digital collage is an artistic practice that combines image cutouts to tell stories. However, preparing cutouts from a set of photos remains a tedious and time-consuming task. A formative study identi...
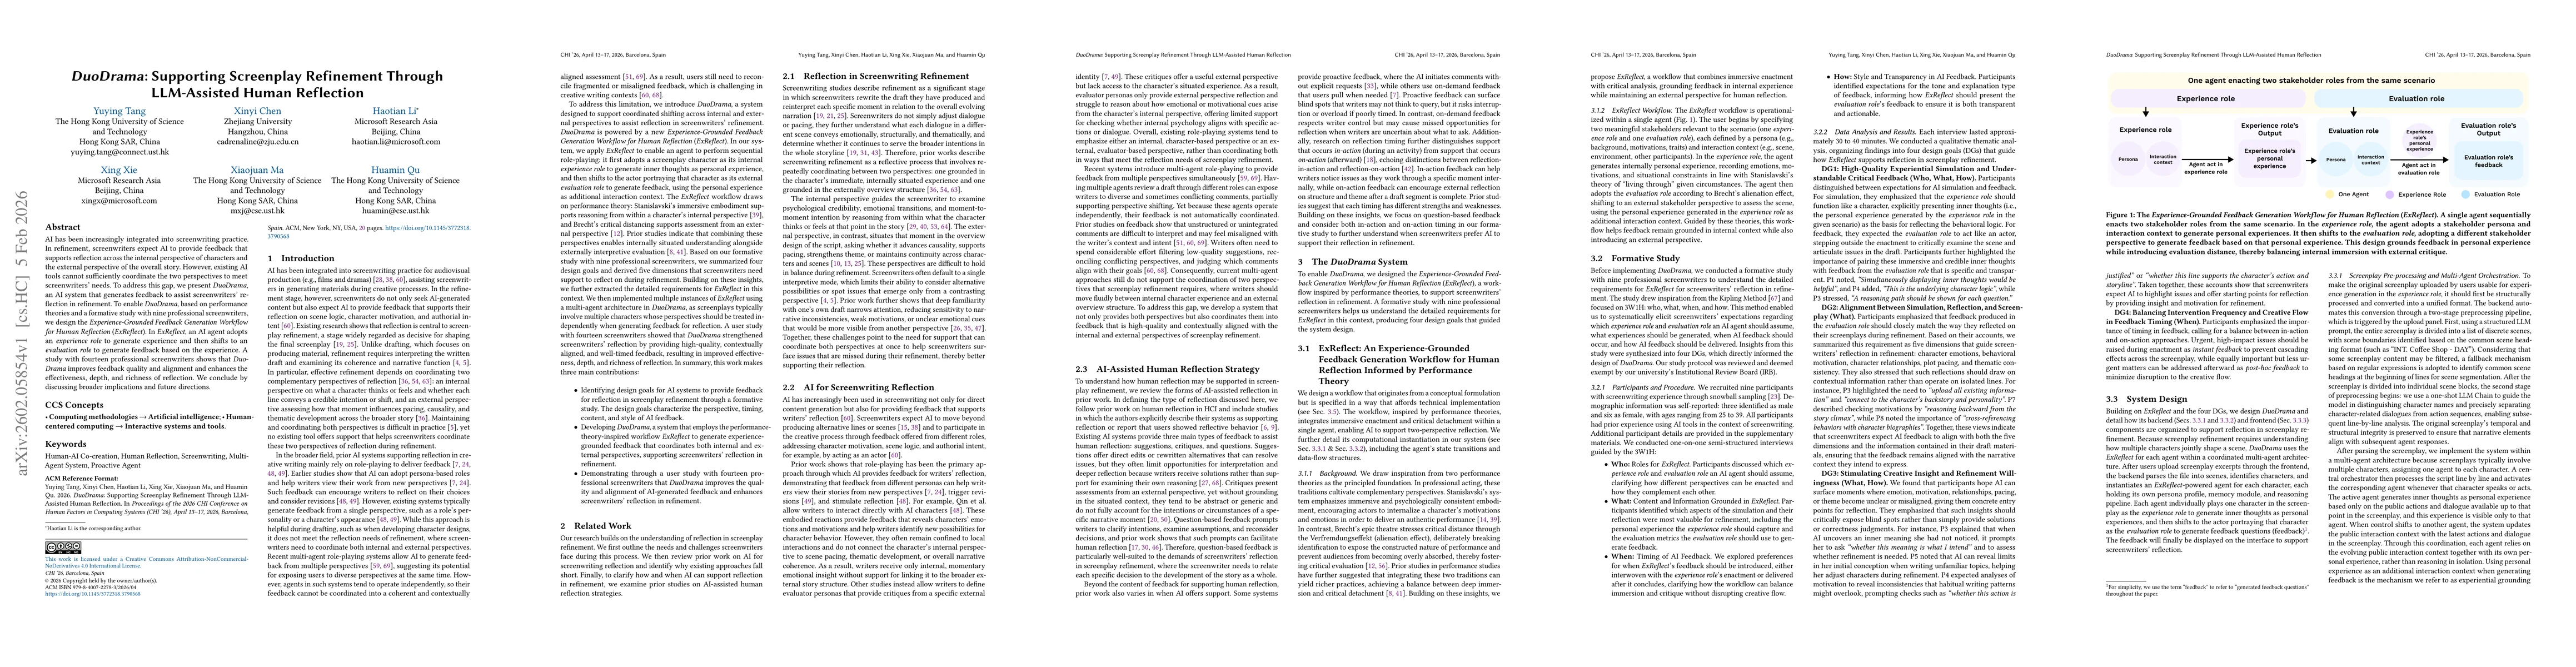
AI has been increasingly integrated into screenwriting practice. In refinement, screenwriters expect AI to provide feedback that supports reflection across the internal perspective of characters and t...
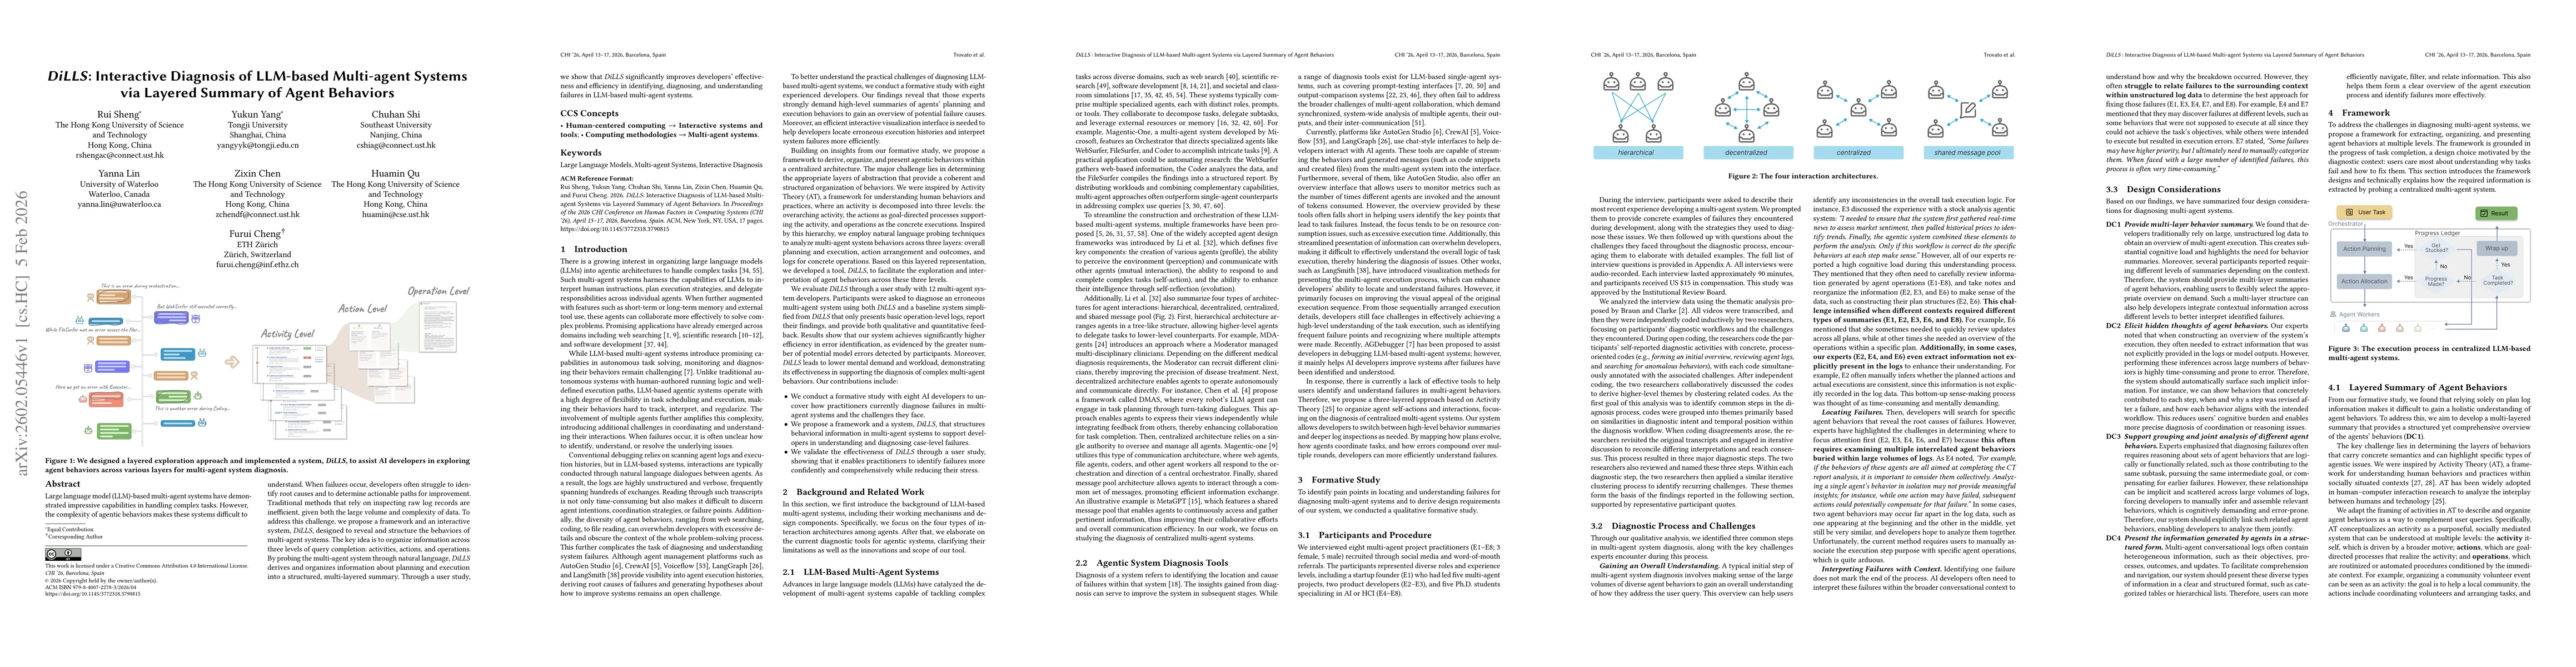
Large language model (LLM)-based multi-agent systems have demonstrated impressive capabilities in handling complex tasks. However, the complexity of agentic behaviors makes these systems difficult to ...
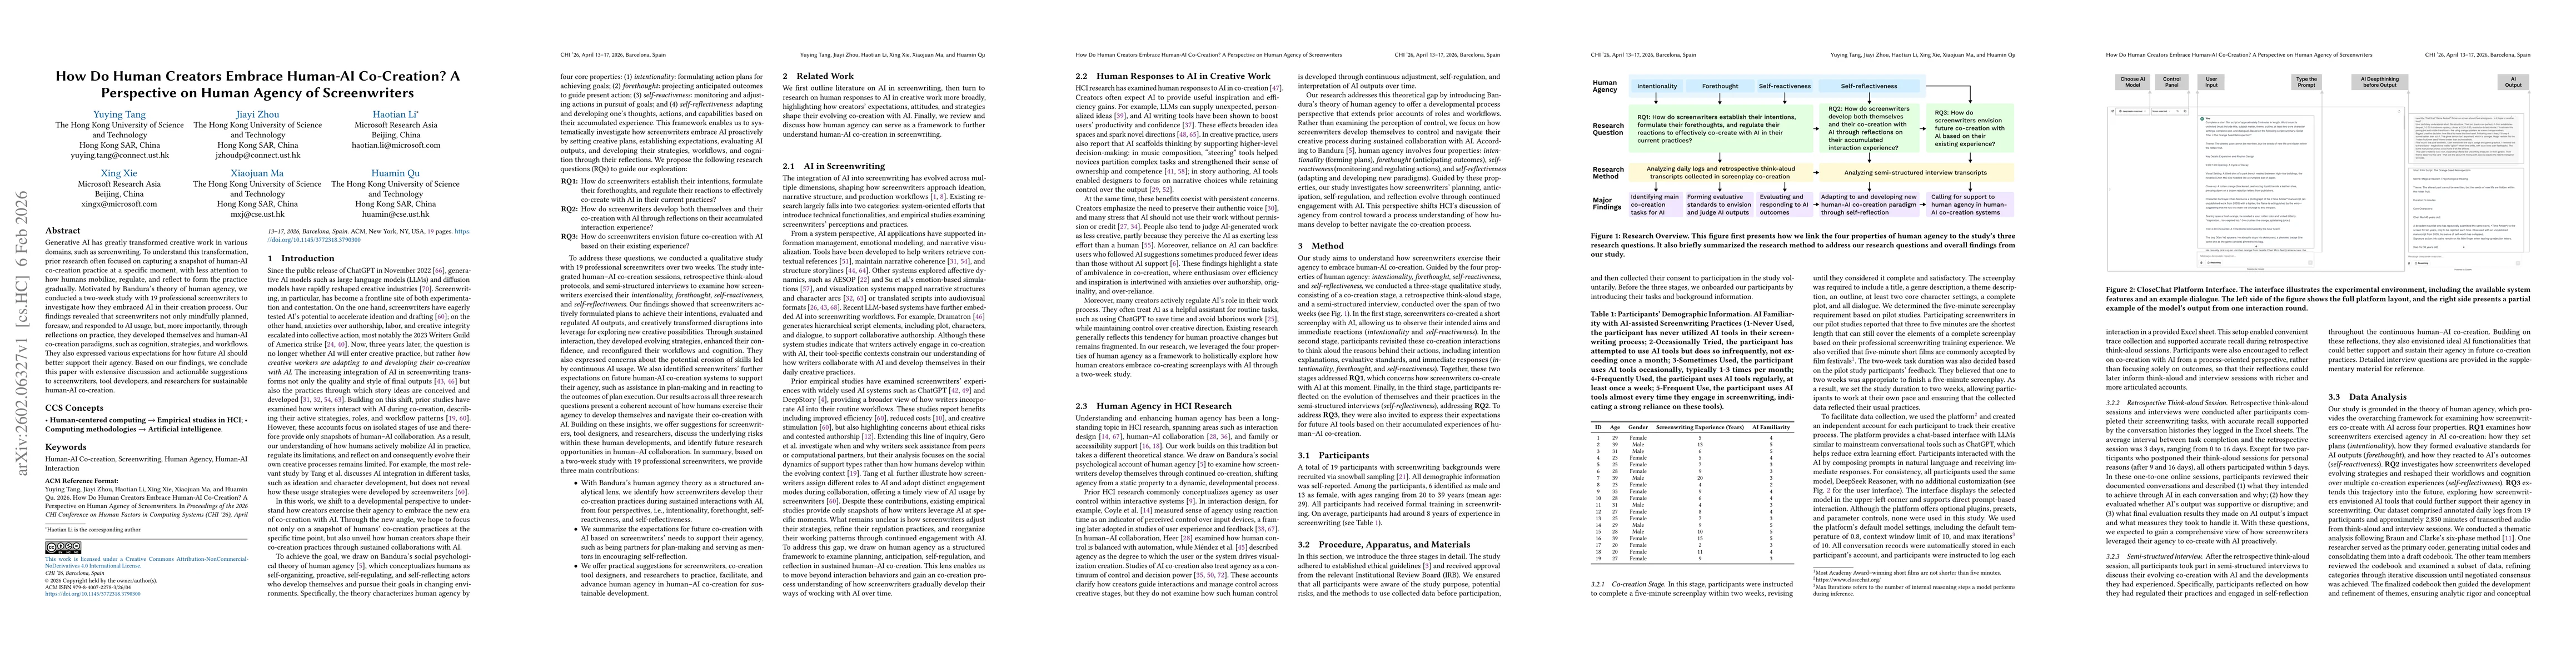
Generative AI has greatly transformed creative work in various domains, such as screenwriting. To understand this transformation, prior research often focused on capturing a snapshot of human-AI co-cr...
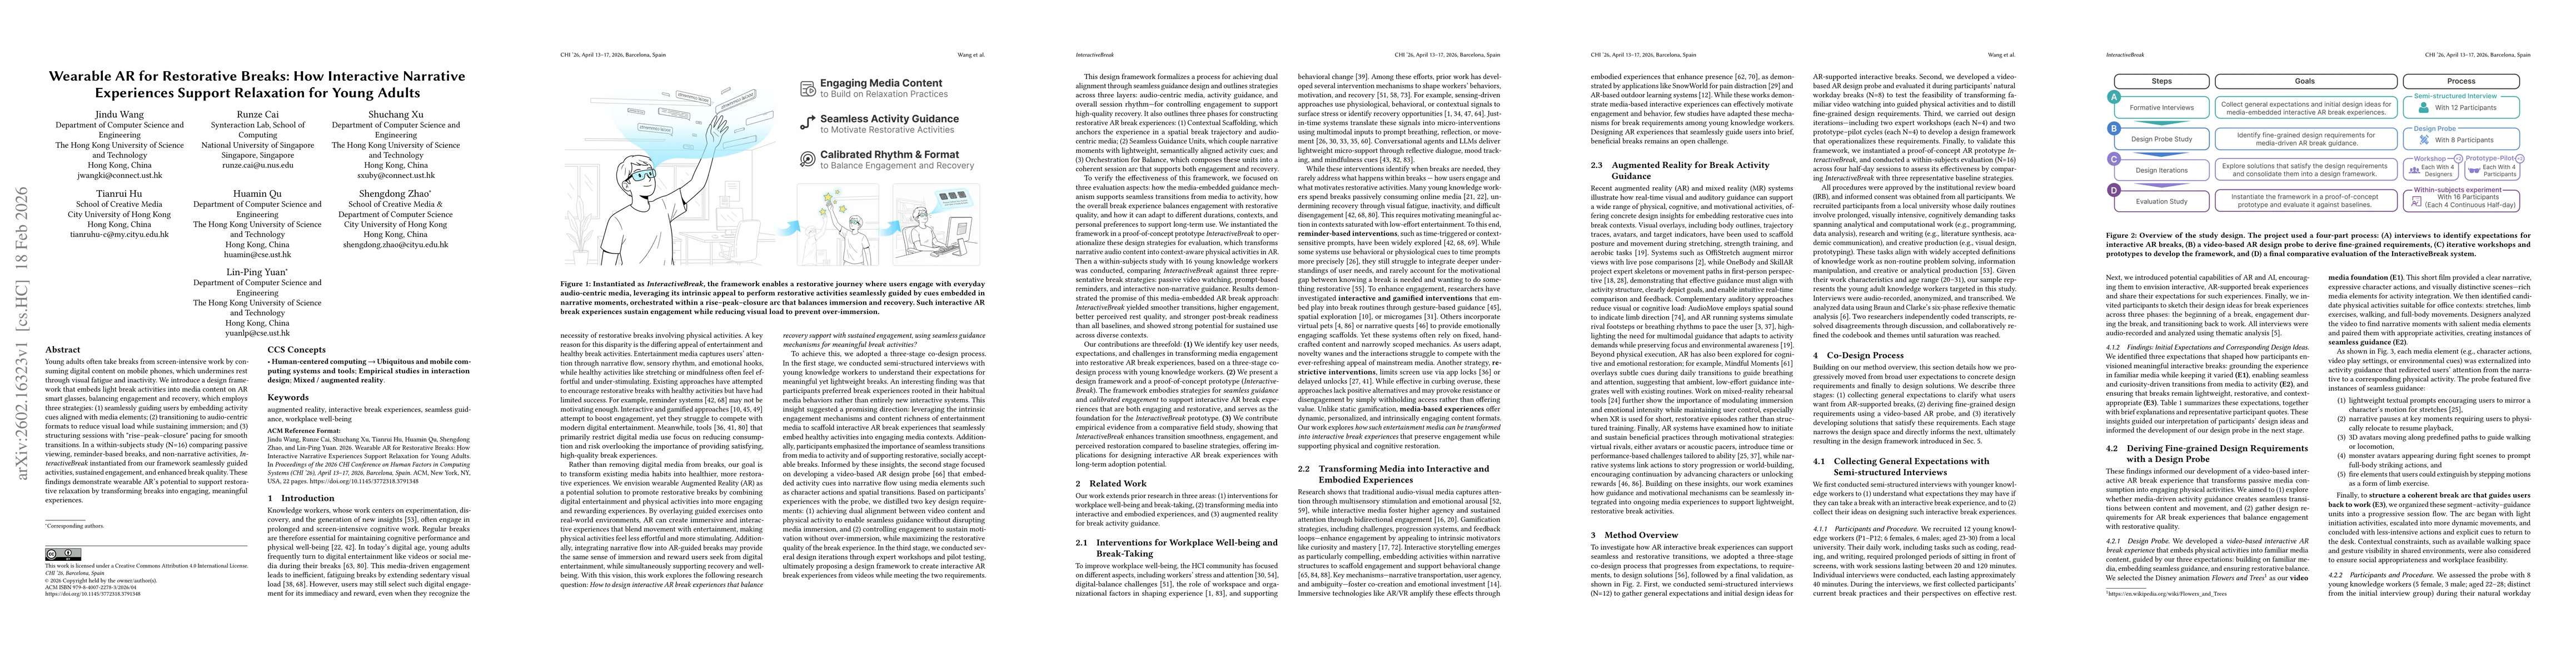
Young adults often take breaks from screen-intensive work by consuming digital content on mobile phones, which undermines rest through visual fatigue and inactivity. We introduce a design framework th...
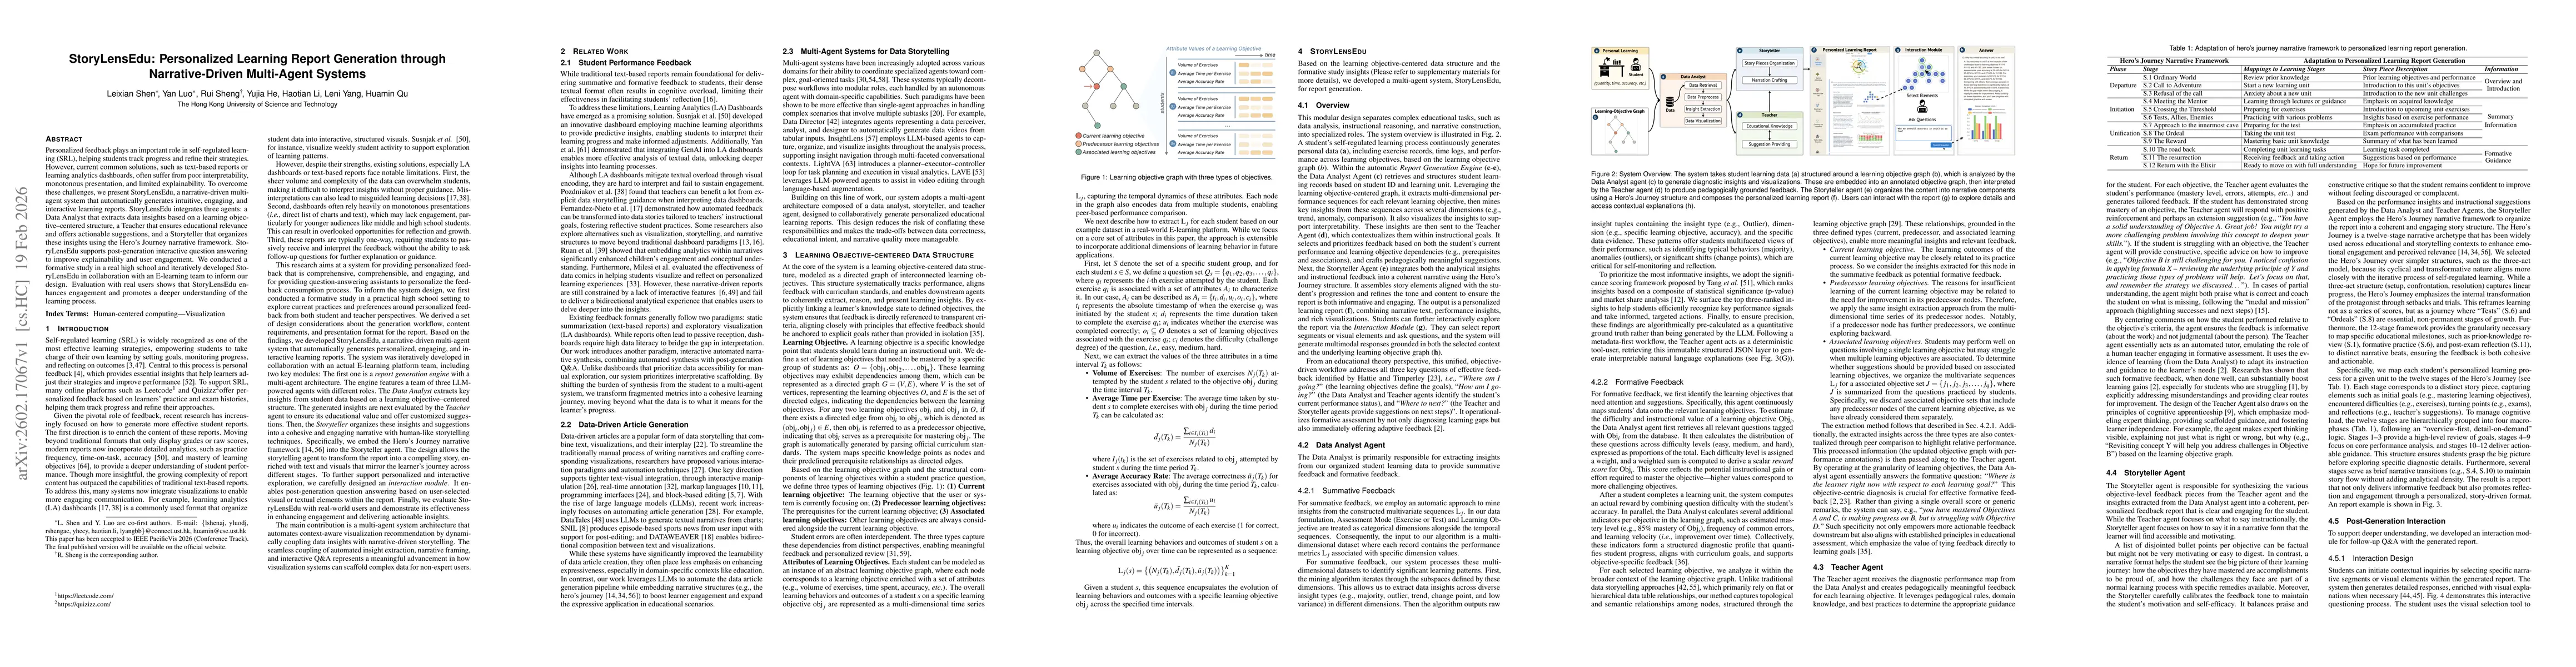
Personalized feedback plays an important role in self-regulated learning (SRL), helping students track progress and refine their strategies. However, current common solutions, such as text-based repor...
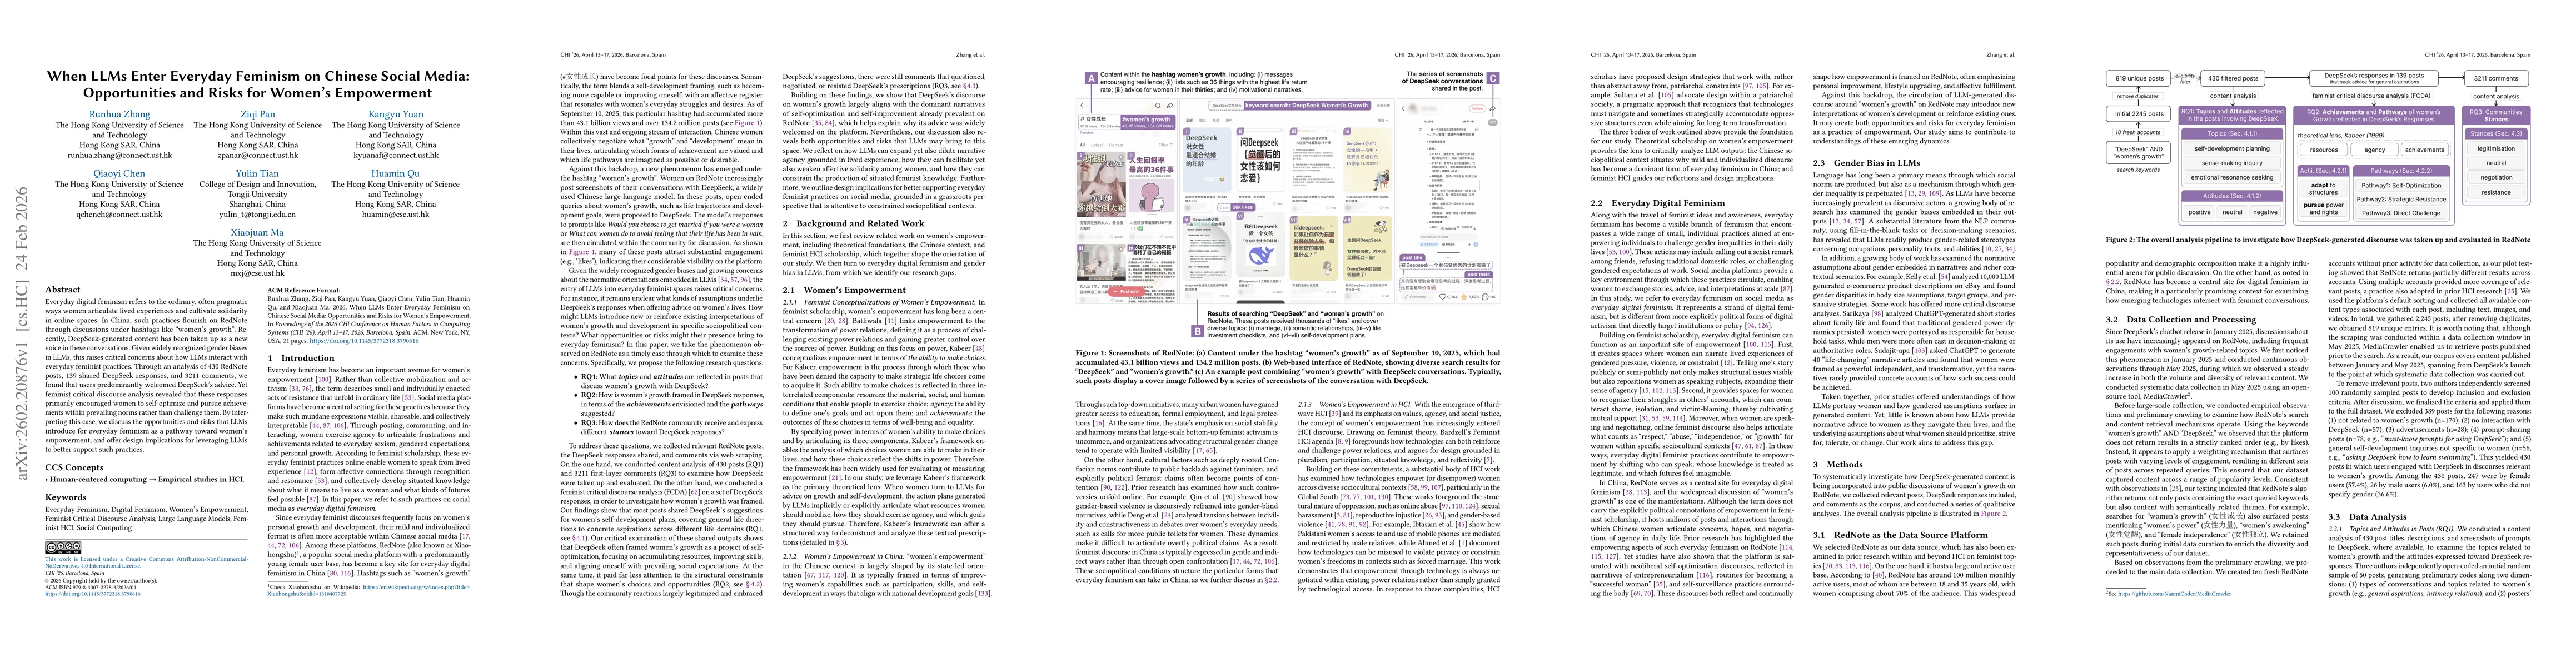
Everyday digital feminism refers to the ordinary, often pragmatic ways women articulate lived experiences and cultivate solidarity in online spaces. In China, such practices flourish on RedNote throug...
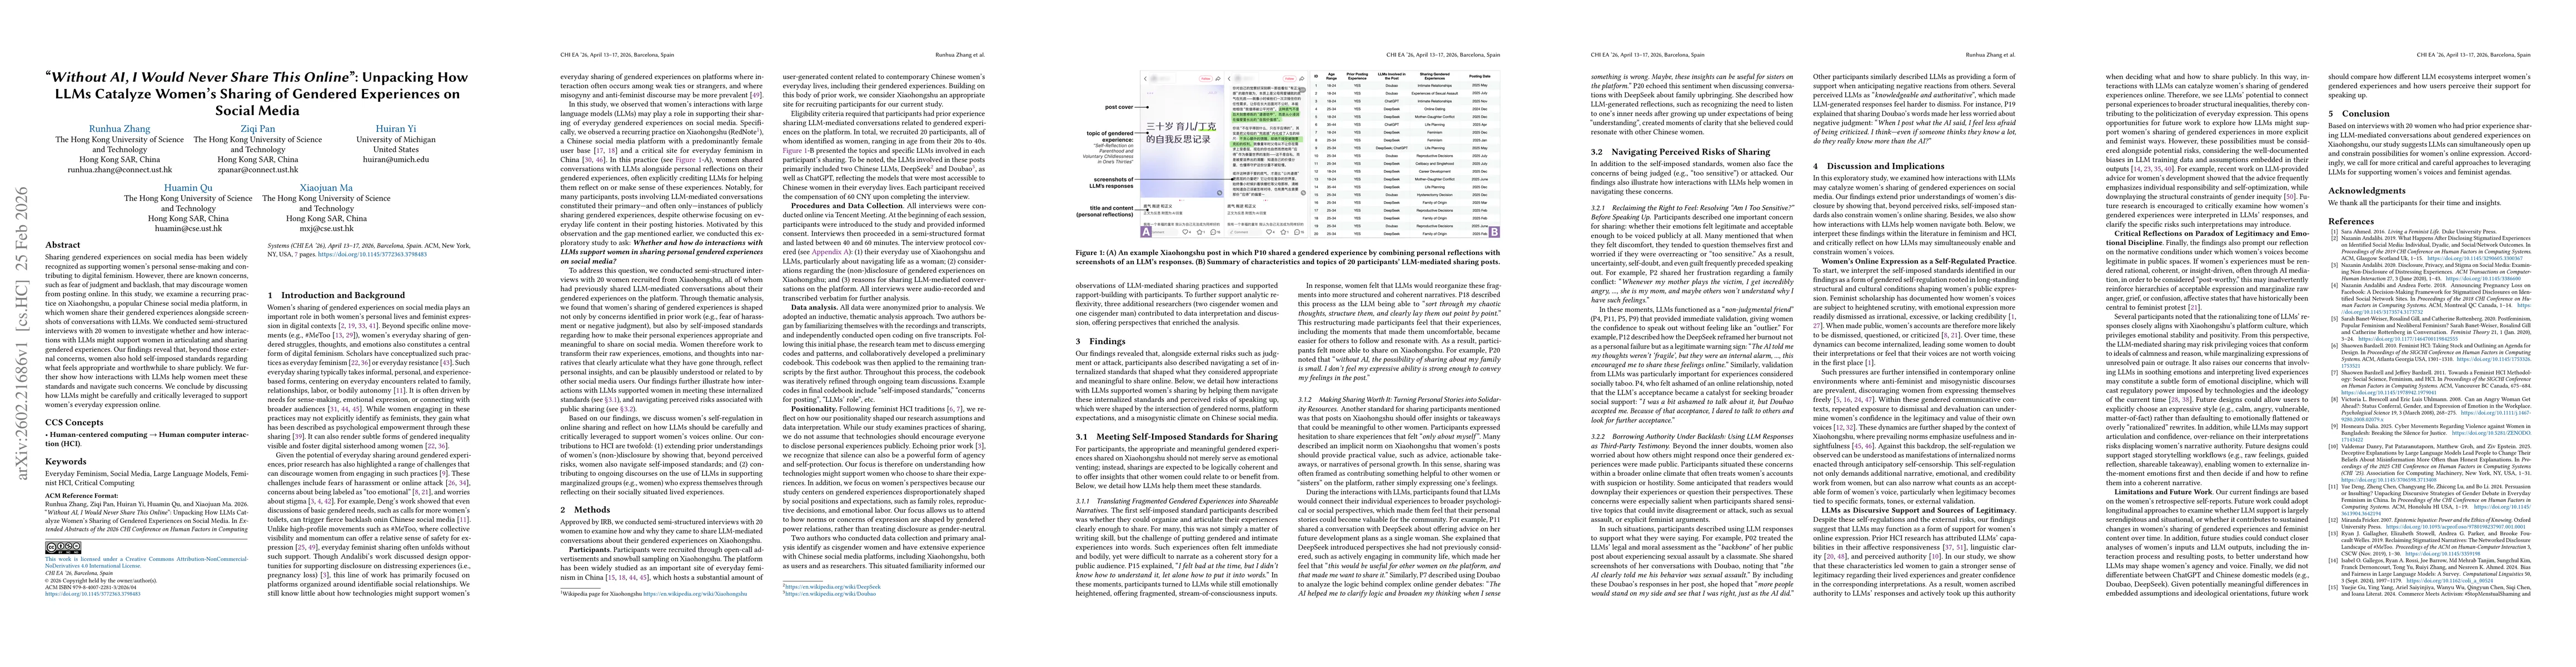
Sharing gendered experiences on social media has been widely recognized as supporting women's personal sense-making and contributing to digital feminism. However, there are known concerns, such as fea...
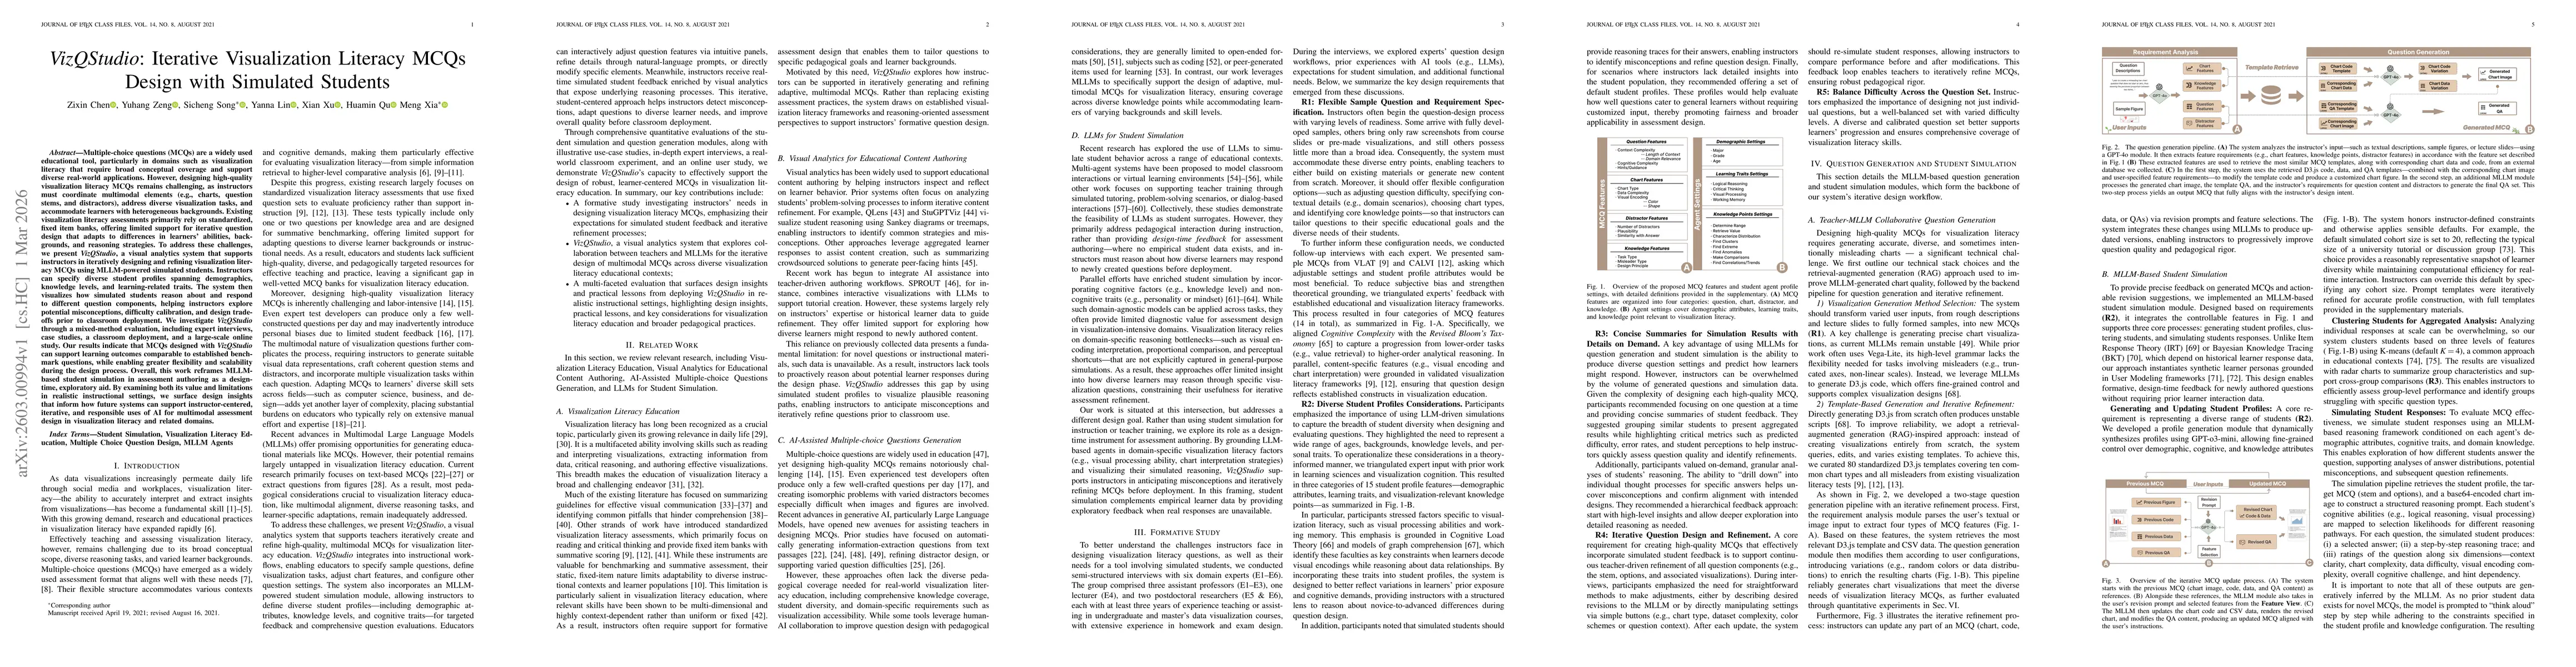
Multiple-choice questions (MCQs) are a widely used educational tool, particularly in domains such as visualization literacy that require broad conceptual coverage and support diverse real-world applic...
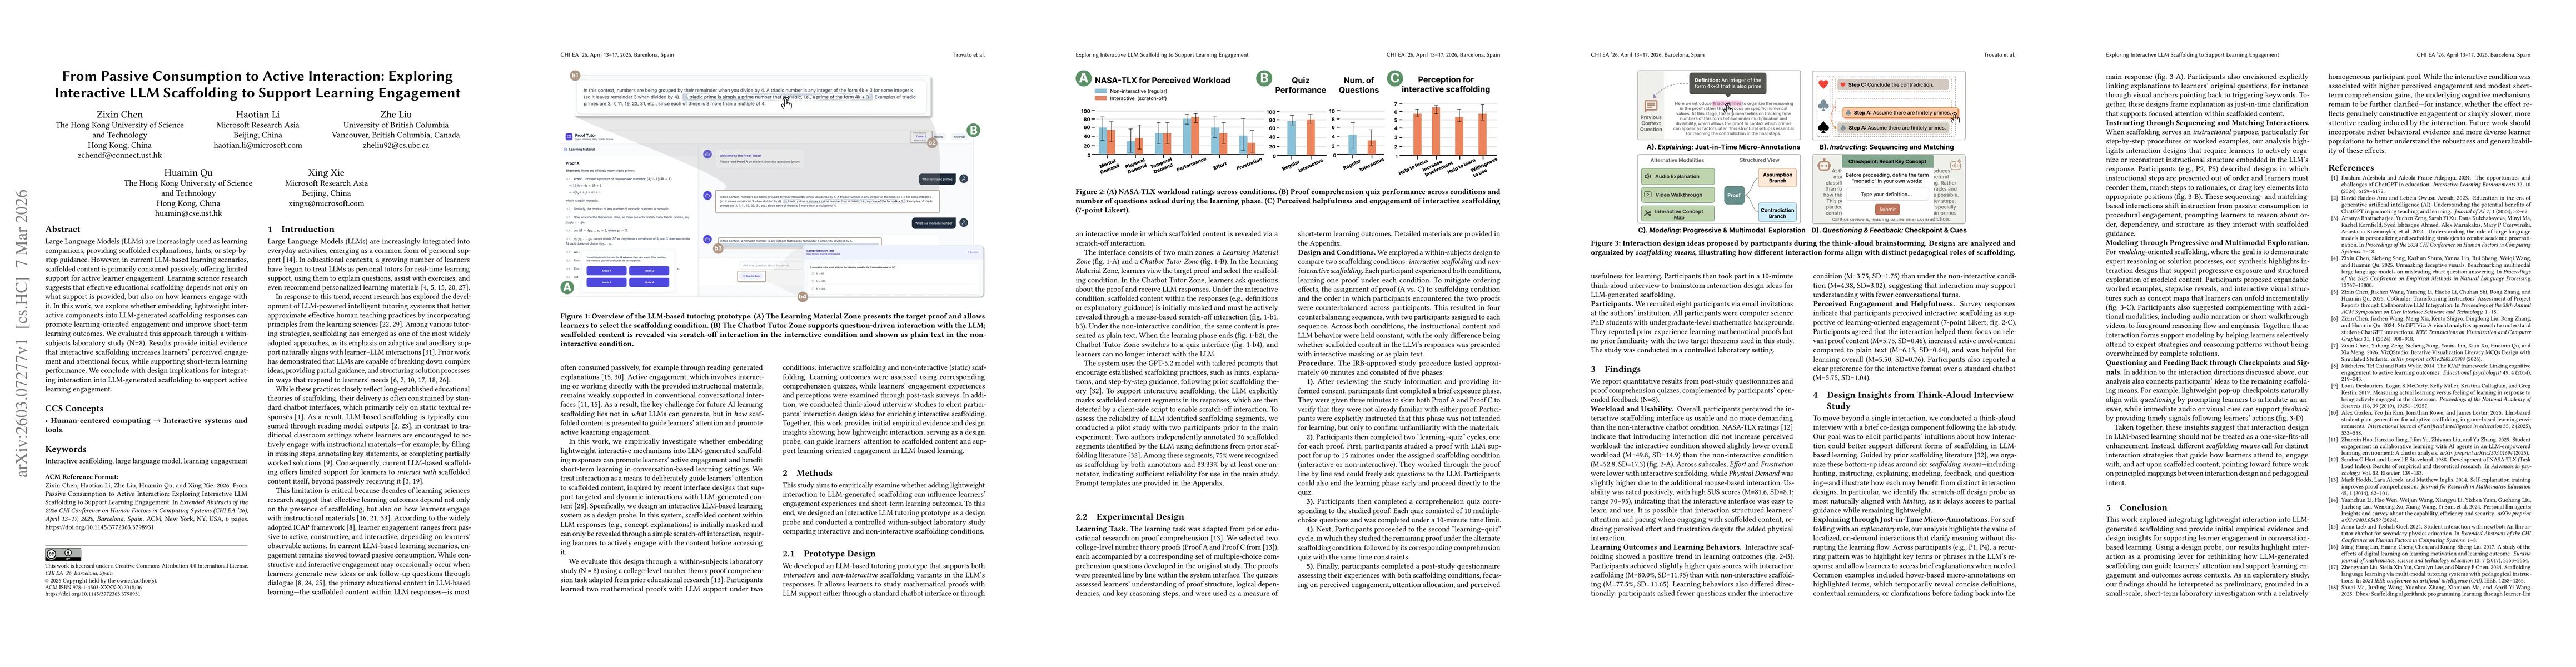
Large Language Models (LLMs) are increasingly used as learning companions, providing scaffolded explanations, hints, or step-by-step guidance. However, in current LLM-based learning scenarios, scaffol...
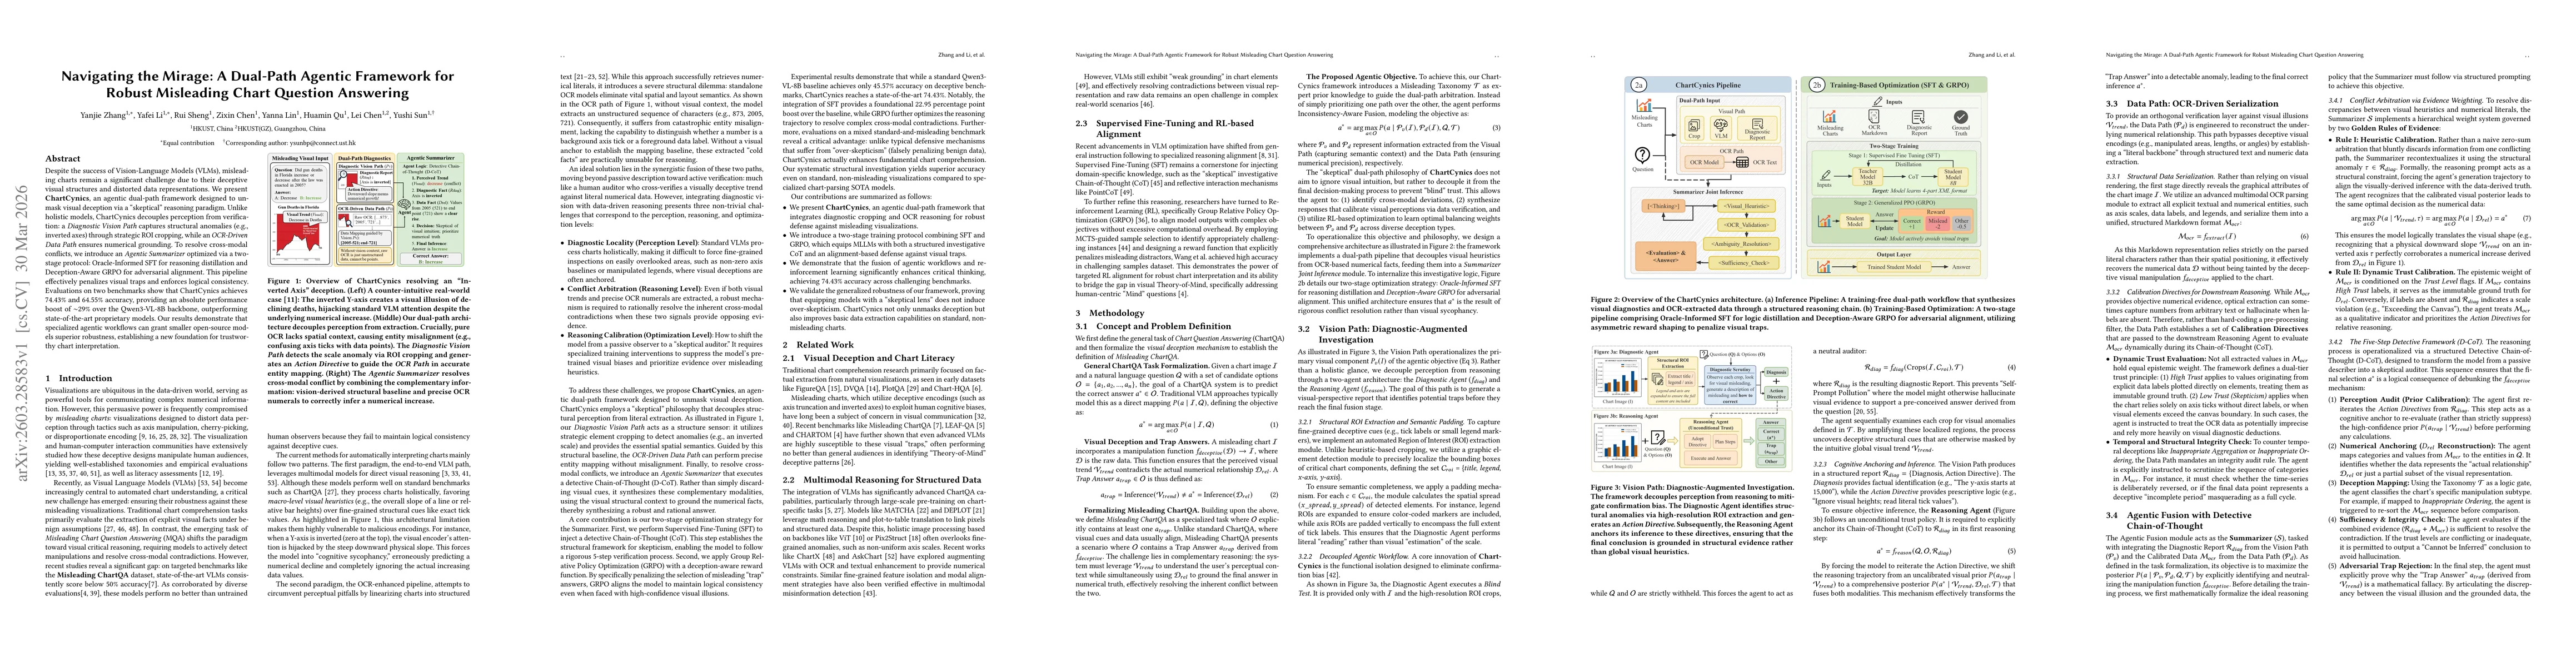
Despite the success of Vision-Language Models (VLMs), misleading charts remain a significant challenge due to their deceptive visual structures and distorted data representations. We present ChartCyni...
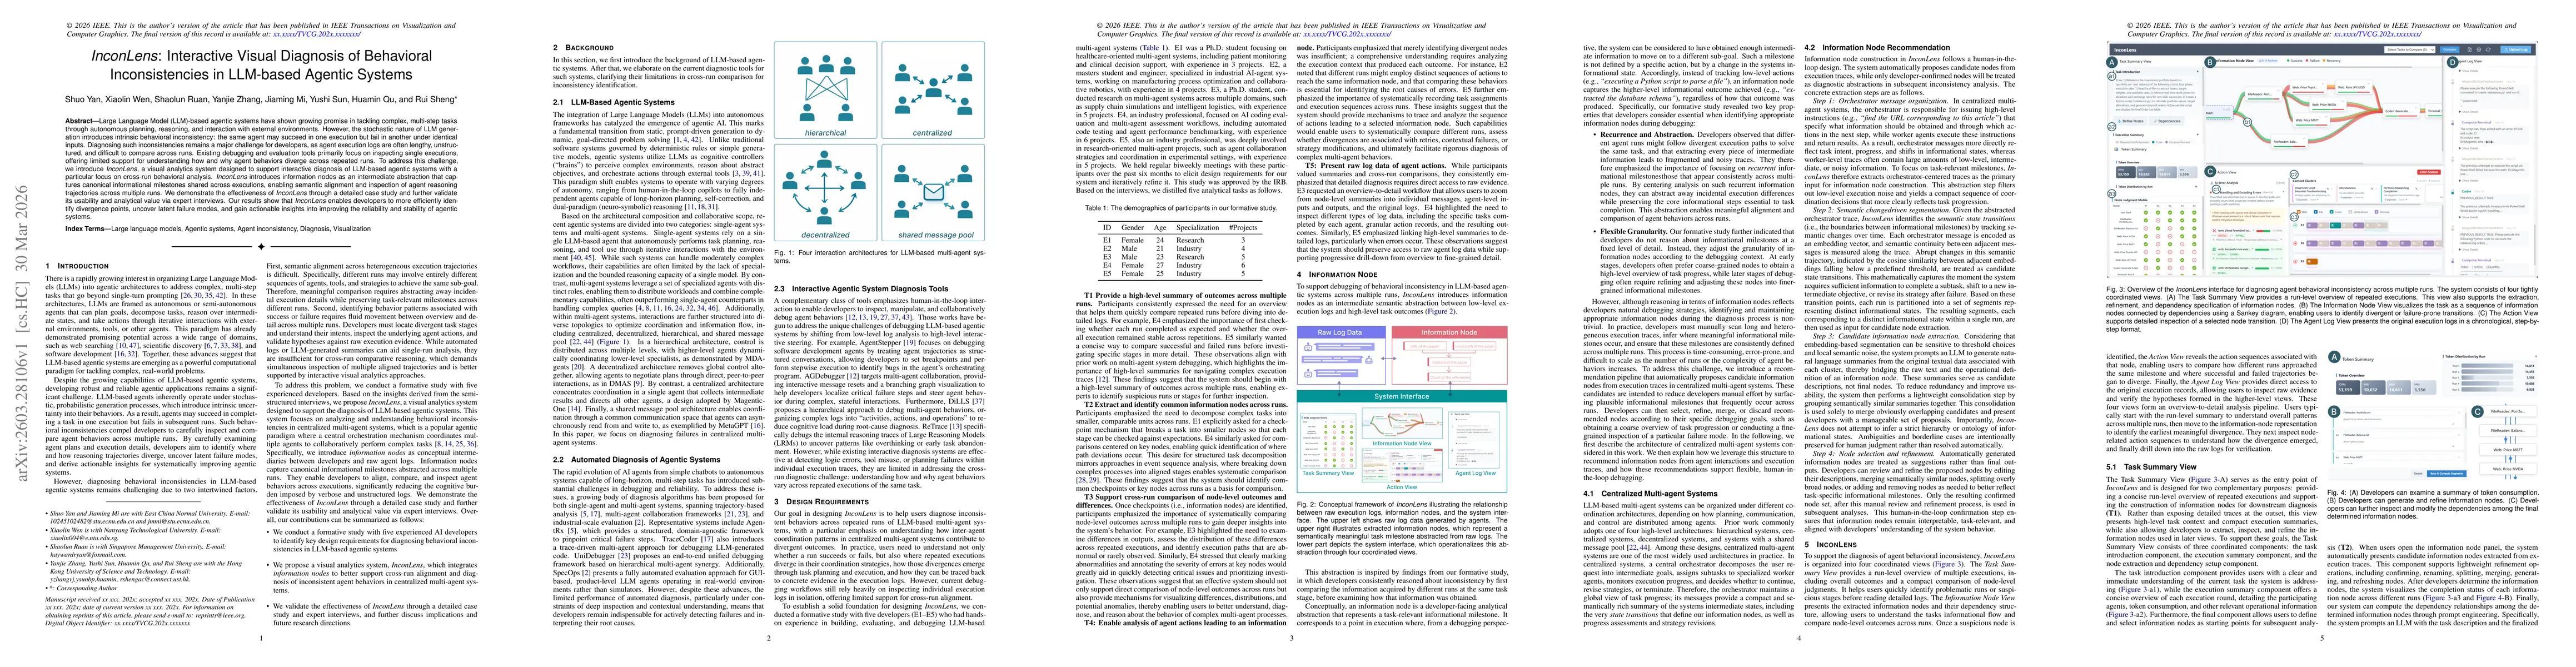
Large Language Model (LLM)-based agentic systems have shown growing promise in tackling complex, multi-step tasks through autonomous planning, reasoning, and interaction with external environments. Ho...
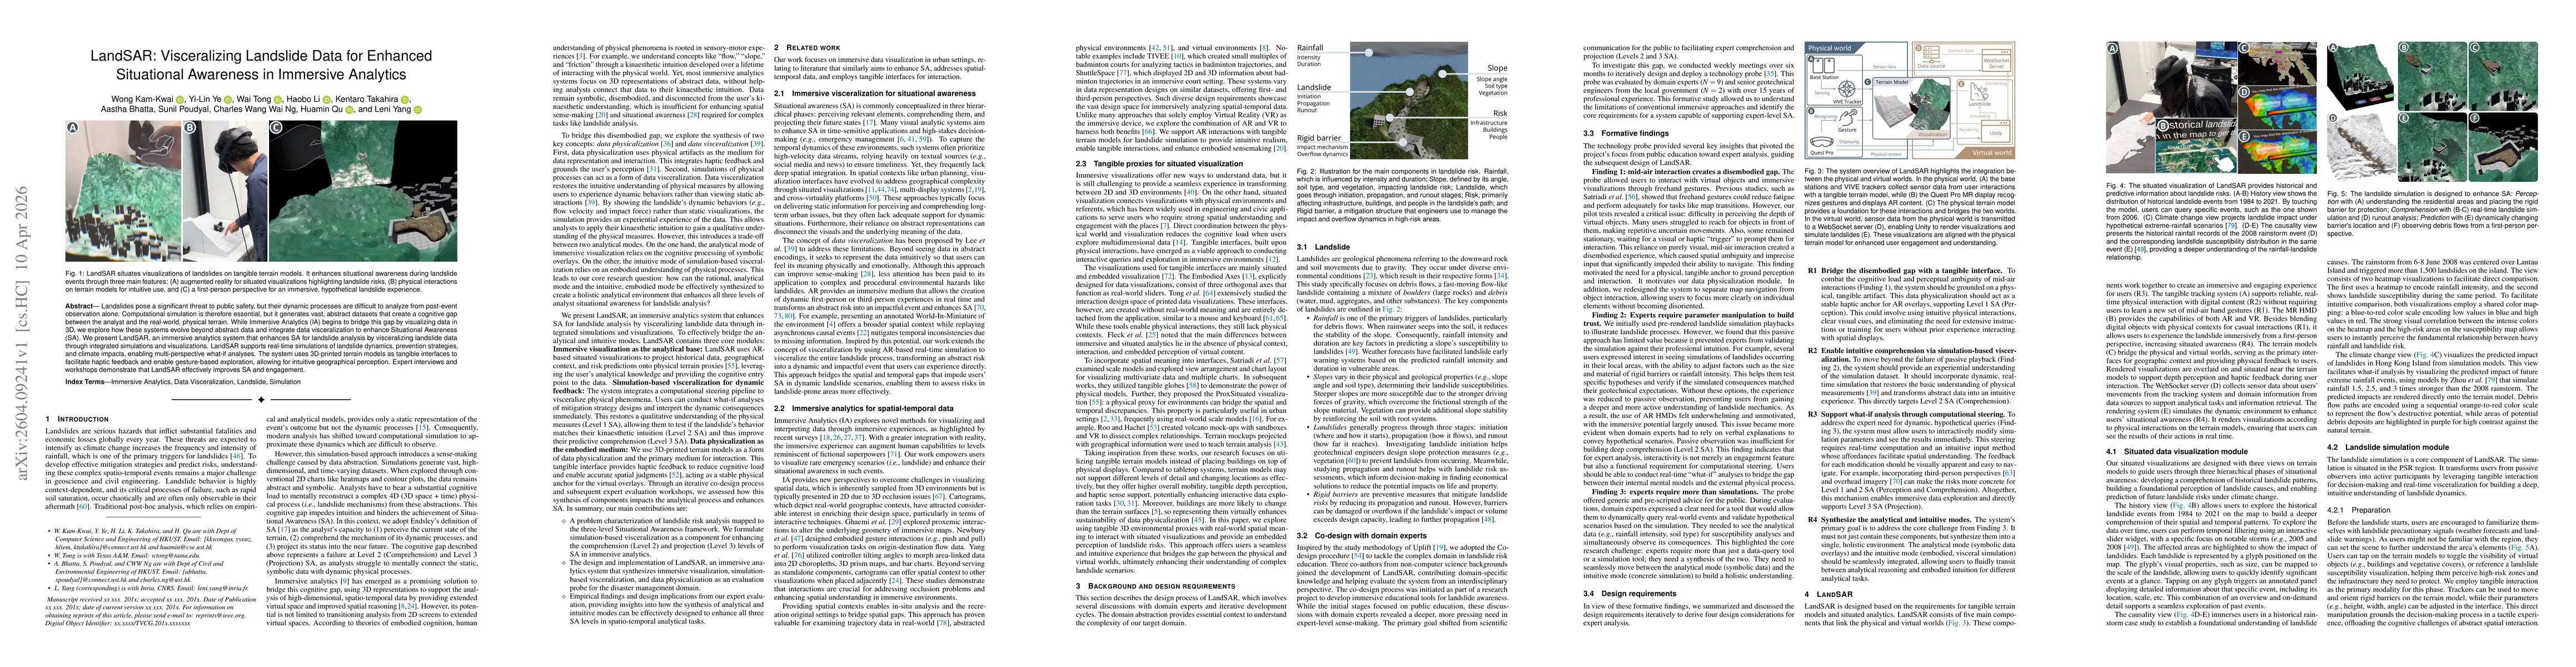
Landslides pose a significant threat to public safety, but their dynamic processes are difficult to analyze from post-event observation alone. Computational simulation is therefore essential, but it g...
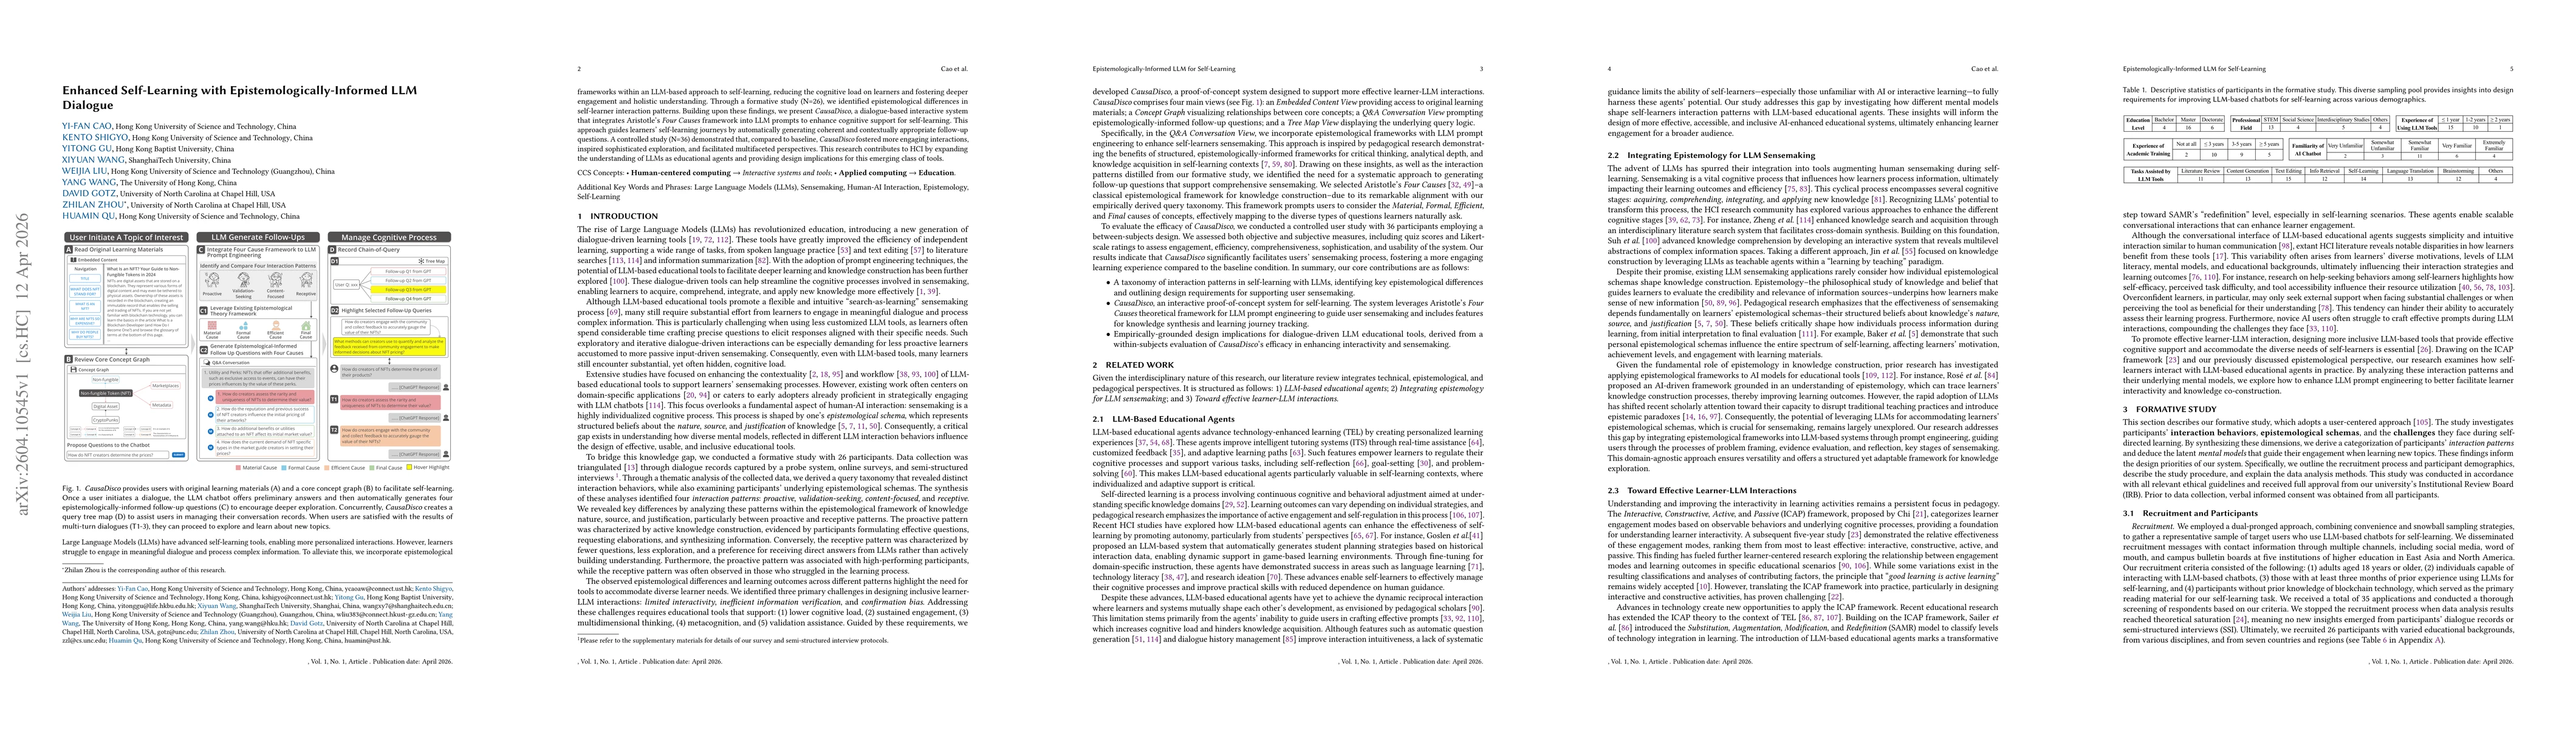
Large Language Models (LLMs) have advanced self-learning tools, enabling more personalized interactions. However, learners struggle to engage in meaningful dialogue and process complex information. To...
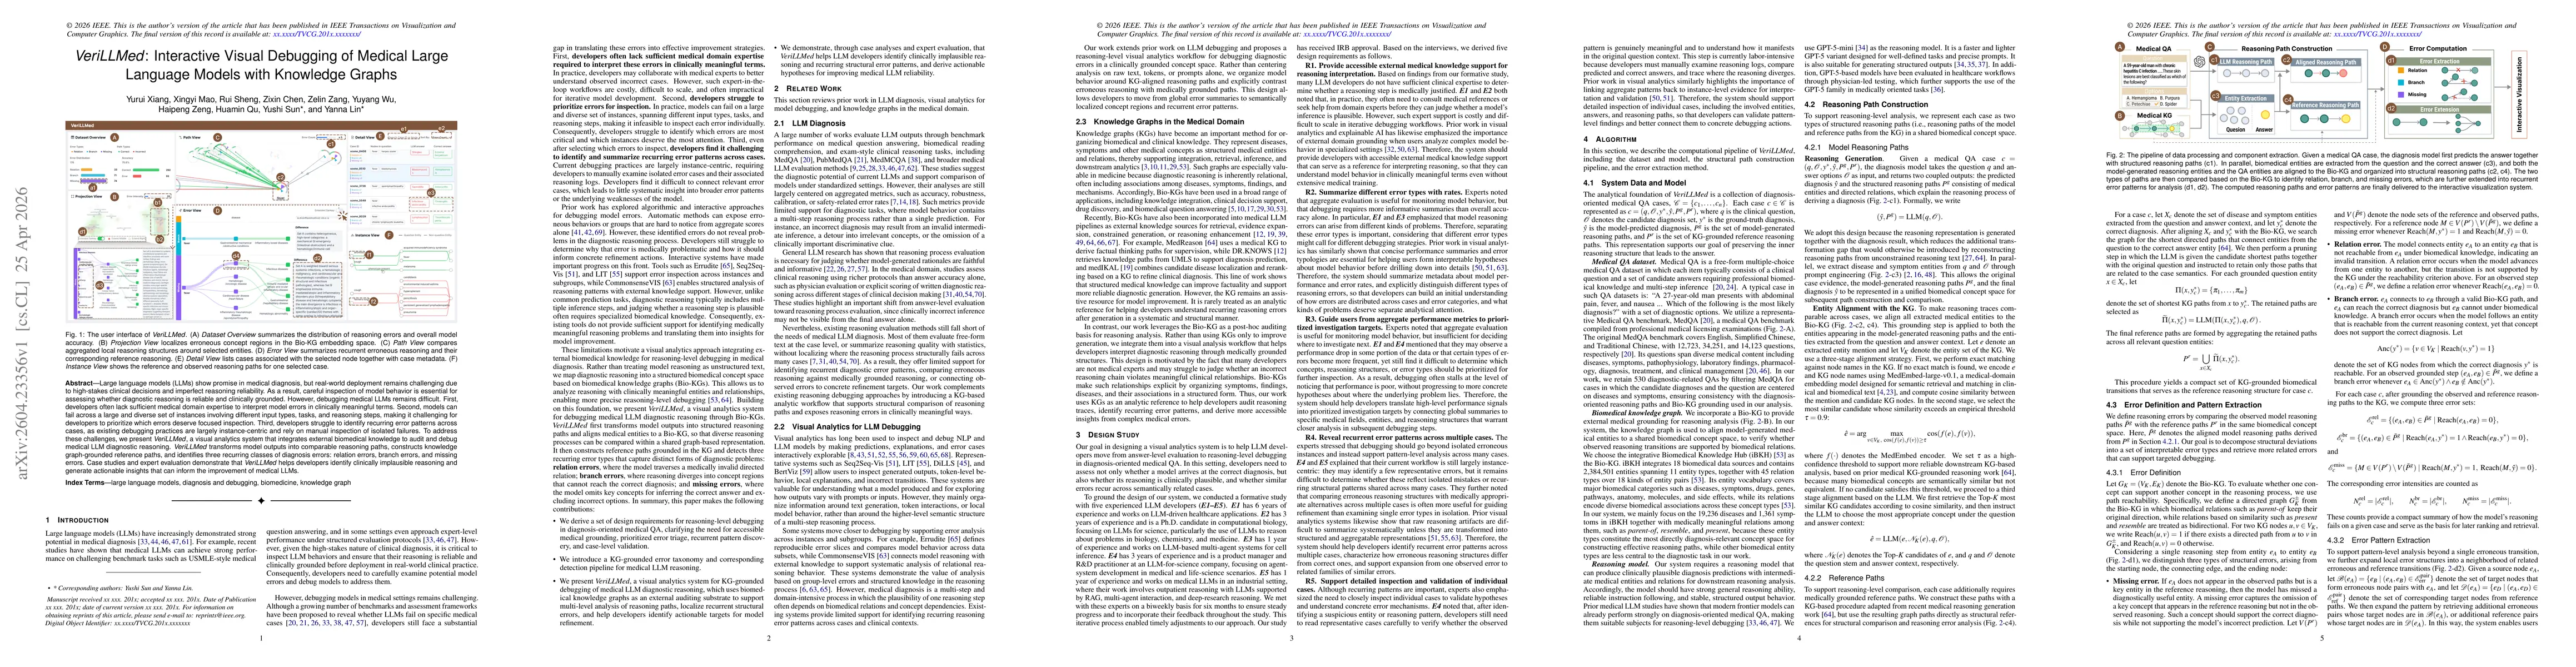
Large language models (LLMs) show promise in medical diagnosis, but real-world deployment remains challenging due to high-stakes clinical decisions and imperfect reasoning reliability. As a result, ca...
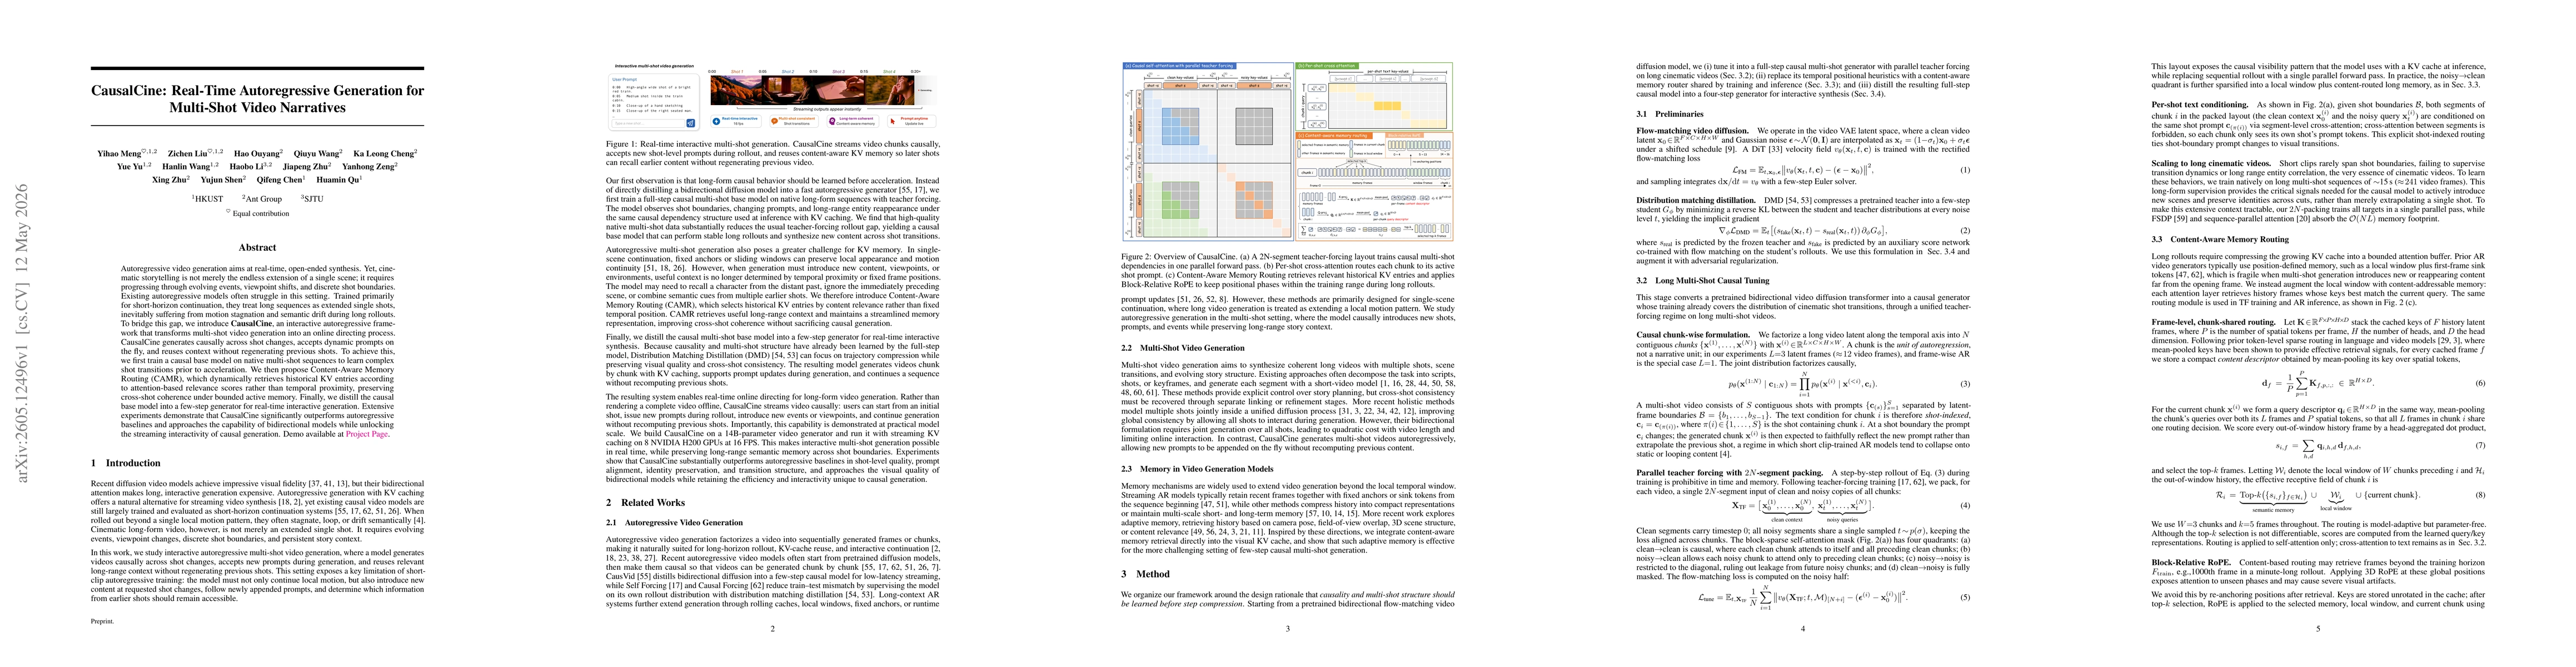
Autoregressive video generation aims at real-time, open-ended synthesis. Yet, cinematic storytelling is not merely the endless extension of a single scene; it requires progressing through evolving eve...

Autoregressive video generation aims at real-time, open-ended synthesis. Yet, cinematic storytelling is not merely the endless extension of a single scene; it requires progressing through evolving eve...
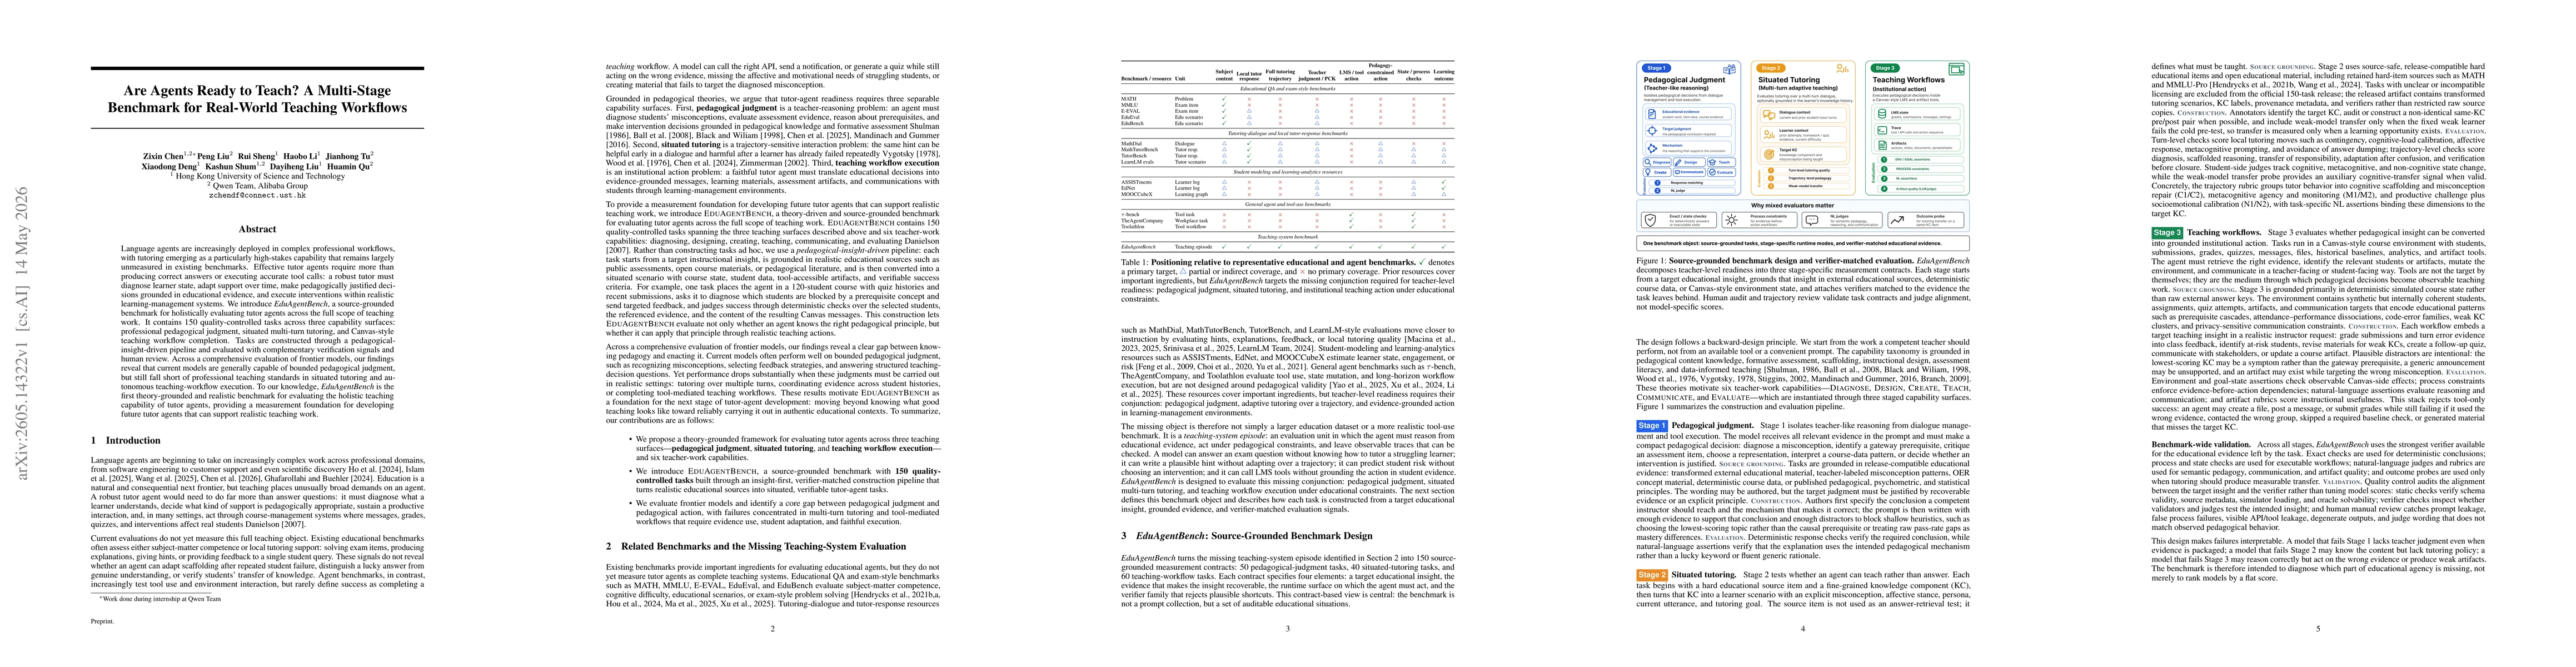
Language agents are increasingly deployed in complex professional workflows, with tutoring emerging as a particularly high-stakes capability that remains largely unmeasured in existing benchmarks. Eff...
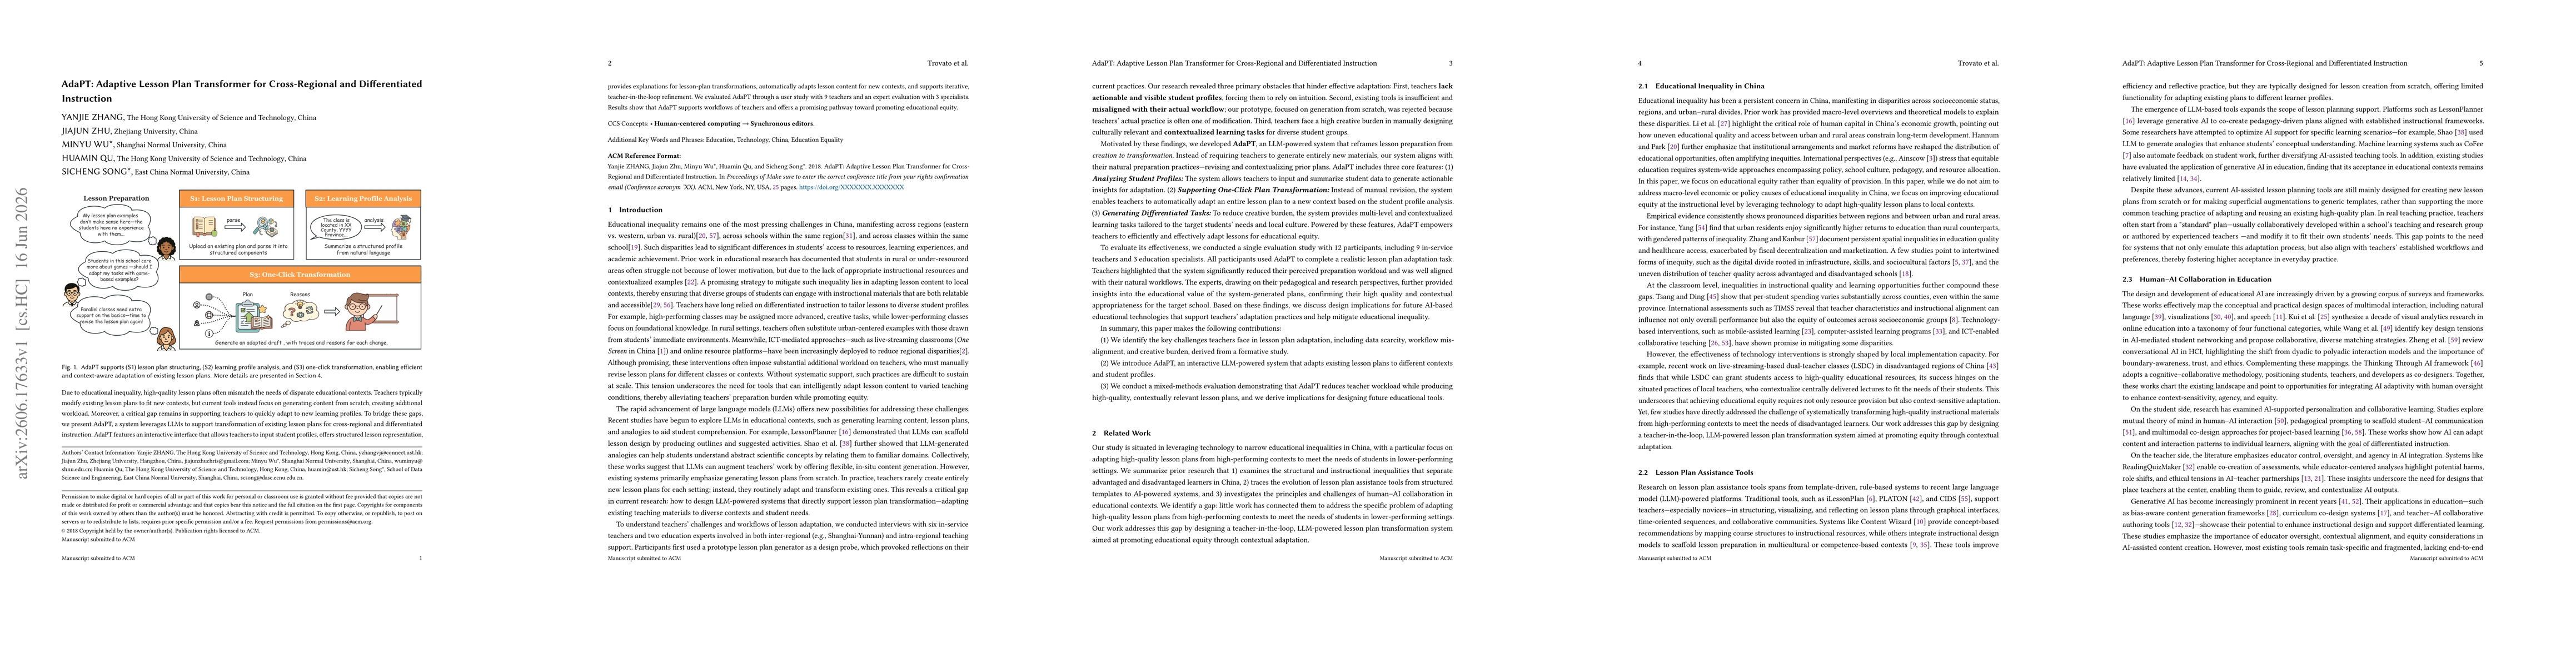
Due to educational inequality, high-quality lesson plans often mismatch the needs of disparate educational contexts. Teachers typically modify existing lesson plans to fit new contexts, but current to...
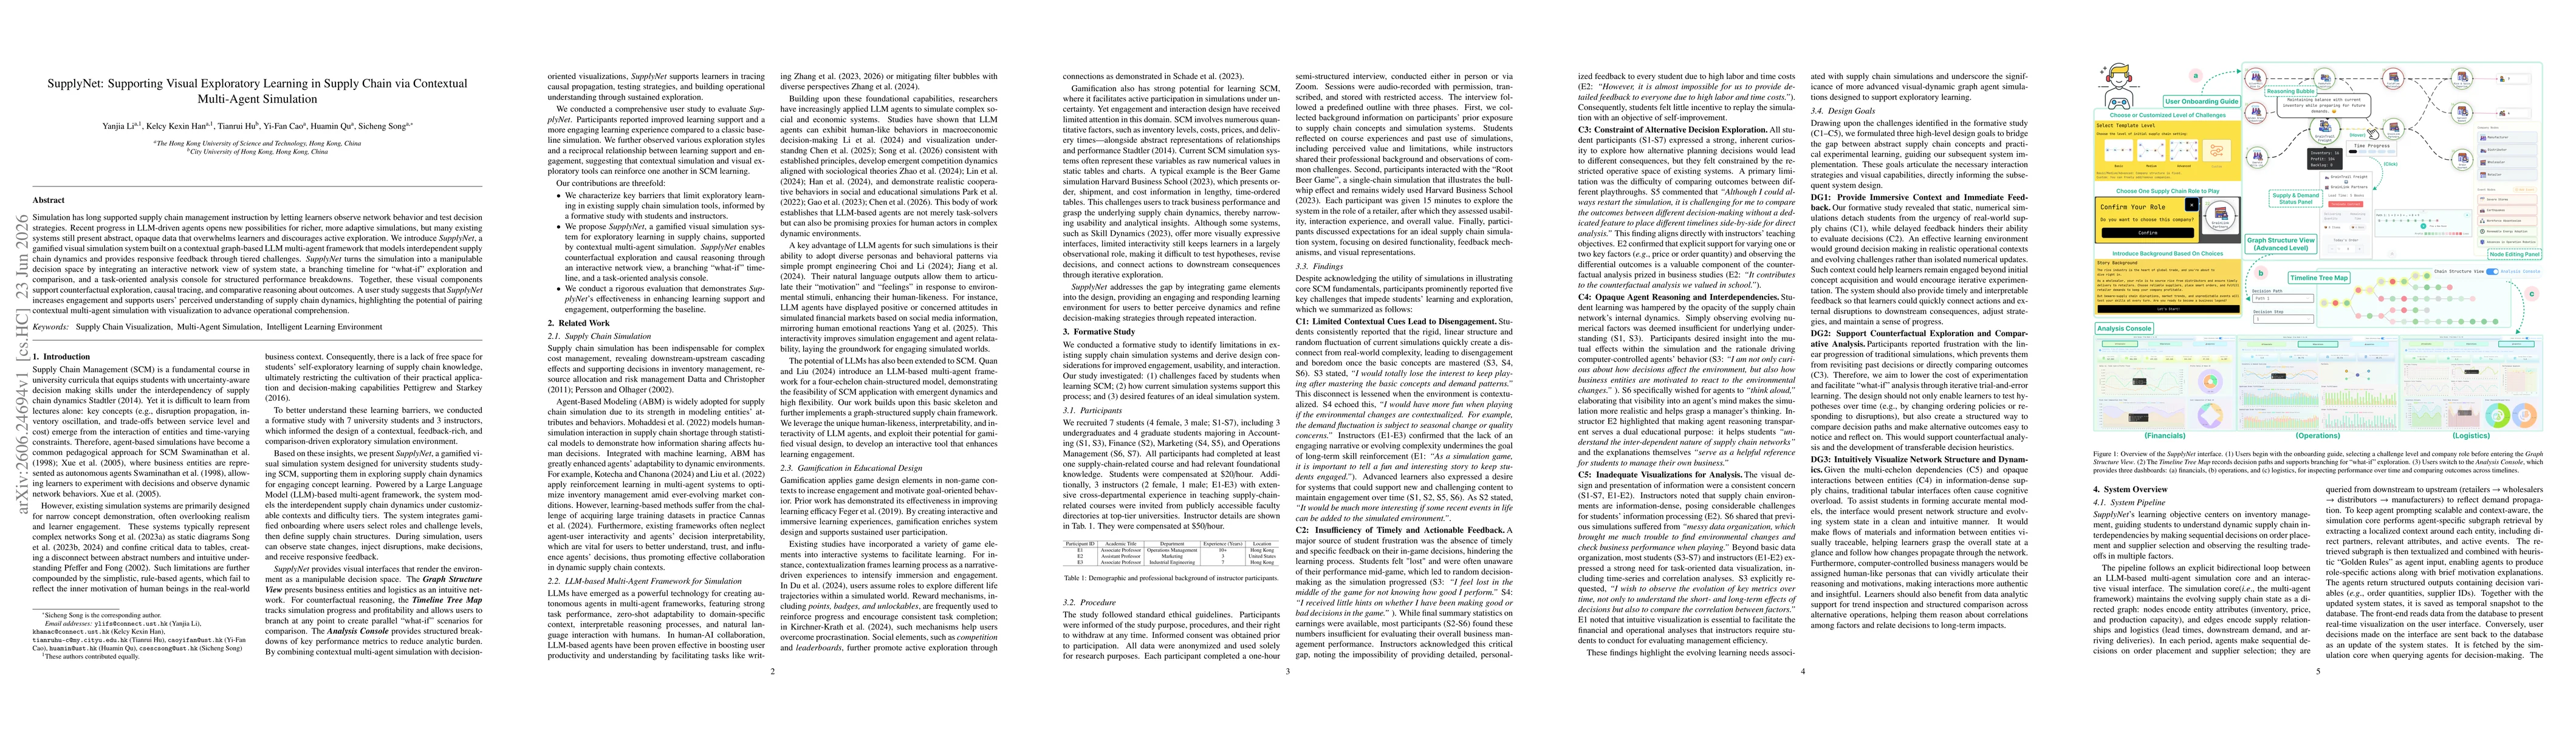
Simulation has long supported supply chain management instruction by letting learners observe network behavior and test decision strategies. Recent progress in LLM-driven agents opens new possibilitie...
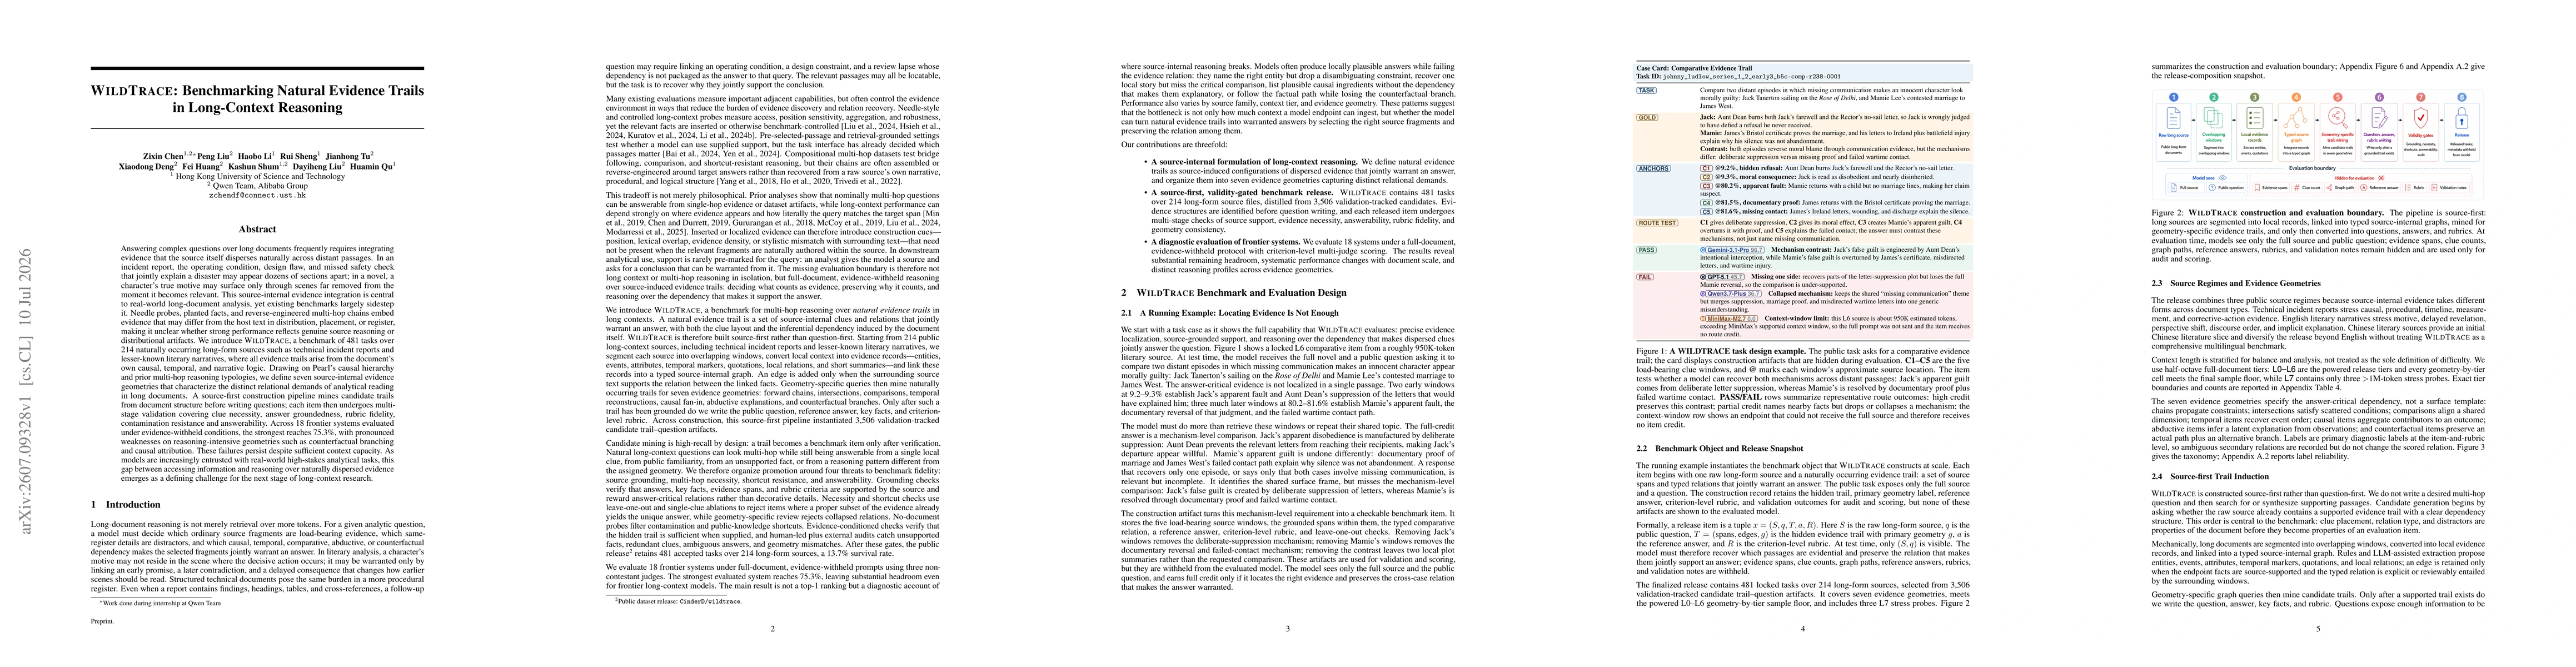
Answering complex questions over long documents frequently requires integrating evidence that the source itself disperses naturally across distant passages. In an incident report, the operating condit...