Quick Summary:

This paper introduces QLens, a visual analytics system that helps question designers analyze students' problem-solving behaviors to improve question design and distribution of questions based on student groups.

Summary

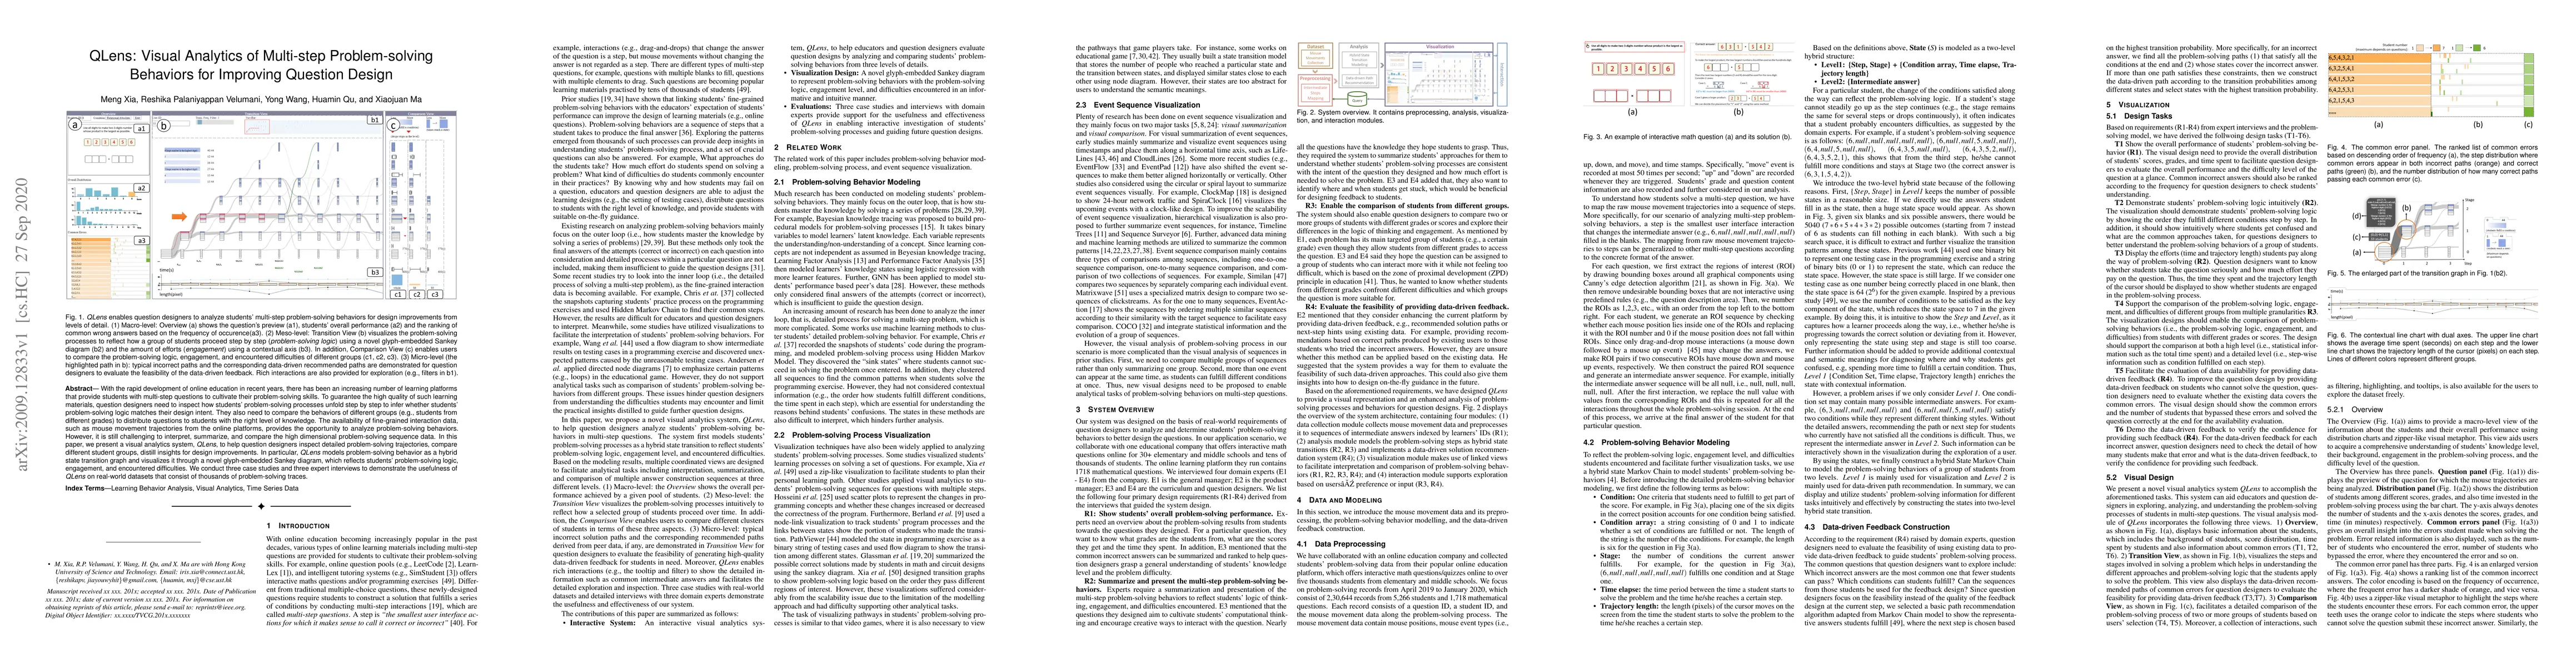
With the rapid development of online education in recent years, there has been an increasing number of learning platforms that provide students with multi-step questions to cultivate their problem-solving skills. To guarantee the high quality of such learning materials, question designers need to inspect how students' problem-solving processes unfold step by step to infer whether students' problem-solving logic matches their design intent. They also need to compare the behaviors of different groups (e.g., students from different grades) to distribute questions to students with the right level of knowledge. The availability of fine-grained interaction data, such as mouse movement trajectories from the online platforms, provides the opportunity to analyze problem-solving behaviors. However, it is still challenging to interpret, summarize, and compare the high dimensional problem-solving sequence data. In this paper, we present a visual analytics system, QLens, to help question designers inspect detailed problem-solving trajectories, compare different student groups, distill insights for design improvements. In particular, QLens models problem-solving behavior as a hybrid state transition graph and visualizes it through a novel glyph-embedded Sankey diagram, which reflects students' problem-solving logic, engagement, and encountered difficulties. We conduct three case studies and three expert interviews to demonstrate the usefulness of QLens on real-world datasets that consist of thousands of problem-solving traces.

AI Key Findings

Get AI-generated insights about this paper's methodology, results, and significance.

Paper Details

PDF Preview

Download PDF

Key Terms

students (0.325)
students (0.304)
solving (0.259)
solving (0.257)
platforms (0.175)
logic (0.174)
platforms (0.172)
problem (0.169)
trajectories (0.168)
behaviors (0.166)
problem (0.165)
logic (0.163)
step (0.161)
behaviors (0.160)
step (0.158)
questions (0.158)
questions (0.156)
trajectories (0.156)
compare (0.155)
compare (0.153)

Citation Network

Current paper (gray), citations (green), references (blue)

Current Paper
Citations
References
Click to view
Title Authors Year Actions
InsProg: Supporting Teaching Through Visual Analysis of Students’ Programming Processes
Hongyan Zhong, Jun Niu, Junjie Li
2024
View Paper
ConceptThread: Visualizing Threaded Concepts in MOOC Videos
Zhiguang Zhou, Li Ye, Lihong Cai, Lei Wang, Yigang Wang, Yongheng Wang, Wei Chen, Yong Wang
2024
View Paper
Visualization of potential differences in comprehension by distribution of notes and questions in online programming courses
Xiaonan Wang, H. Kiyomitsu, Yancong Su, Kazuhiro Ohtsuki, Yi Sun, Kento Shigyo
2023
View Paper
Visual analytics of potential dropout behavior patterns in online learning based on counterfactual explanation
Huijie Zhang, Jialu Dong, Cheng Lv, Yiming Lin, Jinghan Bai
2022
View Paper
A Study of Interaction Design for E-learning System Based on Distributed Asynchronous Communication
Xiaonan Wang, Yi Sun, Yancong Su
2022
View Paper
Towards a better understanding of the role of visualization in online learning: A review
Gefei Zhang, Zihao Zhu, Sujia Zhu, Ronghua Liang, Guodao Sun
2022
View Paper
A survey of visual analytics techniques for online education
Xiaoyan Kui, Naiming Liu, Qiang Liu, Jingwei Liu, Xiaoqian Zeng, Chao Zhang
2022
View Paper
Design of a Unique Deep Learning Framework for Enhancing High-school Student-inclination Prediction through Bioinspired Computing Model Augmentation
Ashwini Raipure, Rais Abdul Hamid Khan
2022
View Paper
BlockLens: Visual Analytics of Student Coding Behaviors in Block-Based Programming Environments
Sean Tsung, Huan Wei, Haotian Li, Yong Wang, Meng Xia, Huamin Qu
2022
View Paper
A Survey on Visual Analysis of Massive Open Online Courses (MOOC) Data
Zhiguang Zhou, Saqing Wang, Yuhua Liu, Y. Wang, Yigang Wang
2022
View Paper
Mobile-Friendly Content Design for MOOCs: Challenges, Requirements, and Design Opportunities
Jeongyeon Kim, Yubin Choi, Menglin Xia, Juho Kim
2021
View Paper
A Visualization Approach for Monitoring Order Processing in E-Commerce Warehouse
Junxiu Tang, Yuhua Zhou, Tan Tang, Di Weng, Boyang Xie, Lingyun Yu, Huaqiang Zhang, Yingcai Wu
2021
View Paper
MulUBA: multi-level visual analytics of user behaviors for improving online shopping advertising
Shangsong Liu, Di Peng, Haotian Zhu, Xiaolin Wen, Xinyi Zhang, Zhenghao Zhou, Min Zhu
2021
View Paper
Visual Analytics Methods for Interactively Exploring the Campus Lifestyle
Liang Liu, Song Wang, Ting Cai, Hanglin Li, Weixin Zhao, Yadong Wu
2021
View Paper
A Visual Analytics Approach to Facilitate the Proctoring of Online Exams
Haotian Li, Min Xu, Yong Wang, Huan Wei, Huamin Qu
2021
View Paper
Involving Teachers in the Data-Driven Improvement of Intelligent Tutors: A Prototyping Study
Meng Xia, Xinyi Zhao, Dong Sun, Yun Huang, J. Sewall, V. Aleven
2023
View Paper
Hierarchical Sankey Diagram: Design and Evaluation
Willis P. Porter, Conor P. Murphy, David R. Williams, Brendan J. O'Handley, Chaoli Wang
2021
View Paper

Comments (0)

This website uses cookies to ensure you get the best experience. Learn more