What User Behaviors Make the Differences During the Process of Visual Analytics?
Publication
Metrics
AI Quick Summary
This study investigates how user behaviors differ during visual analytics processes, employing time-series classification to analyze user interactions in Covid-19 data analysis tasks. The findings reveal distinct user behaviors linked to specific visualization tasks, suggesting a strong association between physical actions and analytical tasks, and demonstrating the potential of automated sensemaking analysis.
Paper Preview
Abstract
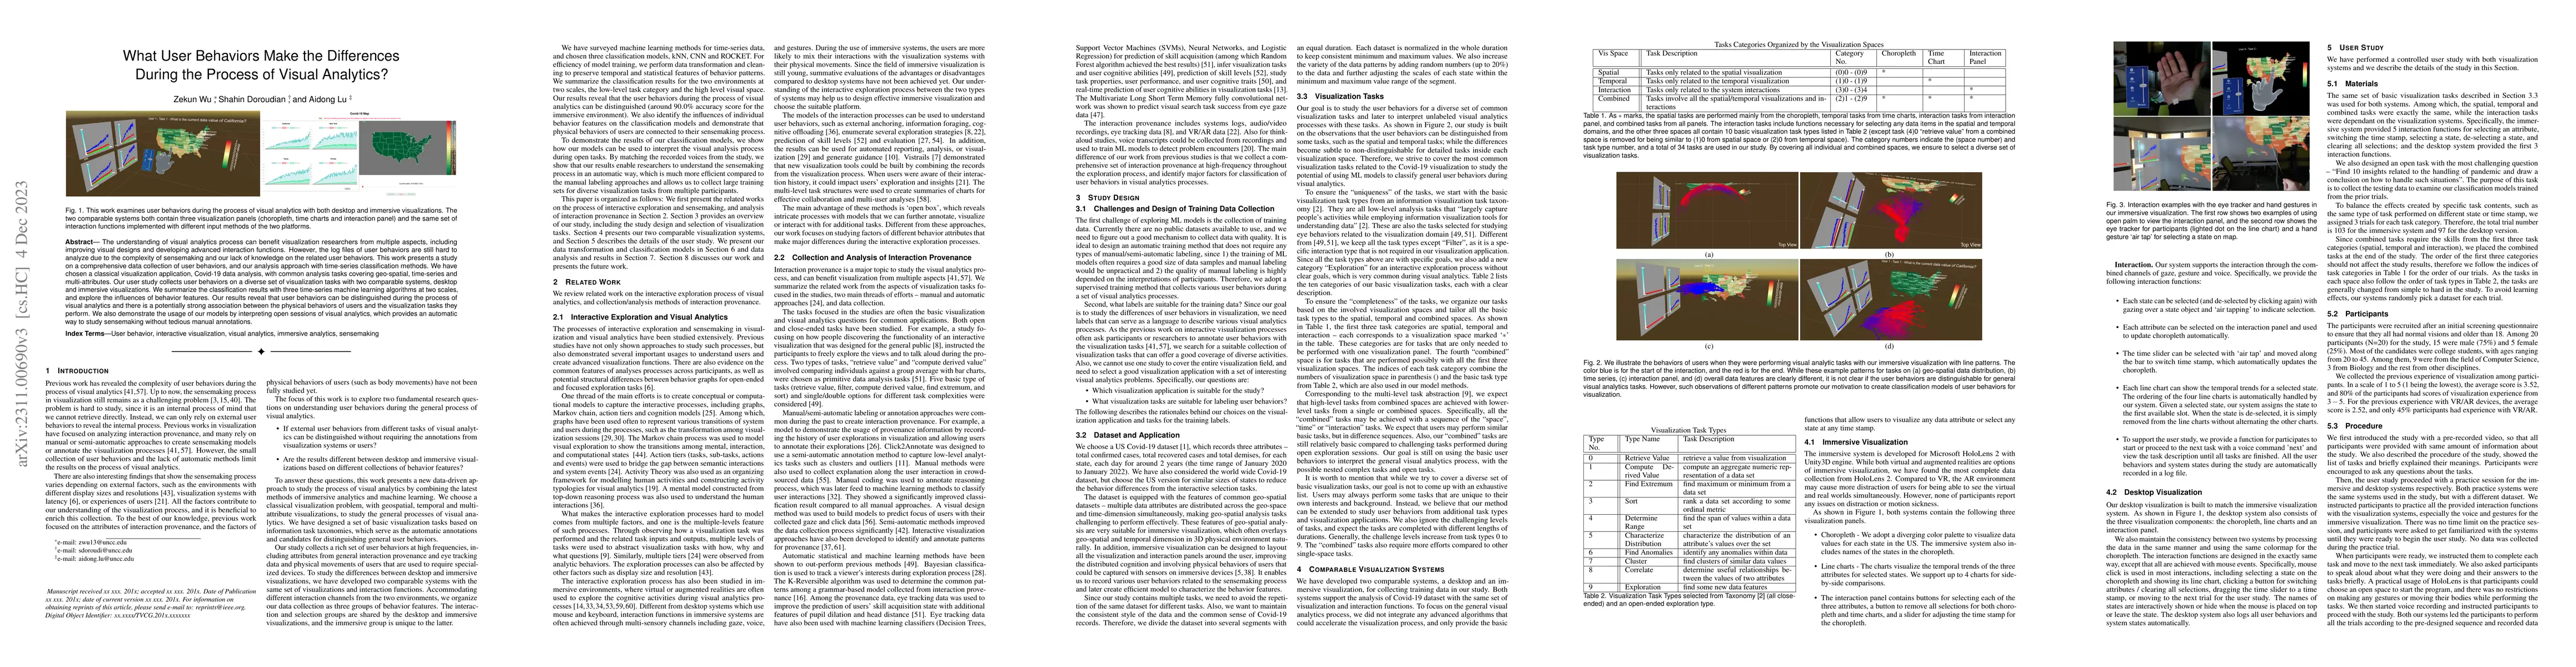
The understanding of visual analytics process can benefit visualization researchers from multiple aspects, including improving visual designs and developing advanced interaction functions. However, the log files of user behaviors are still hard to analyze due to the complexity of sensemaking and our lack of knowledge on the related user behaviors. This work presents a study on a comprehensive data collection of user behaviors, and our analysis approach with time-series classification methods. We have chosen a classical visualization application, Covid-19 data analysis, with common analysis tasks covering geo-spatial, time-series and multi-attributes. Our user study collects user behaviors on a diverse set of visualization tasks with two comparable systems, desktop and immersive visualizations. We summarize the classification results with three time-series machine learning algorithms at two scales, and explore the influences of behavior features. Our results reveal that user behaviors can be distinguished during the process of visual analytics and there is a potentially strong association between the physical behaviors of users and the visualization tasks they perform. We also demonstrate the usage of our models by interpreting open sessions of visual analytics, which provides an automatic way to study sensemaking without tedious manual annotations.
AI Key Findings
Get AI-generated insights about this paper's methodology, results, significance, and more — seven facets brought into focus.
Discussion 0