The LAVA Model: Learning Analytics Meets Visual Analytics
Publication
Metrics
AI Quick Summary
This paper proposes the LAVA model to integrate visual analytics with learning analytics, emphasizing human-centered design to enhance user involvement and acceptance. The model is applied in the Open Learning Analytics Platform to support indicator design, and its effectiveness is evaluated using the technology acceptance model.
Paper Preview
Abstract
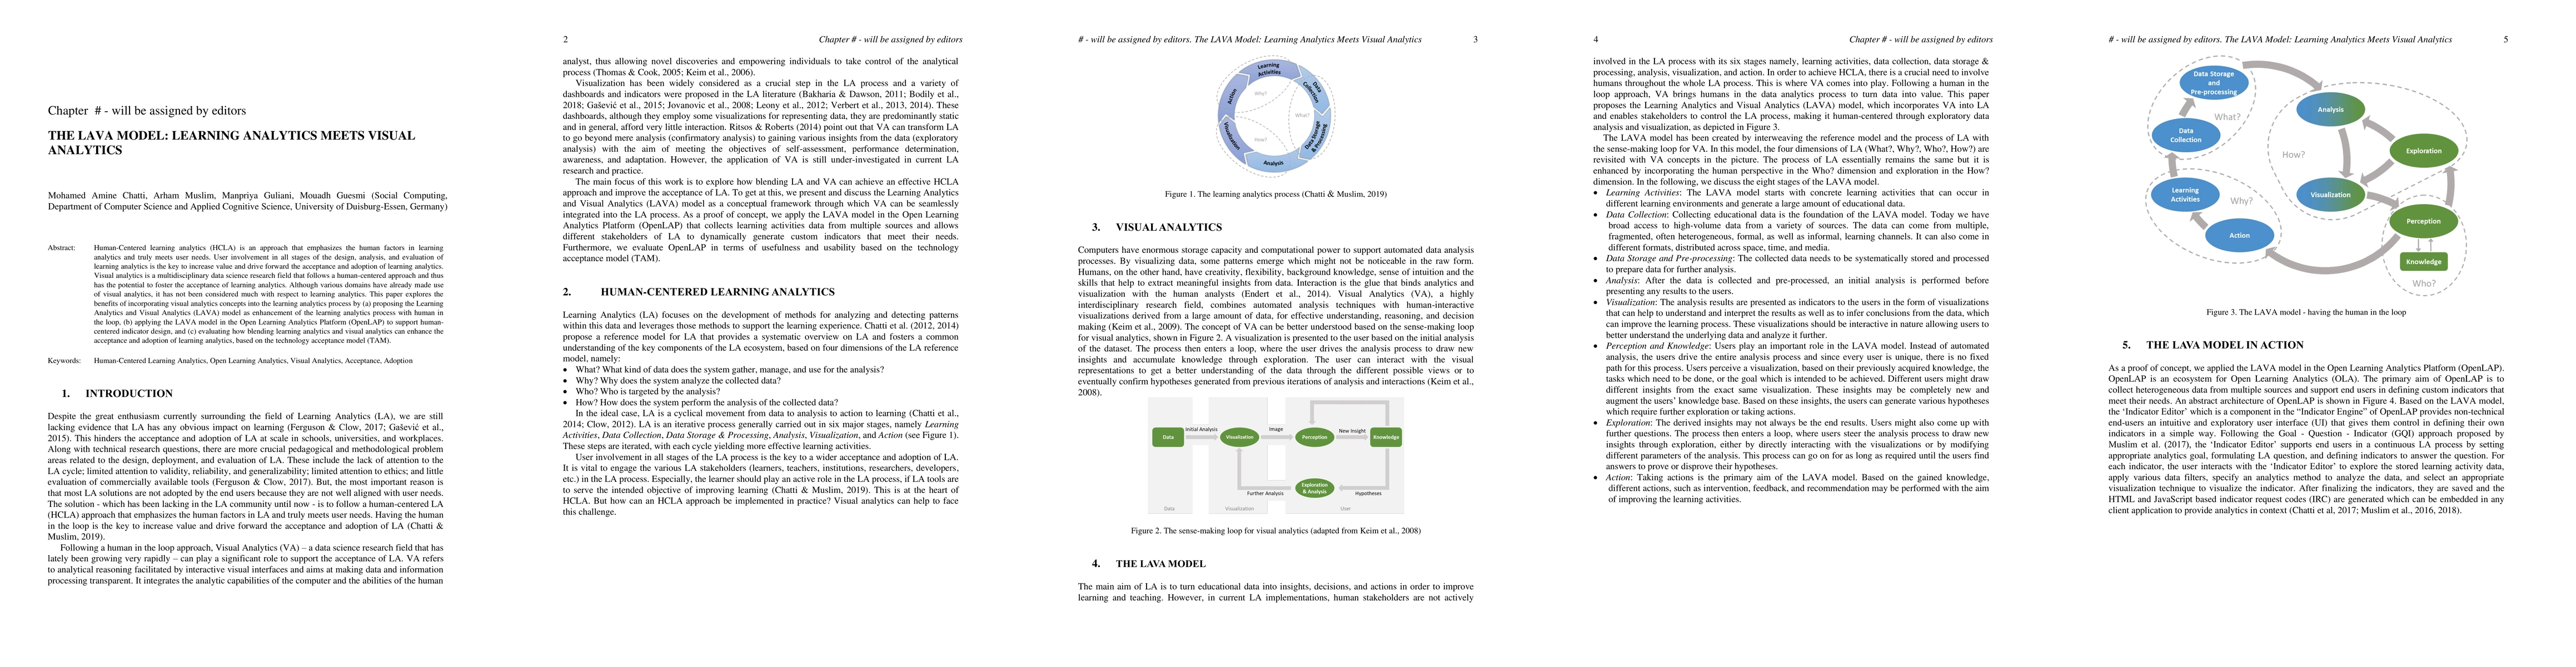
Human-Centered learning analytics (HCLA) is an approach that emphasizes the human factors in learning analytics and truly meets user needs. User involvement in all stages of the design, analysis, and evaluation of learning analytics is the key to increase value and drive forward the acceptance and adoption of learning analytics. Visual analytics is a multidisciplinary data science research field that follows a human-centered approach and thus has the potential to foster the acceptance of learning analytics. Although various domains have already made use of visual analytics, it has not been considered much with respect to learning analytics. This paper explores the benefits of incorporating visual analytics concepts into the learning analytics process by (a) proposing the Learning Analytics and Visual Analytics (LAVA) model as enhancement of the learning analytics process with human in the loop, (b) applying the LAVA model in the Open Learning Analytics Platform (OpenLAP) to support humancentered indicator design, and (c) evaluating how blending learning analytics and visual analytics can enhance the acceptance and adoption of learning analytics, based on the technology acceptance model (TAM).
AI Key Findings
Get AI-generated insights about this paper's methodology, results, significance, and more — seven facets brought into focus.
Impact
Paper Details
Authors
PDF Preview
Key Terms
Citation Network
Current paper (gray), citations (green), references (blue)
Display is limited for performance on very large graphs.
Discussion 0