Publication
Metrics
AI Quick Summary
This study crowdsources and analyzes 110 introductions of visualizations to identify effective strategies for explaining data visualizations. Experiments with 1,080 participants reveal that introductions using concrete examples are most effective, providing valuable insights for constructing clear verbal introductions in presentations.
Paper Preview
Abstract
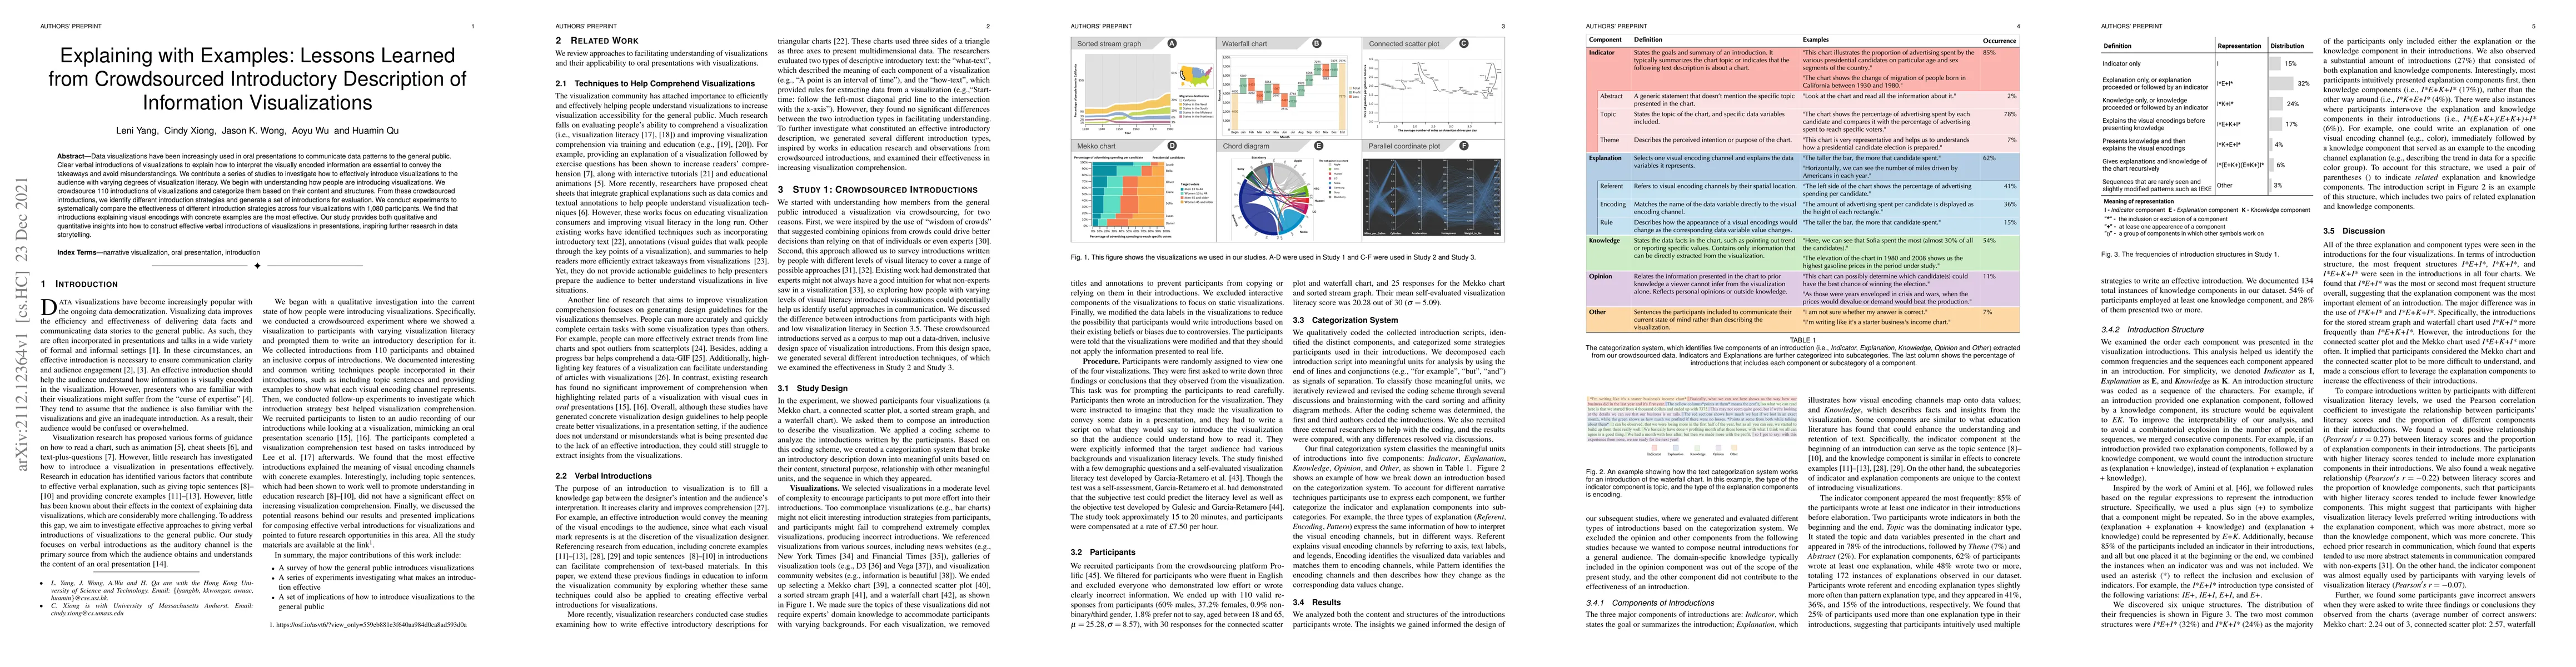
Data visualizations have been increasingly used in oral presentations to communicate data patterns to the general public. Clear verbal introductions of visualizations to explain how to interpret the visually encoded information are essential to convey the takeaways and avoid misunderstandings. We contribute a series of studies to investigate how to effectively introduce visualizations to the audience with varying degrees of visualization literacy. We begin with understanding how people are introducing visualizations. We crowdsource 110 introductions of visualizations and categorize them based on their content and structures. From these crowdsourced introductions, we identify different introduction strategies and generate a set of introductions for evaluation. We conduct experiments to systematically compare the effectiveness of different introduction strategies across four visualizations with 1,080 participants. We find that introductions explaining visual encodings with concrete examples are the most effective. Our study provides both qualitative and quantitative insights into how to construct effective verbal introductions of visualizations in presentations, inspiring further research in data storytelling.
AI Key Findings
Get AI-generated insights about this paper's methodology, results, significance, and more — seven facets brought into focus.
Impact
Paper Details
Authors
PDF Preview
Key Terms
Citation Network
Current paper (gray), citations (green), references (blue)
Display is limited for performance on very large graphs.
Discussion 0