AdaVis: Adaptive and Explainable Visualization Recommendation for Tabular Data
Publication
Metrics
AI Quick Summary
AdaVis proposes an adaptive and explainable approach for recommending one or multiple visualizations for tabular data, addressing the limitations of existing ML-based methods by modeling one-to-many mappings and providing fine-grained explainability through an attention mechanism. Extensive evaluations show its effectiveness in real applications.
Paper Preview
Abstract
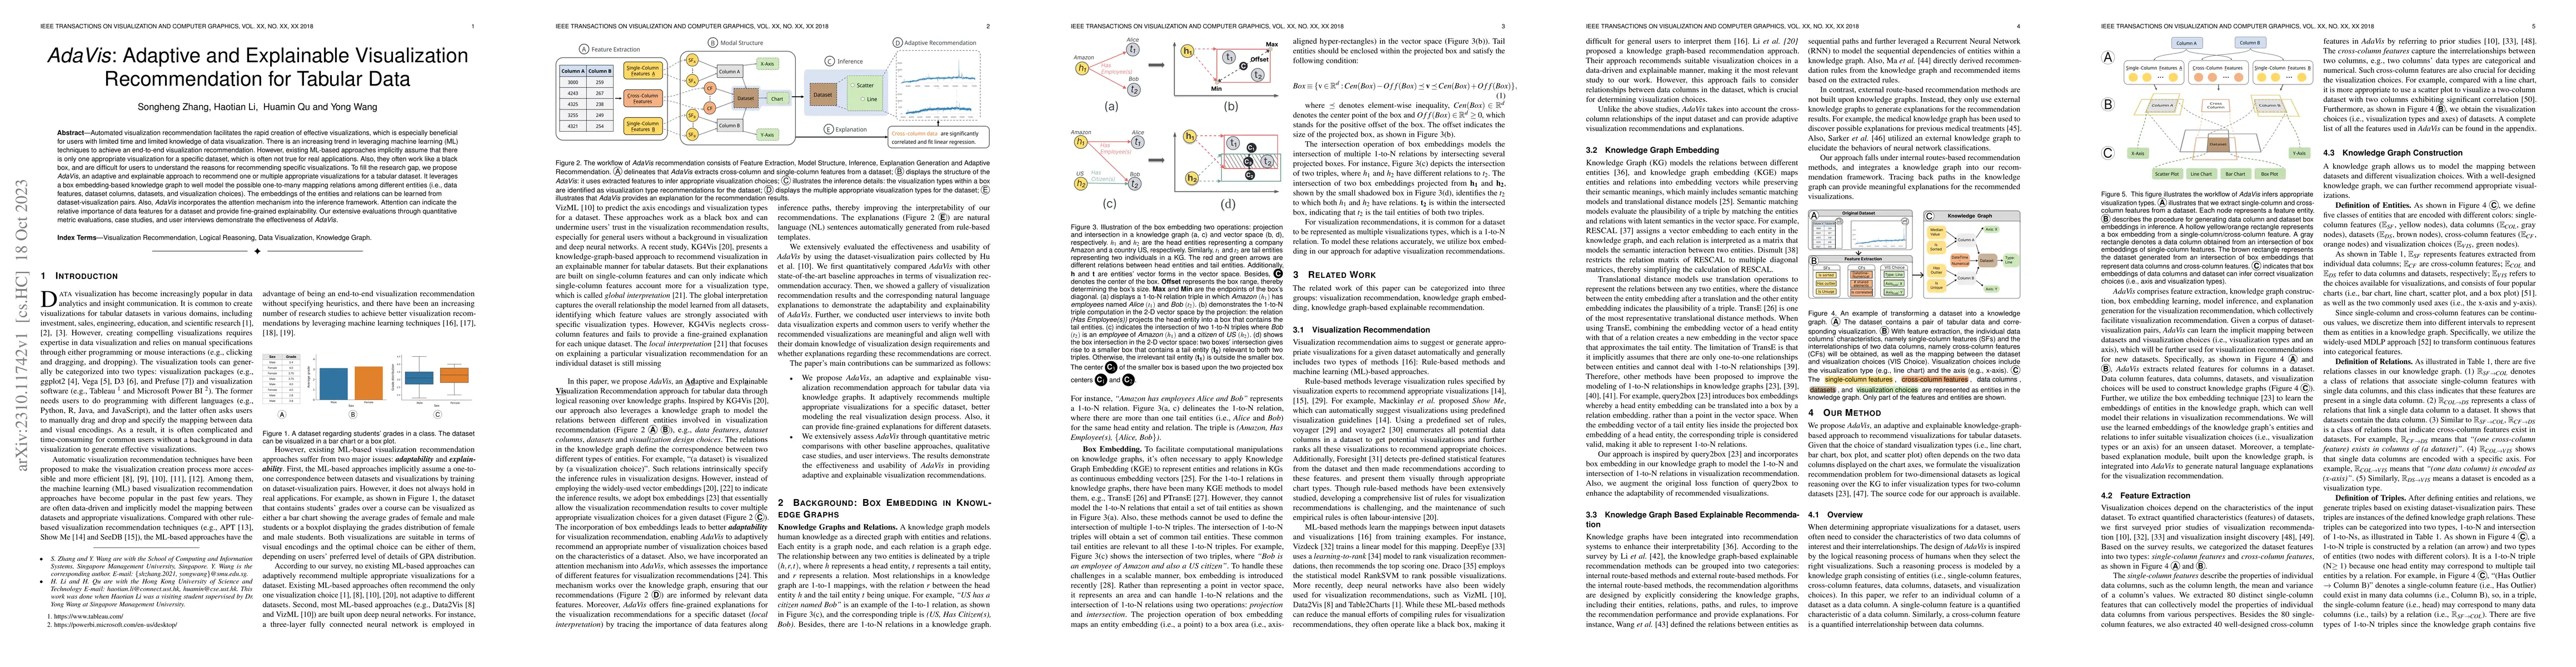
Automated visualization recommendation facilitates the rapid creation of effective visualizations, which is especially beneficial for users with limited time and limited knowledge of data visualization. There is an increasing trend in leveraging machine learning (ML) techniques to achieve an end-to-end visualization recommendation. However, existing ML-based approaches implicitly assume that there is only one appropriate visualization for a specific dataset, which is often not true for real applications. Also, they often work like a black box, and are difficult for users to understand the reasons for recommending specific visualizations. To fill the research gap, we propose AdaVis, an adaptive and explainable approach to recommend one or multiple appropriate visualizations for a tabular dataset. It leverages a box embedding-based knowledge graph to well model the possible one-to-many mapping relations among different entities (i.e., data features, dataset columns, datasets, and visualization choices). The embeddings of the entities and relations can be learned from dataset-visualization pairs. Also, AdaVis incorporates the attention mechanism into the inference framework. Attention can indicate the relative importance of data features for a dataset and provide fine-grained explainability. Our extensive evaluations through quantitative metric evaluations, case studies, and user interviews demonstrate the effectiveness of AdaVis.
AI Key Findings
Get AI-generated insights about this paper's methodology, results, significance, and more — seven facets brought into focus.
Paper Details
Authors
PDF Preview
Key Terms
Related Papers
No references found for this paper.
Discussion 0