HiTailor: Interactive Transformation and Visualization for Hierarchical Tabular Data
Publication
Metrics
AI Quick Summary
HiTailor introduces a technique for transforming and visualizing hierarchical tabular data, addressing the limitations of existing methods for flat tables. It employs an abstract model and transformation operators to enhance user exploration and visualization of complex hierarchical structures.
Paper Preview
Abstract
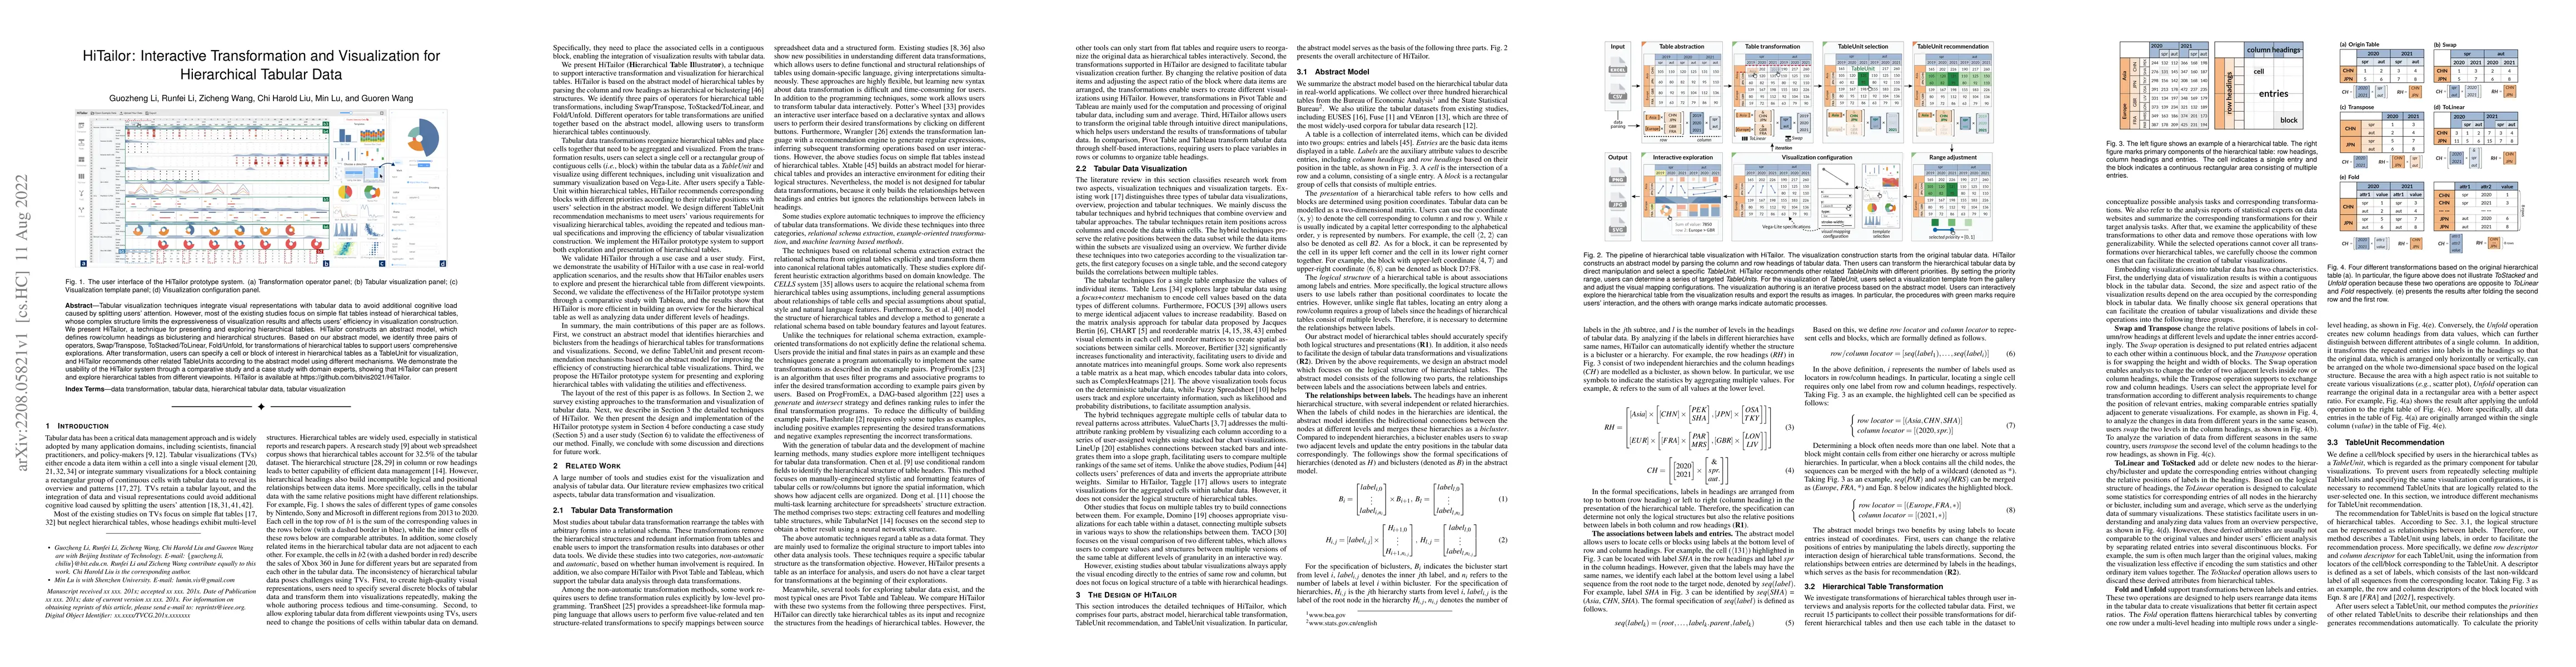
Tabular visualization techniques integrate visual representations with tabular data to avoid additional cognitive load caused by splitting users' attention. However, most of the existing studies focus on simple flat tables instead of hierarchical tables, whose complex structure limits the expressiveness of visualization results and affects users' efficiency in visualization construction. We present HiTailor, a technique for presenting and exploring hierarchical tables. HiTailor constructs an abstract model, which defines row/column headings as biclustering and hierarchical structures. Based on our abstract model, we identify three pairs of operators, Swap/Transpose, ToStacked/ToLinear, Fold/Unfold, for transformations of hierarchical tables to support users' comprehensive explorations. After transformation, users can specify a cell or block of interest in hierarchical tables as a TableUnit for visualization, and HiTailor recommends other related TableUnits according to the abstract model using different mechanisms. We demonstrate the usability of the HiTailor system through a comparative study and a case study with domain experts, showing that HiTailor can present and explore hierarchical tables from different viewpoints. HiTailor is available at https://github.com/bitvis2021/HiTailor.
AI Key Findings
Get AI-generated insights about this paper's methodology, results, significance, and more — seven facets brought into focus.
Impact
Paper Details
Authors
PDF Preview
Key Terms
Citation Network
Current paper (gray), citations (green), references (blue)
Display is limited for performance on very large graphs.
Discussion 0