This paper examines the landscape of misleading data visualizations, identifying 74 types of issues through an analysis of over a thousand reported cases. It proposes four research directions to address misleading visualizations, laying the groundwork for future studies on detection and prevention.
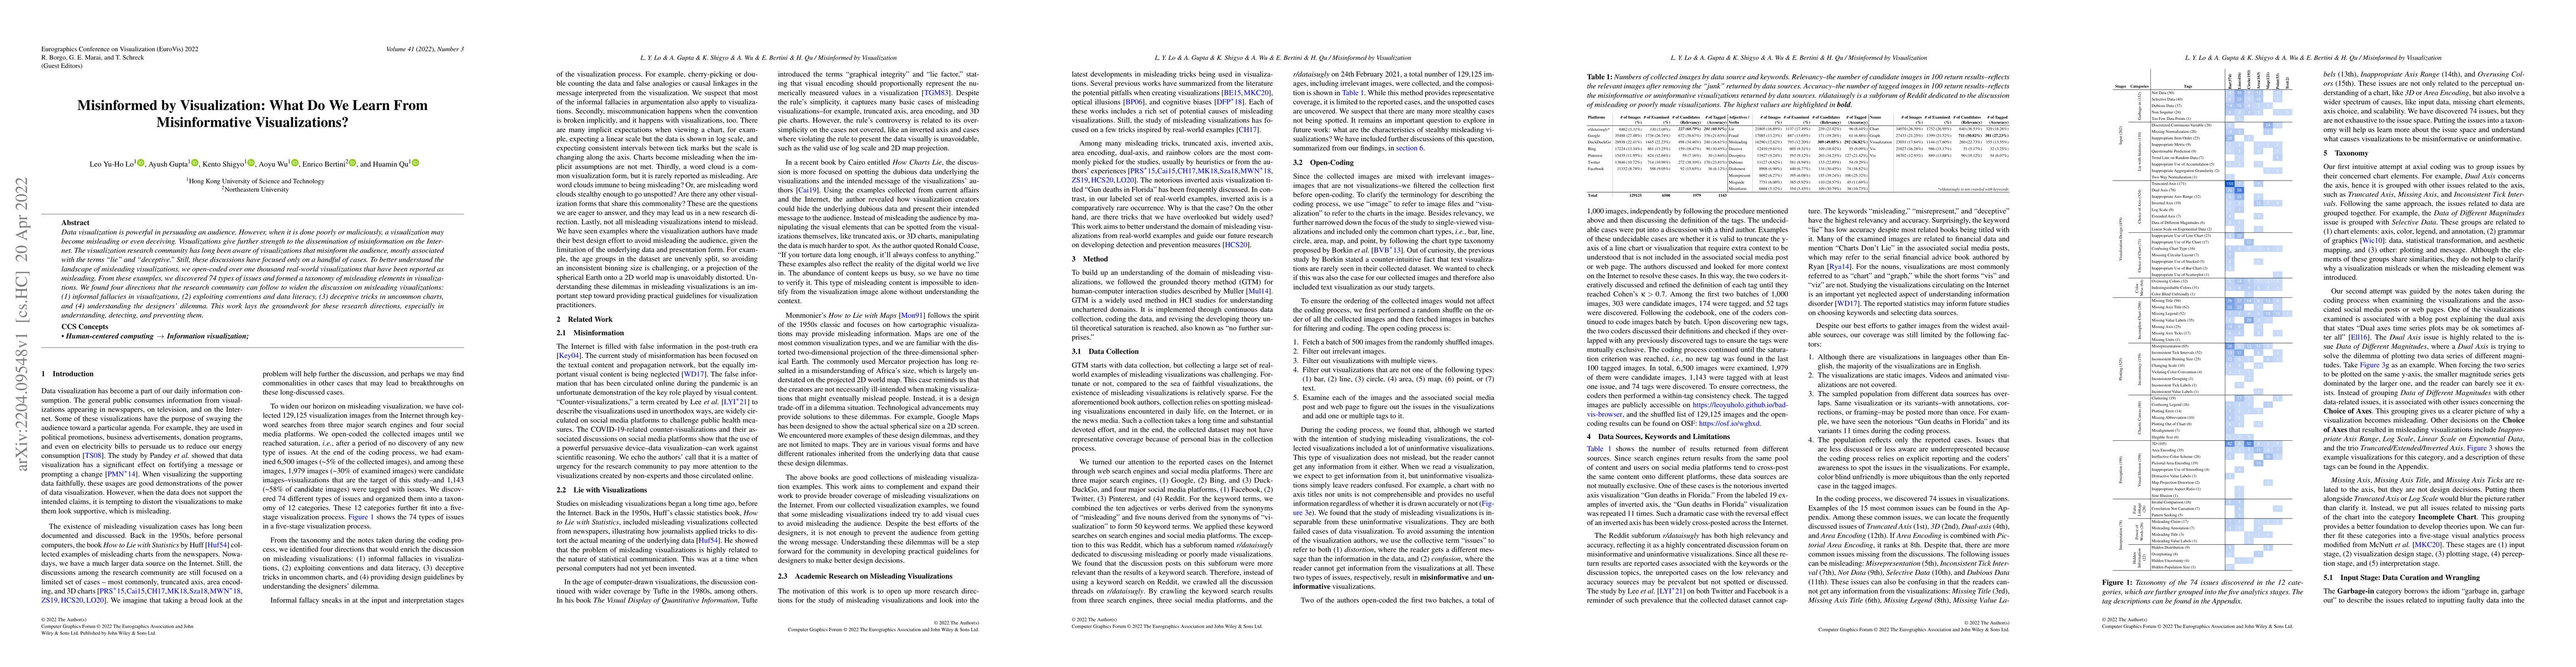
Data visualization is powerful in persuading an audience. However, when it is done poorly or maliciously, a visualization may become misleading or even deceiving. Visualizations give further strength to the dissemination of misinformation on the Internet. The visualization research community has long been aware of visualizations that misinform the audience, mostly associated with the terms "lie" and "deceptive." Still, these discussions have focused only on a handful of cases. To better understand the landscape of misleading visualizations, we open-coded over one thousand real-world visualizations that have been reported as misleading. From these examples, we discovered 74 types of issues and formed a taxonomy of misleading elements in visualizations. We found four directions that the research community can follow to widen the discussion on misleading visualizations: (1) informal fallacies in visualizations, (2) exploiting conventions and data literacy, (3) deceptive tricks in uncommon charts, and (4) understanding the designers' dilemma. This work lays the groundwork for these research directions, especially in understanding, detecting, and preventing them.
This graph shows how this paper is connected to other research. The current paper is shown in dark gray, papers that cite it are in green, and papers it references are in blue. You can:
• Hover over any node to see the paper title
• Click a node to view that paper's details
• Drag nodes to rearrange the graph
• Use the zoom controls (bottom right) to zoom in/out
Title | Authors | Year | Actions |
---|---|---|---|
Benchmarking Visual Language Models on Standardized Visualization Literacy Tests
|
Saugat Pandey, Alvitta Ottley
|
2025
|
View Paper |
Integration of Virtual Simulation of Traditional Kekehan Games on The Material of Moment of Inertia and Angular Momentum
|
Adrian Bagas Damarsha, Oka Saputra, Nadi Suprapto, E. Hariyono, Khoirun Nisa’
|
2025
|
View Paper |
Protecting multimodal large language models against misleading visualizations
|
Jonathan Tonglet, T. Tuytelaars, M. Moens, Iryna Gurevych
|
2025
|
View Paper |
Towards softerware: Enabling personalization of interactive data representations for users with disabilities
|
Frank Elavsky, Marita Vindedal, Ted Gies, Patrick Carrington, Dominik Moritz, Øystein Moseng
|
2025
|
View Paper |
Exploring Educational Approaches to Addressing Misleading Visualizations
|
Jihyun Rho, Martina A. Rau
|
2025
|
View Paper |
Visual media literacy: educational strategies to combat image and video disinformation on social media
|
Abd Allah Sultan Aljalabneh
|
2024
|
View Paper |
Natural Language Generation for Visualizations: State of the Art, Challenges and Future Directions
|
Enamul Hoque, Mohammed Saidul Islam
|
2024
|
View Paper |
CHARTOM: A Visual Theory-of-Mind Benchmark for Multimodal Large Language Models
|
S. Bharti, Shiyun Cheng, Jihyun Rho, Martina Rao, Xiaojin Zhu
|
2024
|
View Paper |
Can GPT-4 Models Detect Misleading Visualizations?
|
Jason Alexander, Priyal Nanda, Kai-Cheng Yang, Ali Sarvghad
|
2024
|
View Paper |
Visual Framing During Crisis: A 10-year Systematic Review
|
Grace Omondi
|
2024
|
View Paper |
How Good (Or Bad) Are LLMs at Detecting Misleading Visualizations?
|
Leo Yu-Ho Lo, Huamin Qu
|
2024
|
View Paper |
How the manner in which data is visualized affects and corrects (mis)perceptions of political polarization
|
JonRobert Tartaglione, Lee de-Wit
|
2024
|
View Paper |
“I Came Across a Junk”: Understanding Design Flaws of Data Visualization from the Public's Perspective
|
Xingyu Lan, Yu Liu
|
2024
|
View Paper |
VisEval: A Benchmark for Data Visualization in the Era of Large Language Models
|
Nan Chen, Yuge Zhang, Jiahang Xu, Kan Ren, Yuqing Yang
|
2024
|
View Paper |
Visual narratives to edutain against misleading visualizations in healthcare
|
Anna Shilo, R. Raidou
|
2024
|
View Paper |
"Yeah, this graph doesn't show that": Analysis of Online Engagement with Misleading Data Visualizations
|
Maxim Lisnic, Alexander Lex, Marina Kogan
|
2024
|
View Paper |
V-FRAMER: Visualization Framework for Mitigating Reasoning Errors in Public Policy
|
Lily W. Ge, Matthew Easterday, Matthew Kay, Evanthia Dimara, P. Cheng, Steven Franconeri
|
2024
|
View Paper |
Struggles and Strategies in Understanding Information Visualizations
|
Maryam Rezaie, M. Tory, Sheelagh Carpendale
|
2024
|
View Paper |
ChartCheck: Explainable Fact-Checking over Real-World Chart Images
|
Mubashara Akhtar, Nikesh Subedi, Vivek Gupta, Sahar Tahmasebi, O. Cocarascu, E. Simperl
|
2023
|
View Paper |
Design Actions for the Design of Visualization Onboarding Methods
|
Christina Stoiber, M. Pohl, Wolfgang Aigner
|
2023
|
View Paper |
Uncertainty Unveiled: Revealing the Uncertainty of Distribution Visualization Through Cross Reality
|
Alexander Gall, Anja Heim, B. Fröhler, Christoph Heinzl
|
2023
|
View Paper |
Bridging the Divide: Unraveling the Knowledge Gap in Data Visualization Research and Practice
|
Nam Wook Kim, Grace Myers, Jinhan Choi, Yoonsuh Cho, Changhoon Oh, Yea-Seul Kim
|
2023
|
View Paper |
Visualization Literacy
|
Margit Pohl
|
2023
|
View Paper |
Why Change My Design: Explaining Poorly Constructed Visualization Designs with Explorable Explanations
|
Leo Yu-Ho Lo, Yifang Cao, Leni Yang, Huamin Qu
|
2023
|
View Paper |
Belief Decay or Persistence? A Mixed‐method Study on Belief Movement Over Time
|
Shrey Gupta, Alireza Karduni, Emily Wall
|
2023
|
View Paper |
Multimodal Automated Fact-Checking: A Survey
|
Mubashara Akhtar, M. Schlichtkrull, Zhijiang Guo, O. Cocarascu, E. Simperl, Andreas Vlachos
|
2023
|
View Paper |
Misleading Beyond Visual Tricks: How People Actually Lie with Charts
|
Maxim Lisnic, Cole Polychronis, A. Lex, M. Kogan
|
2023
|
View Paper |
CALVI: Critical Thinking Assessment for Literacy in Visualizations
|
Lily W. Ge, Yuanling Cui, Matthew Kay
|
2023
|
View Paper |
EduVis: Workshop on Visualization Education, Literacy, and Activities
|
Mandy Keck, Samuel Huron, Georgia Panagiotidou, Christina Stoiber, Fateme Rajabiyazdi, Charles Perin, J. C. Roberts, B. Bach
|
2023
|
View Paper |
Reading and Reasoning over Chart Images for Evidence-based Automated Fact-Checking
|
Mubashara Akhtar, O. Cocarascu, E. Simperl
|
2023
|
View Paper |
Trust Calibration as a Function of the Evolution of Uncertainty in Knowledge Generation: A Survey
|
J. Boley, Maoyuan Sun
|
2022
|
View Paper |
DashBot: Insight-Driven Dashboard Generation Based on Deep Reinforcement Learning
|
Dazhen Deng, Aoyu Wu, Huamin Qu, Yingcai Wu
|
2022
|
View Paper |
Visual Exploration of Machine Learning Model Behavior With Hierarchical Surrogate Rule Sets
|
Jun Yuan, Brian Barr, Kyle Overton, E. Bertini
|
2022
|
View Paper |
Show Me the GIFference! Using data-GIFs as Educational Tools
|
Lorenzo Amabili, TU Wien, M. Gröller, R. Raidou
|
2024
|
View Paper |
ChartCheck: An Evidence-Based Fact-Checking Dataset over Real-World Chart Images
|
Mubashara Akhtar, Nikesh Subedi, Vivek Gupta, Sahar Tahmasebi, O. Cocarascu, E. Simperl
|
2023
|
View Paper |
Misinformative Data Visualizations in the Sports Media Domain
|
Drew Scott
|
View Paper | |
Visualization Guardrails: Designing Interventions Against Cherry-Picking in Interactive Data Explorers
|
Maxim Lisnic, Zach Cutler, Marina Kogan, Alexander Lex
|
View Paper | |
Various Misleading Visual Features in Misleading Graphs: Do they truly deceive us?
|
Jihyun Rho, S. Bharti, Rosanne Luu, Jeremy McMahan, Andrew Wang
|
View Paper |
Published: 2021-02-16
Andrew Cohen, Cindy Xiong Bearfield, Carolina Nobre, Huichen Will Wang, Kylie Lin, Ryan Kennedy, Zach Zwald
Published: 2025-03-22
Published: 2020-09-28
Comments (0)