Academic Profile
Statistics
Similar Authors
Papers on arXiv
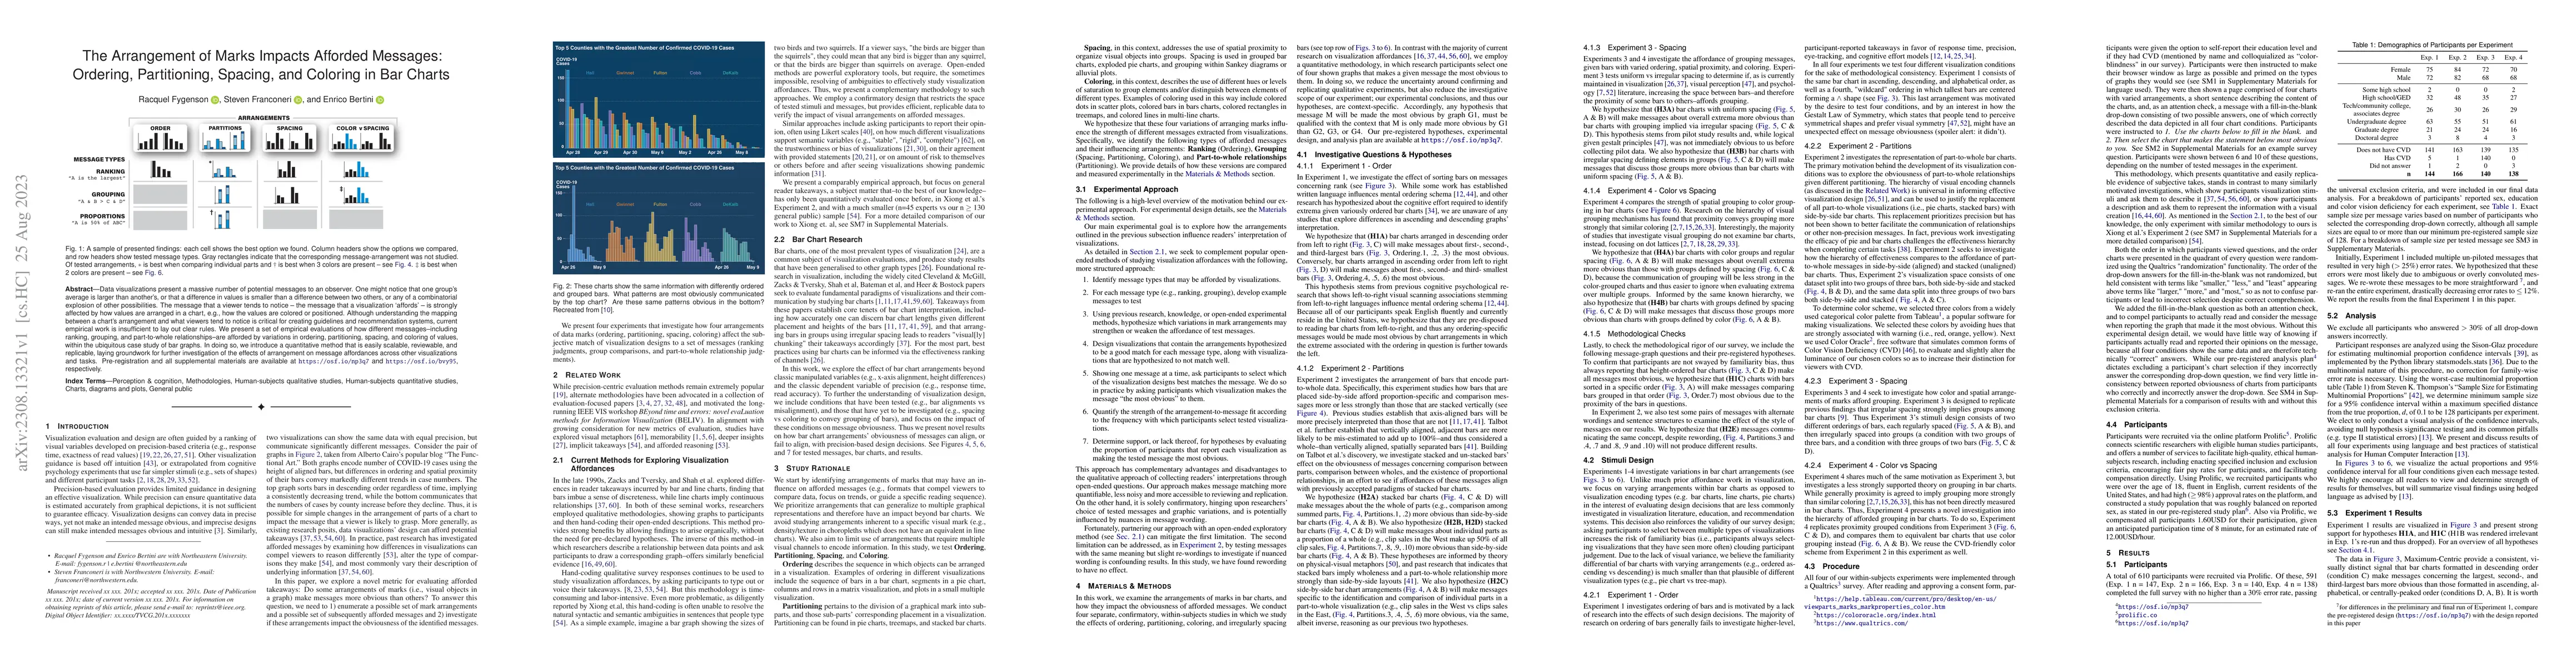
Data visualizations present a massive number of potential messages to an observer. One might notice that one group's average is larger than another's, or that a difference in values is smaller than ...
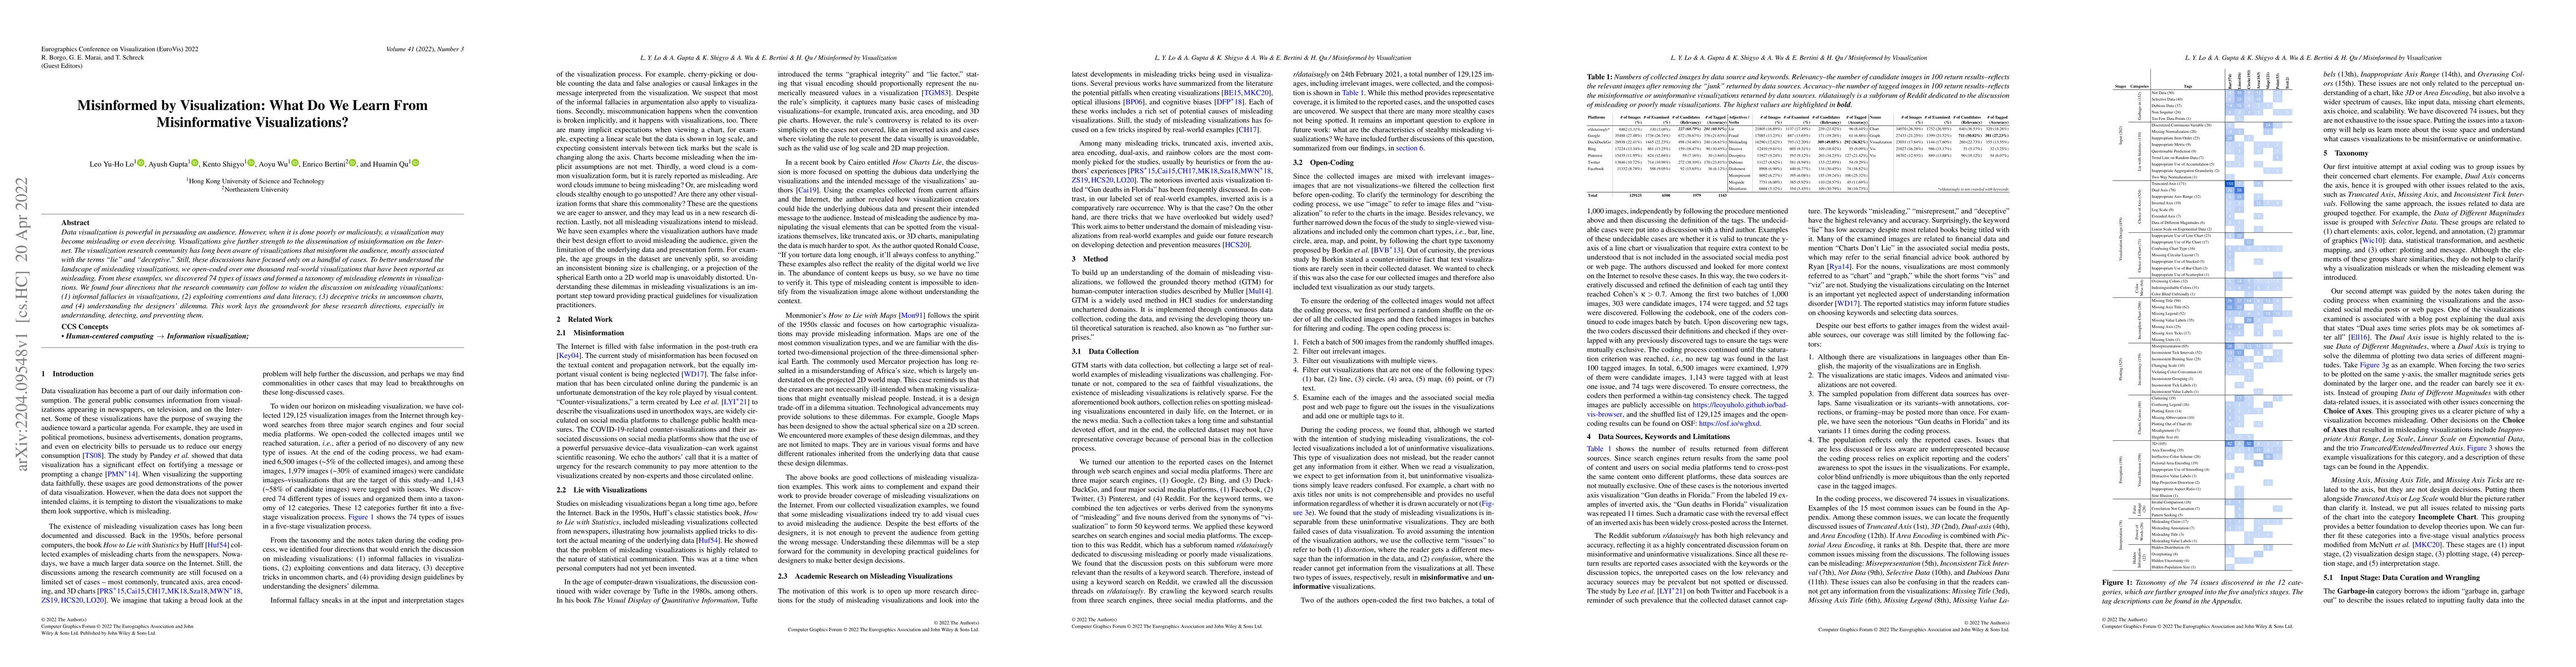
Data visualization is powerful in persuading an audience. However, when it is done poorly or maliciously, a visualization may become misleading or even deceiving. Visualizations give further strengt...
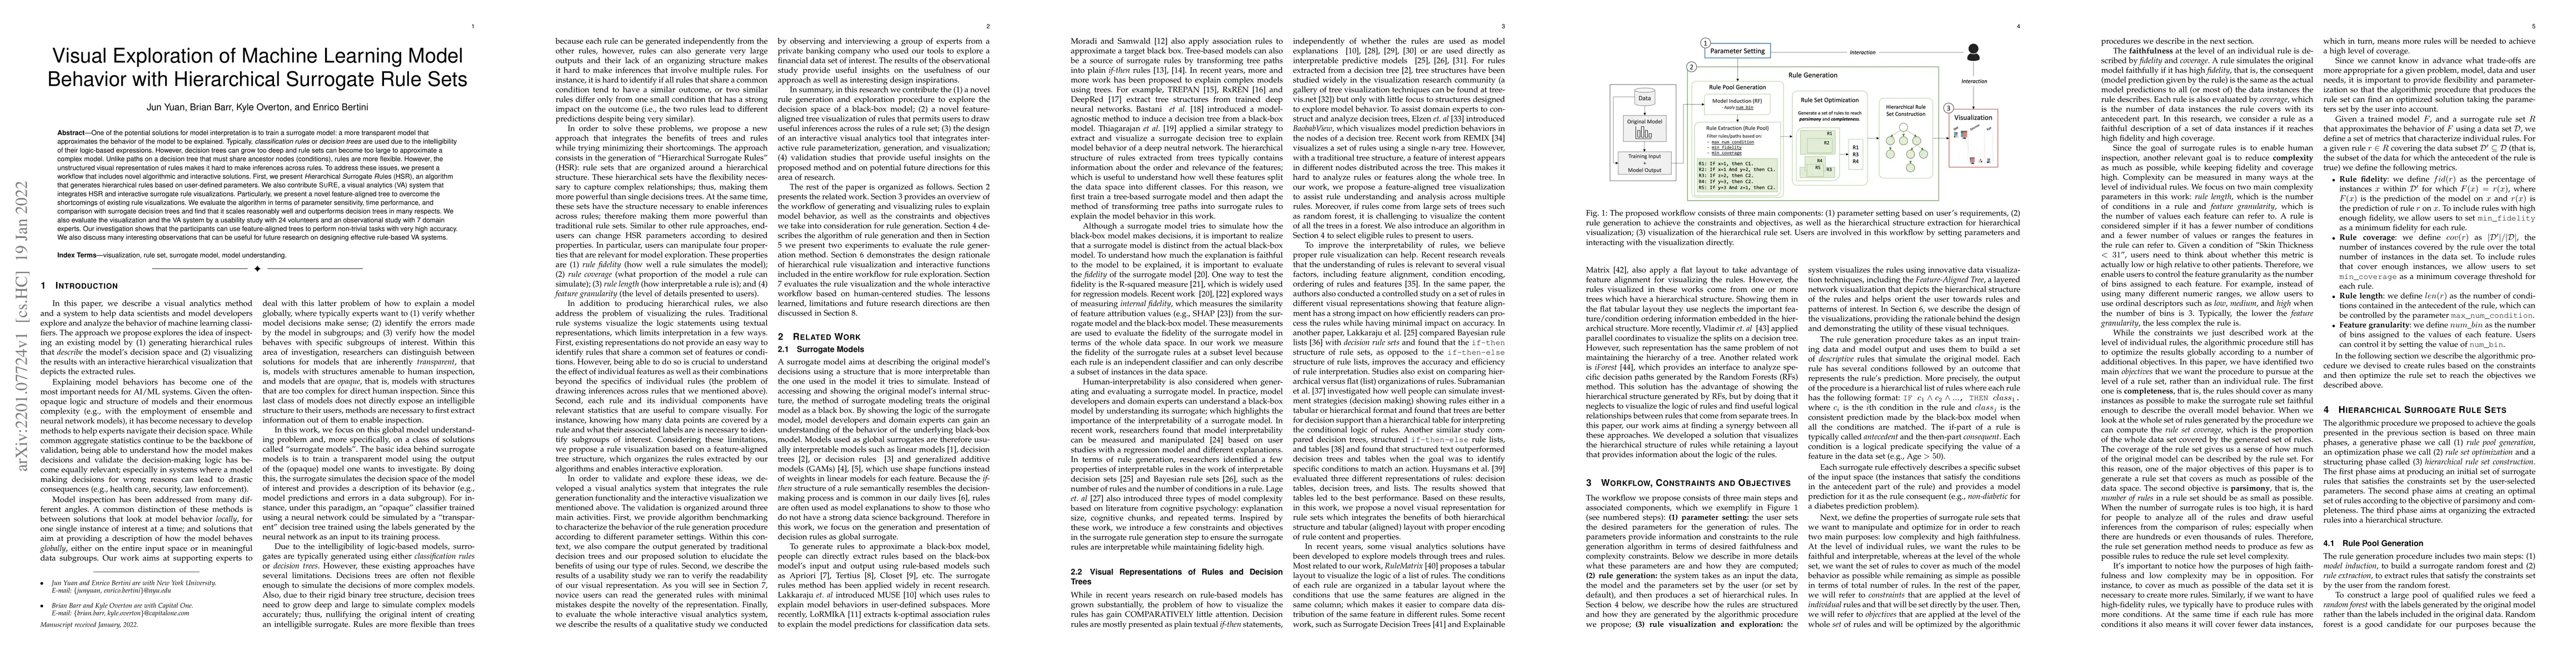
One of the potential solutions for model interpretation is to train a surrogate model: a more transparent model that approximates the behavior of the model to be explained. Typically, classification...
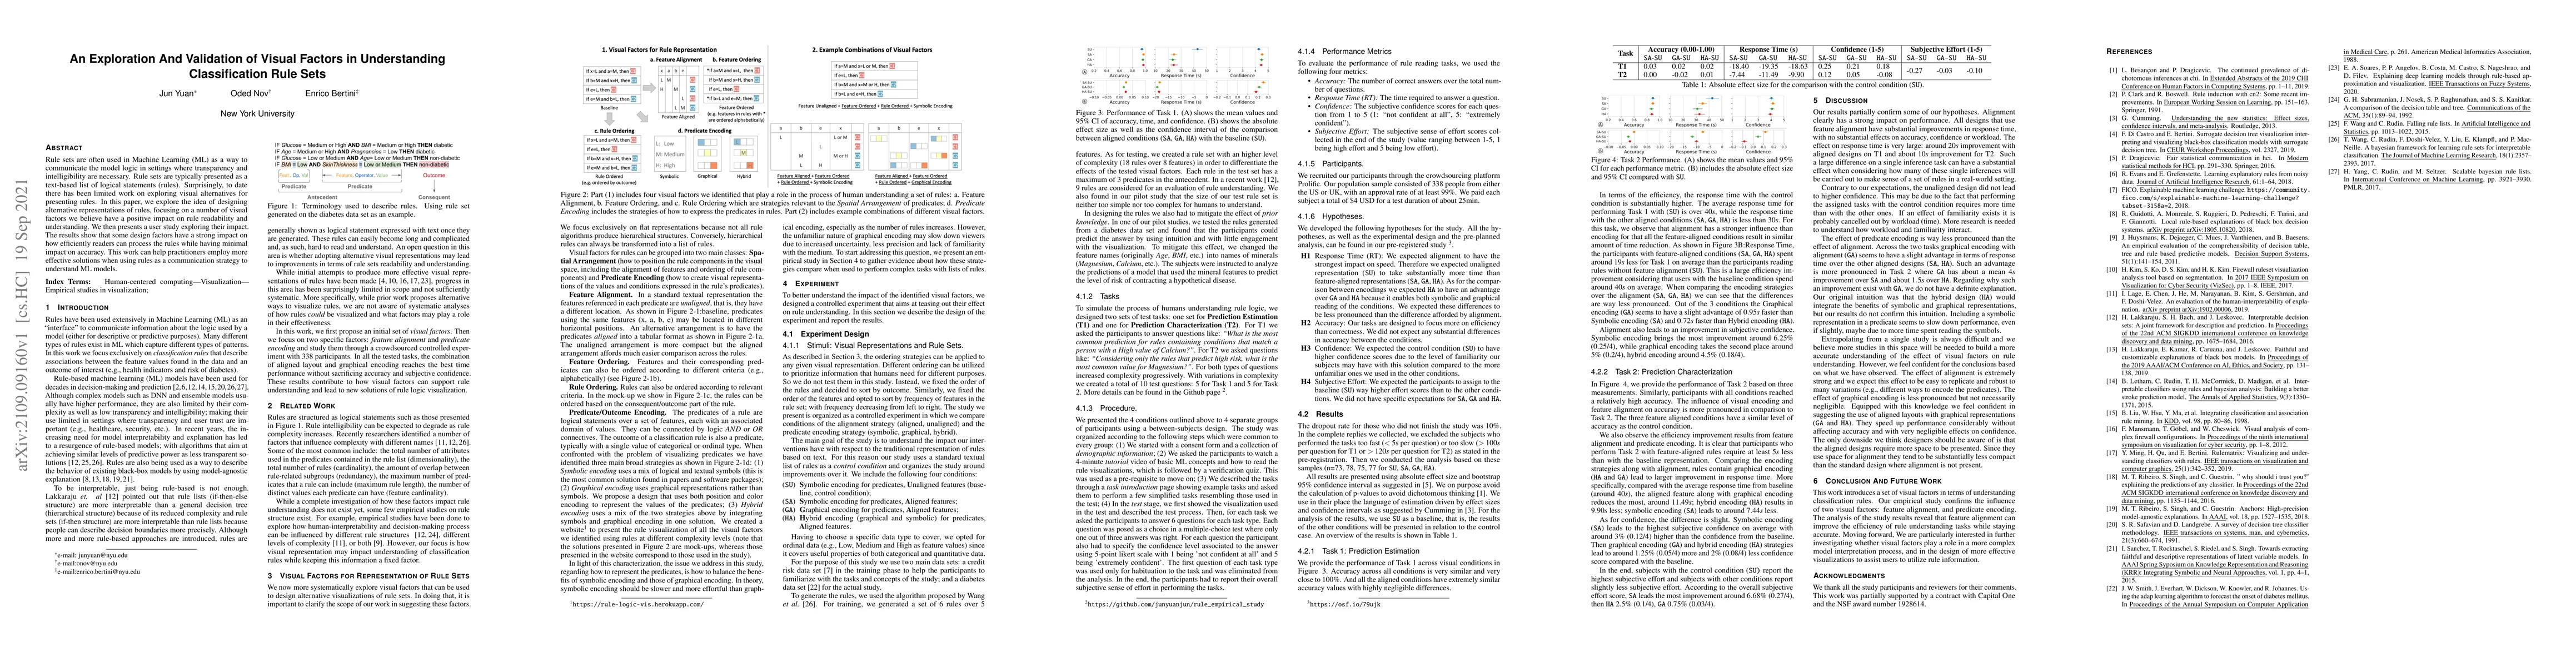
Rule sets are often used in Machine Learning (ML) as a way to communicate the model logic in settings where transparency and intelligibility are necessary. Rule sets are typically presented as a tex...
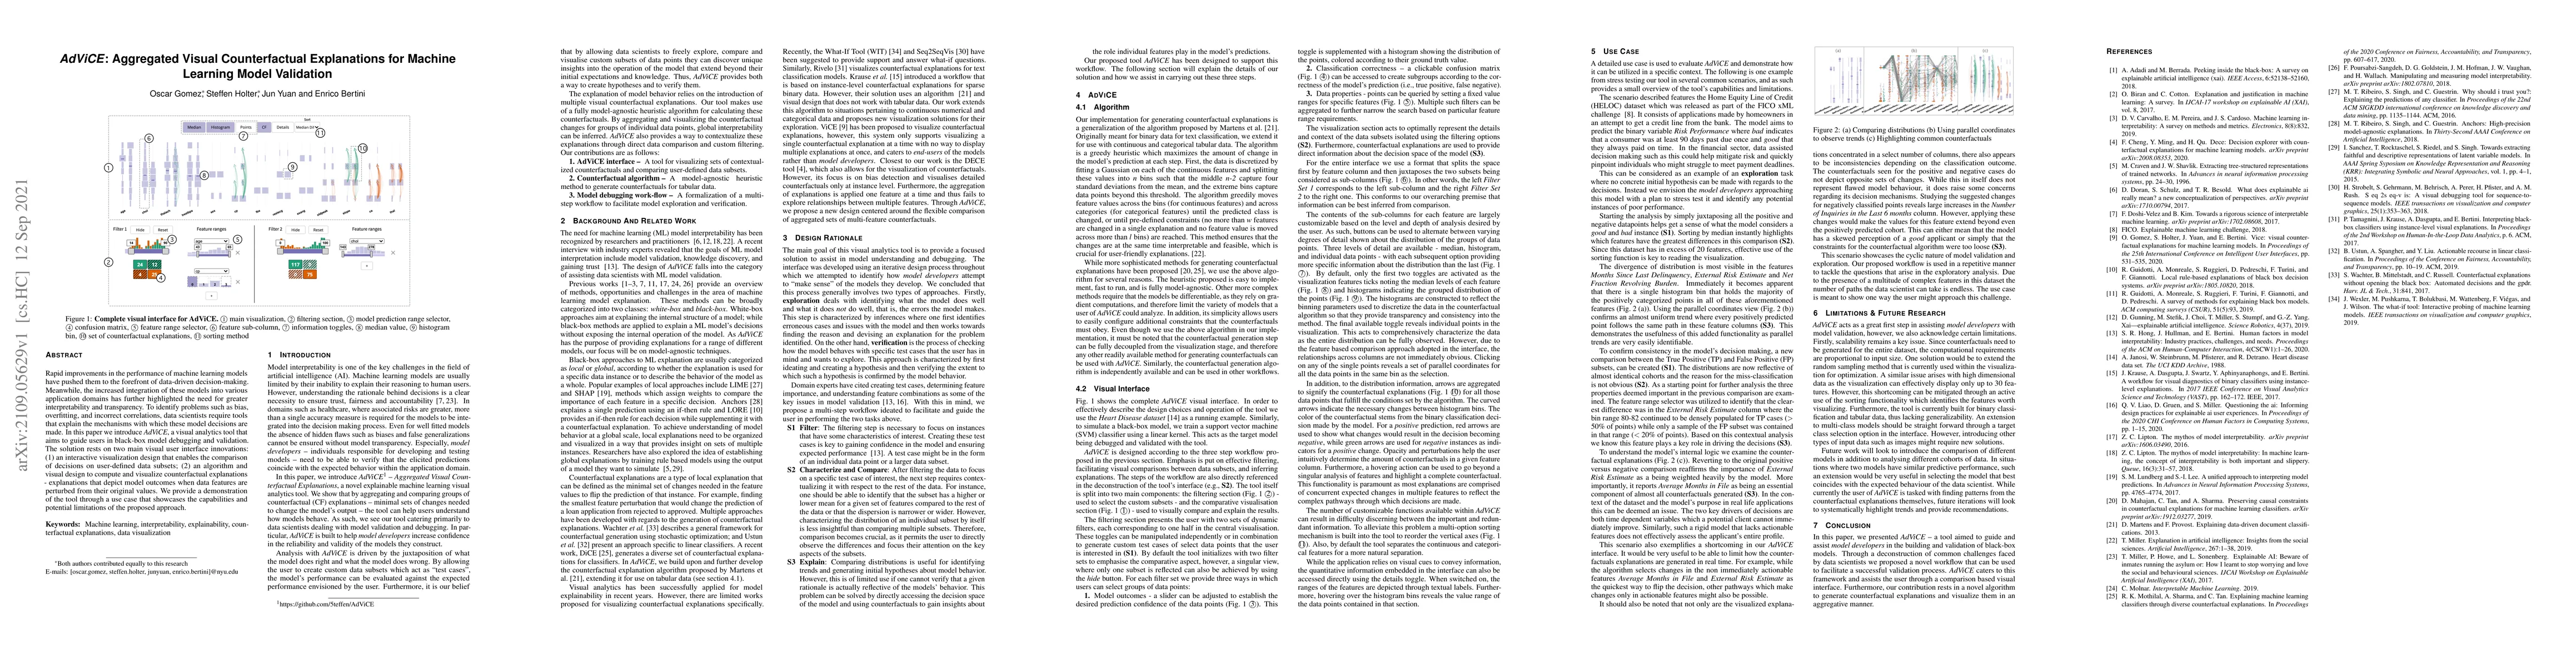
Rapid improvements in the performance of machine learning models have pushed them to the forefront of data-driven decision-making. Meanwhile, the increased integration of these models into various a...
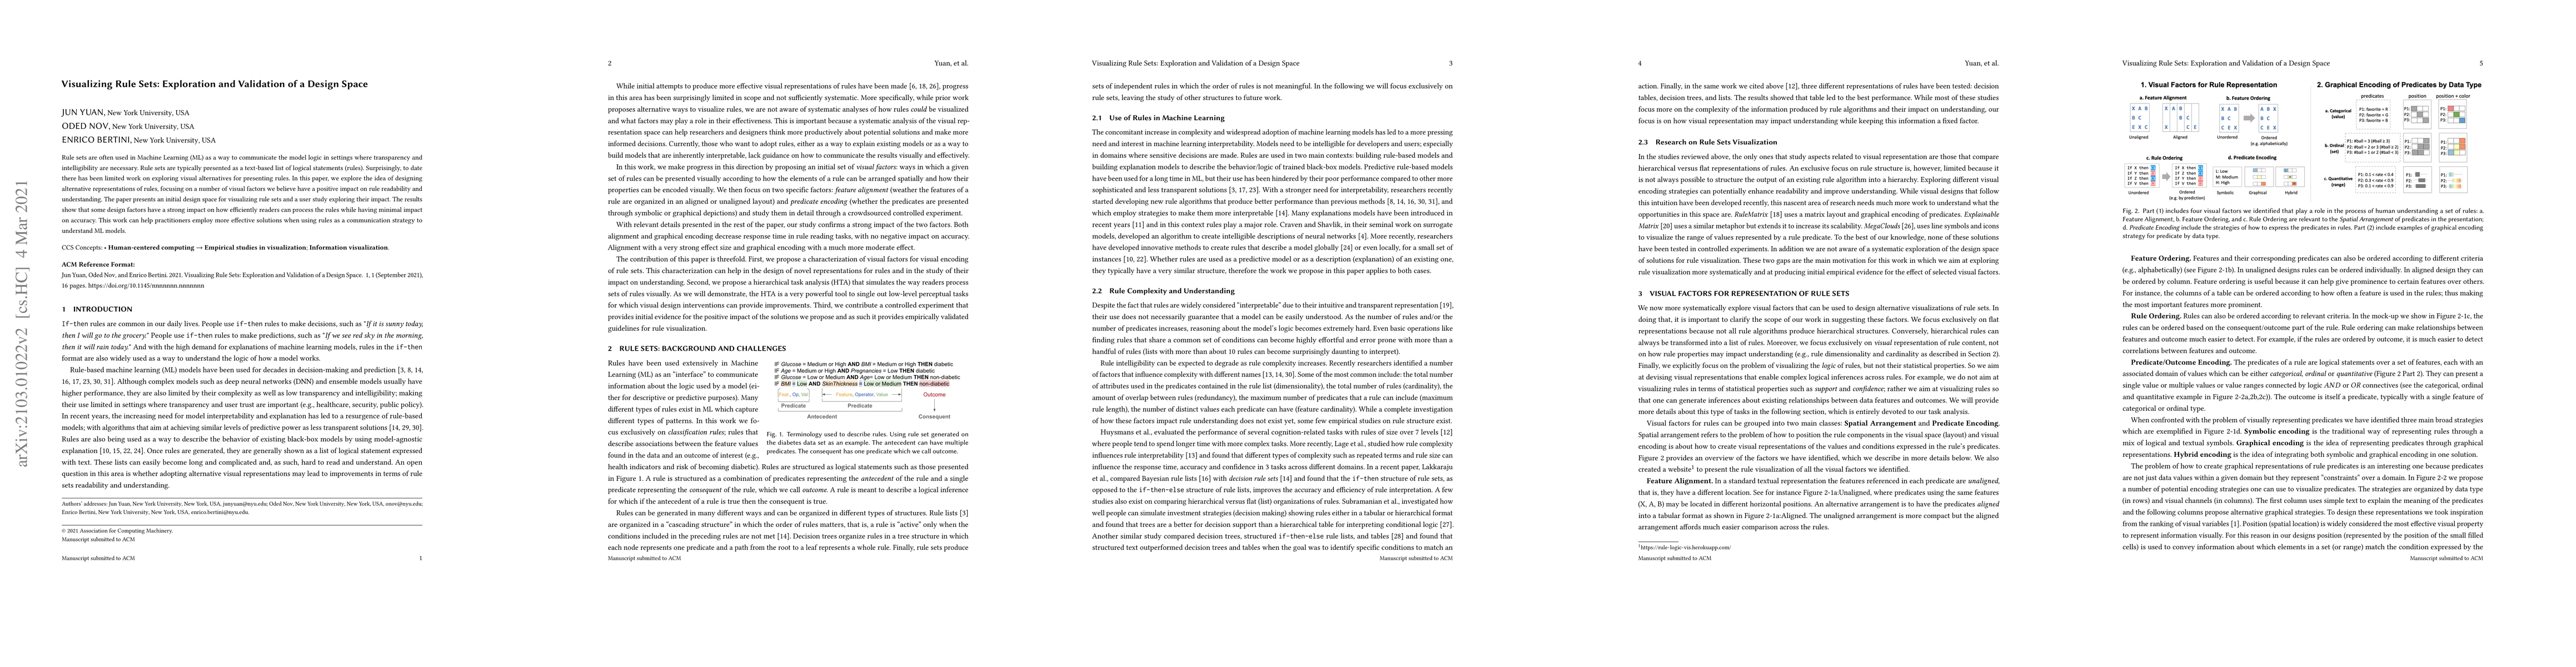
Rule sets are often used in Machine Learning (ML) as a way to communicate the model logic in settings where transparency and intelligibility are necessary. Rule sets are typically presented as a tex...
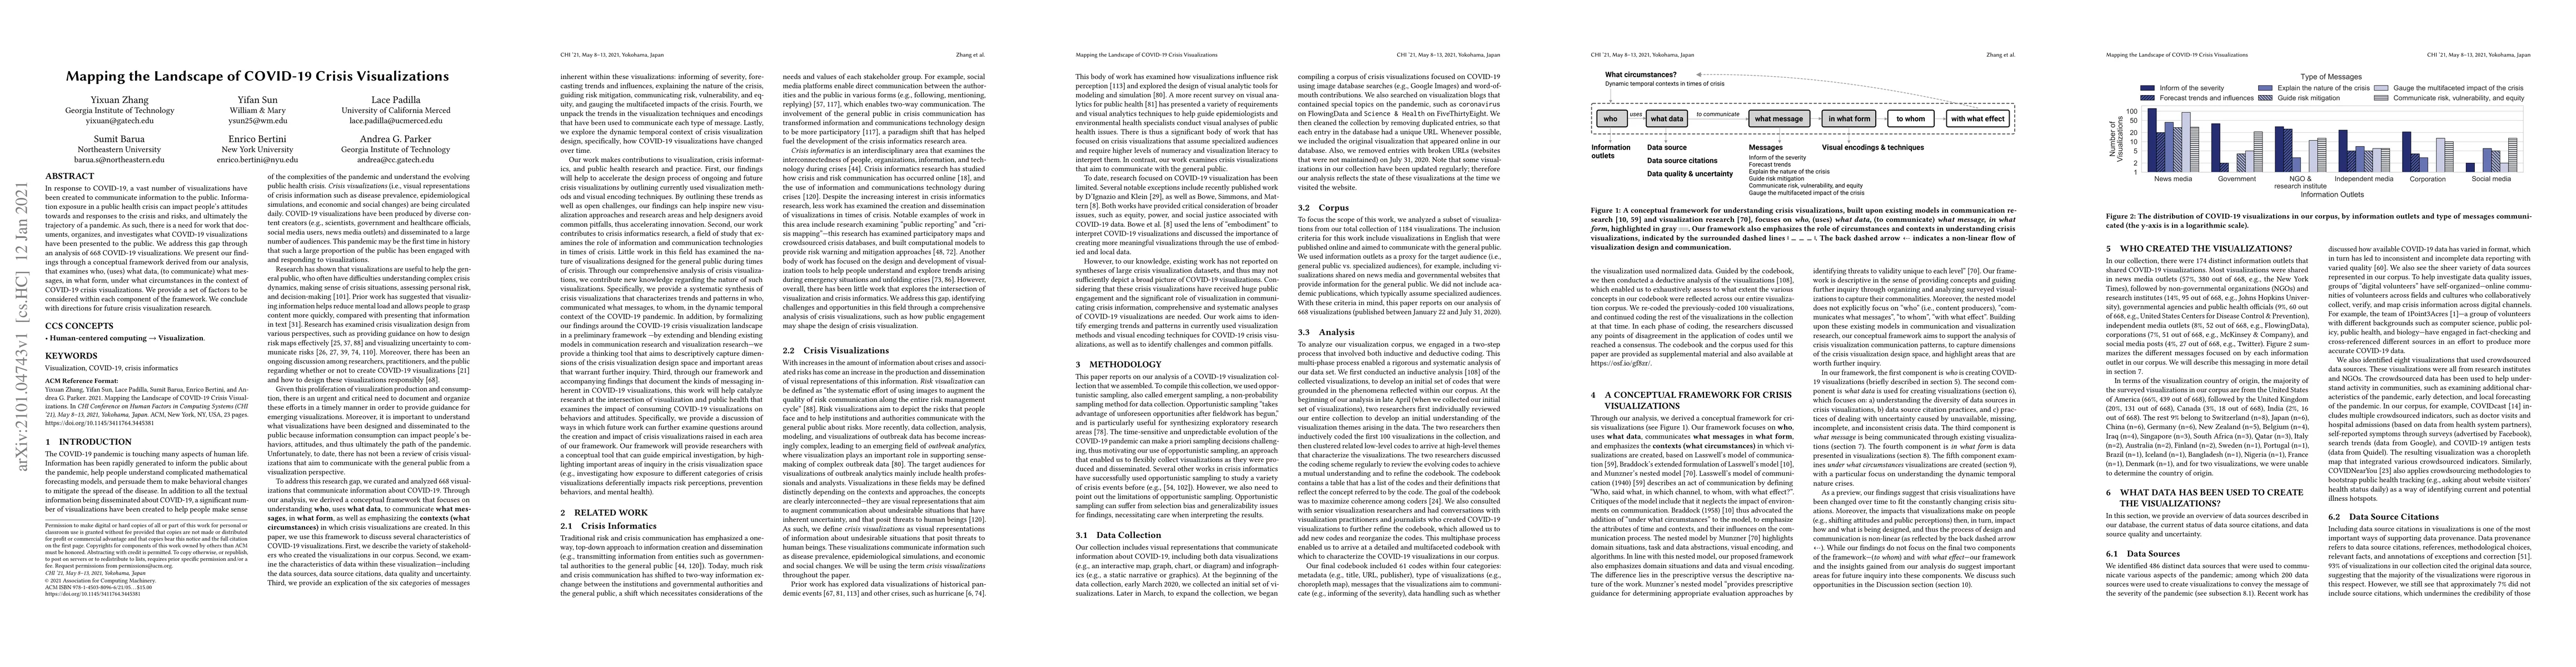
In response to COVID-19, a vast number of visualizations have been created to communicate information to the public. Information exposure in a public health crisis can impact people's attitudes towa...
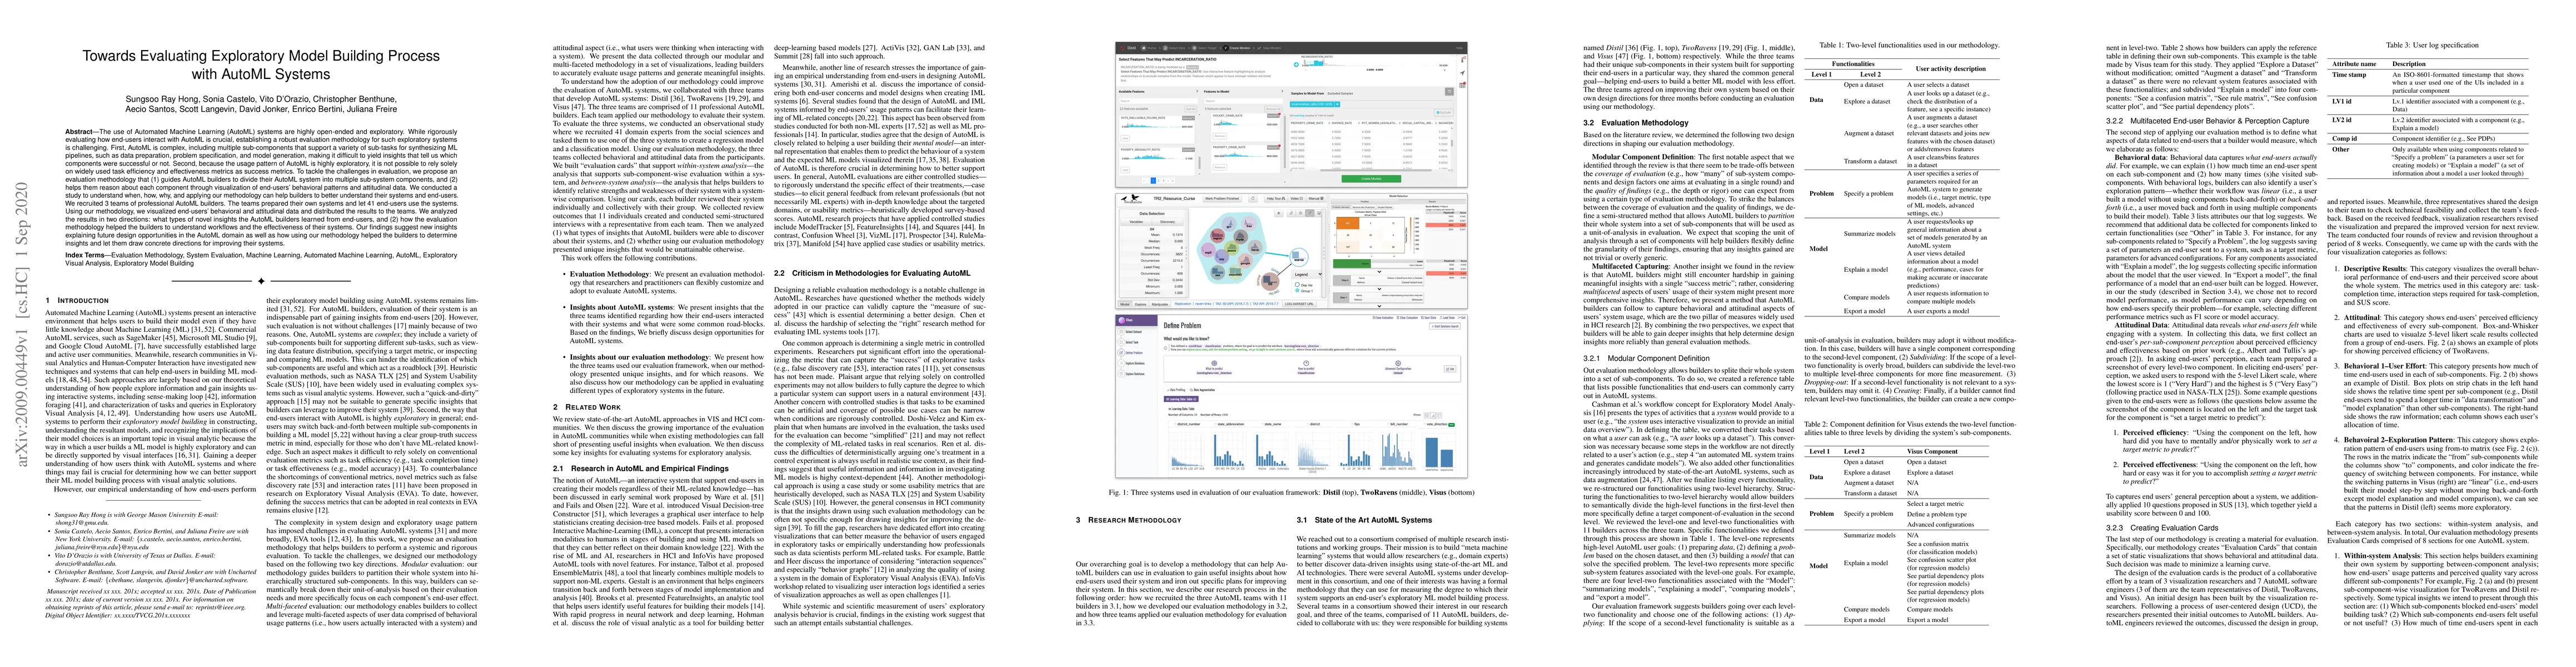
The use of Automated Machine Learning (AutoML) systems are highly open-ended and exploratory. While rigorously evaluating how end-users interact with AutoML is crucial, establishing a robust evaluat...
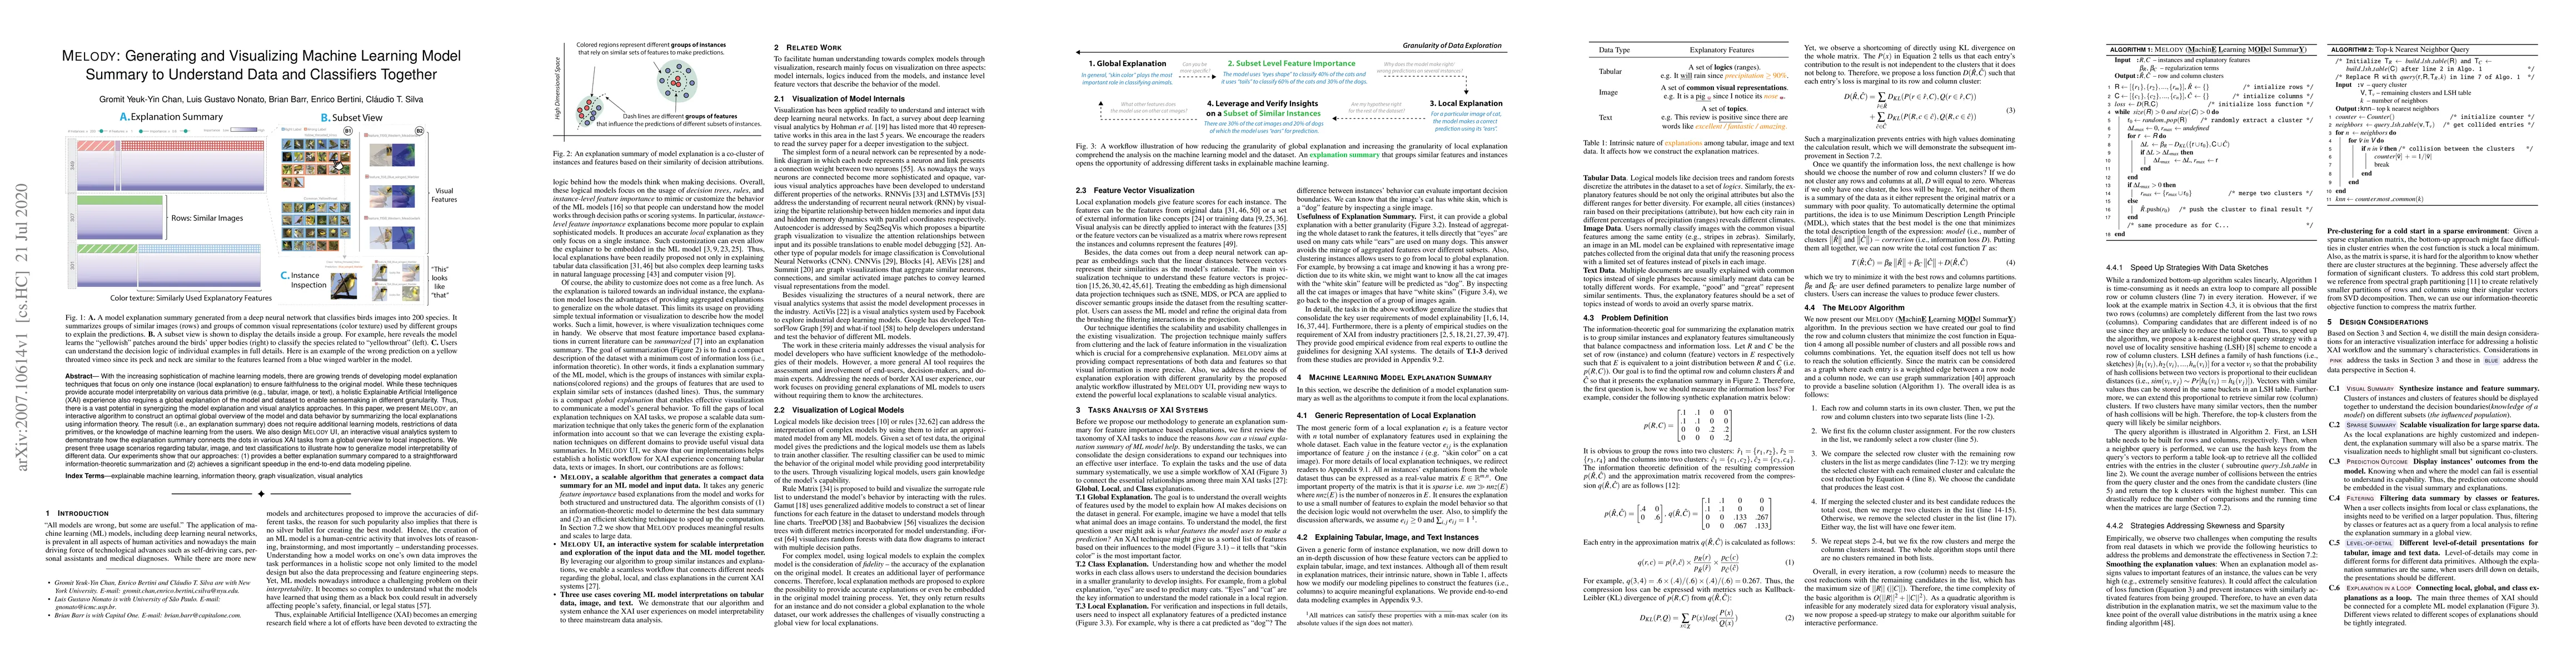
With the increasing sophistication of machine learning models, there are growing trends of developing model explanation techniques that focus on only one instance (local explanation) to ensure faith...
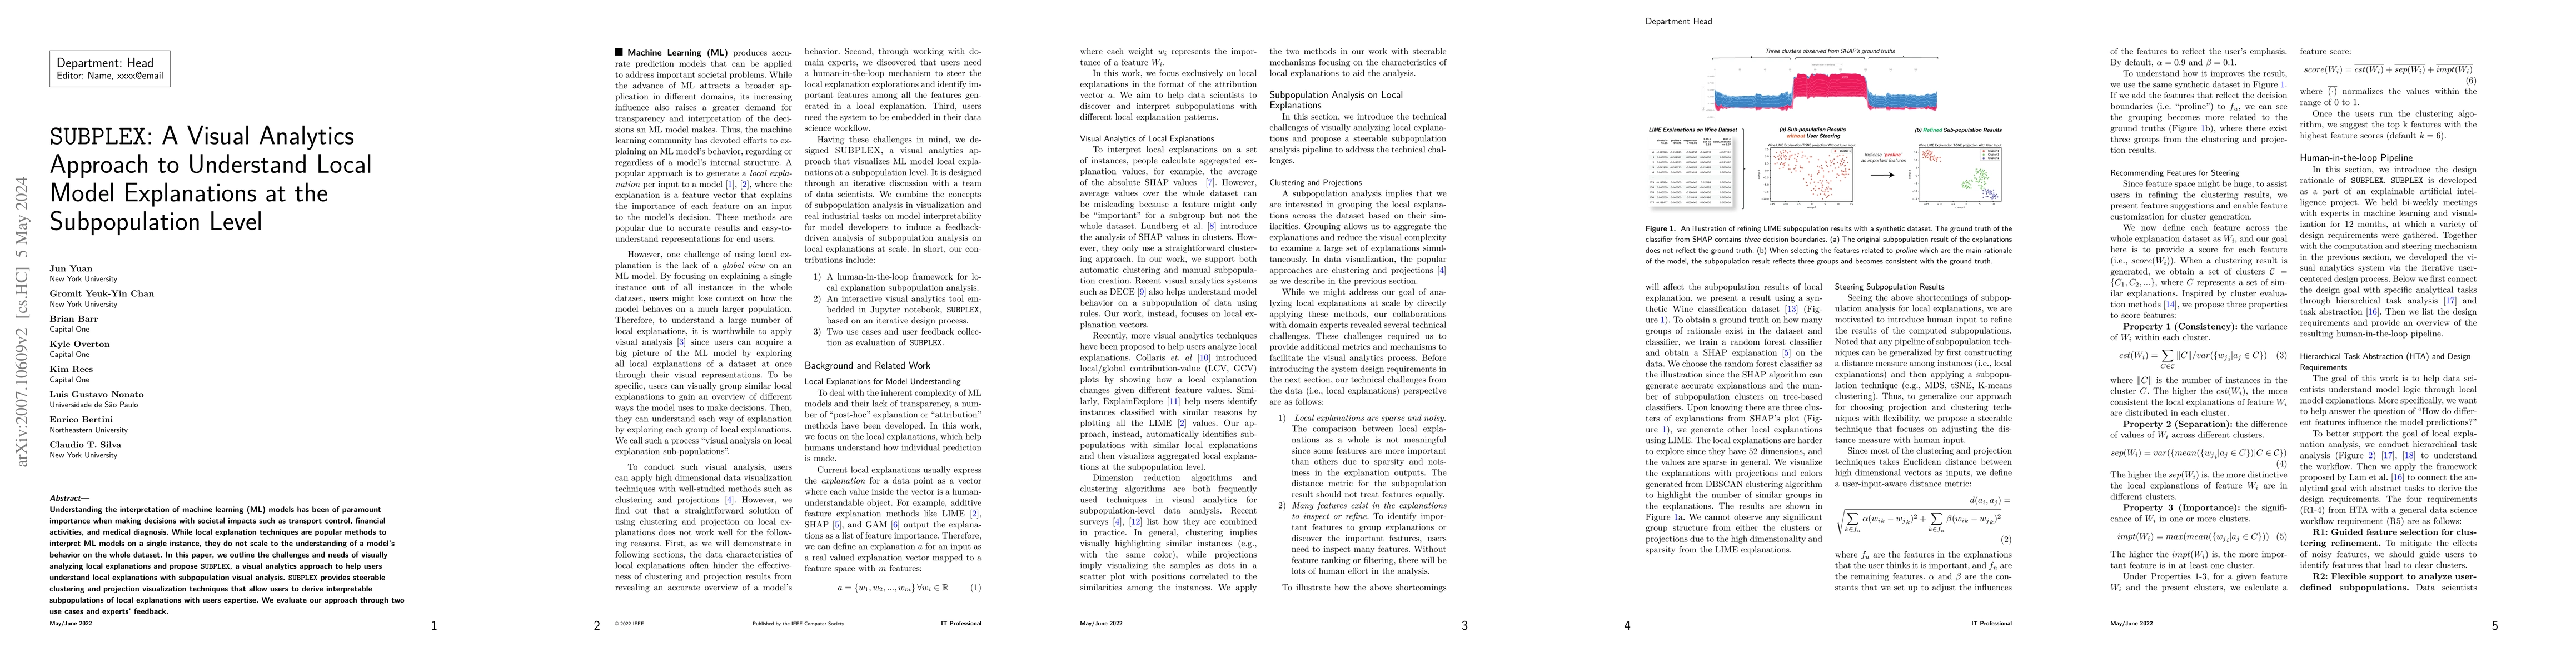
Understanding the interpretation of machine learning (ML) models has been of paramount importance when making decisions with societal impacts such as transport control, financial activities, and med...
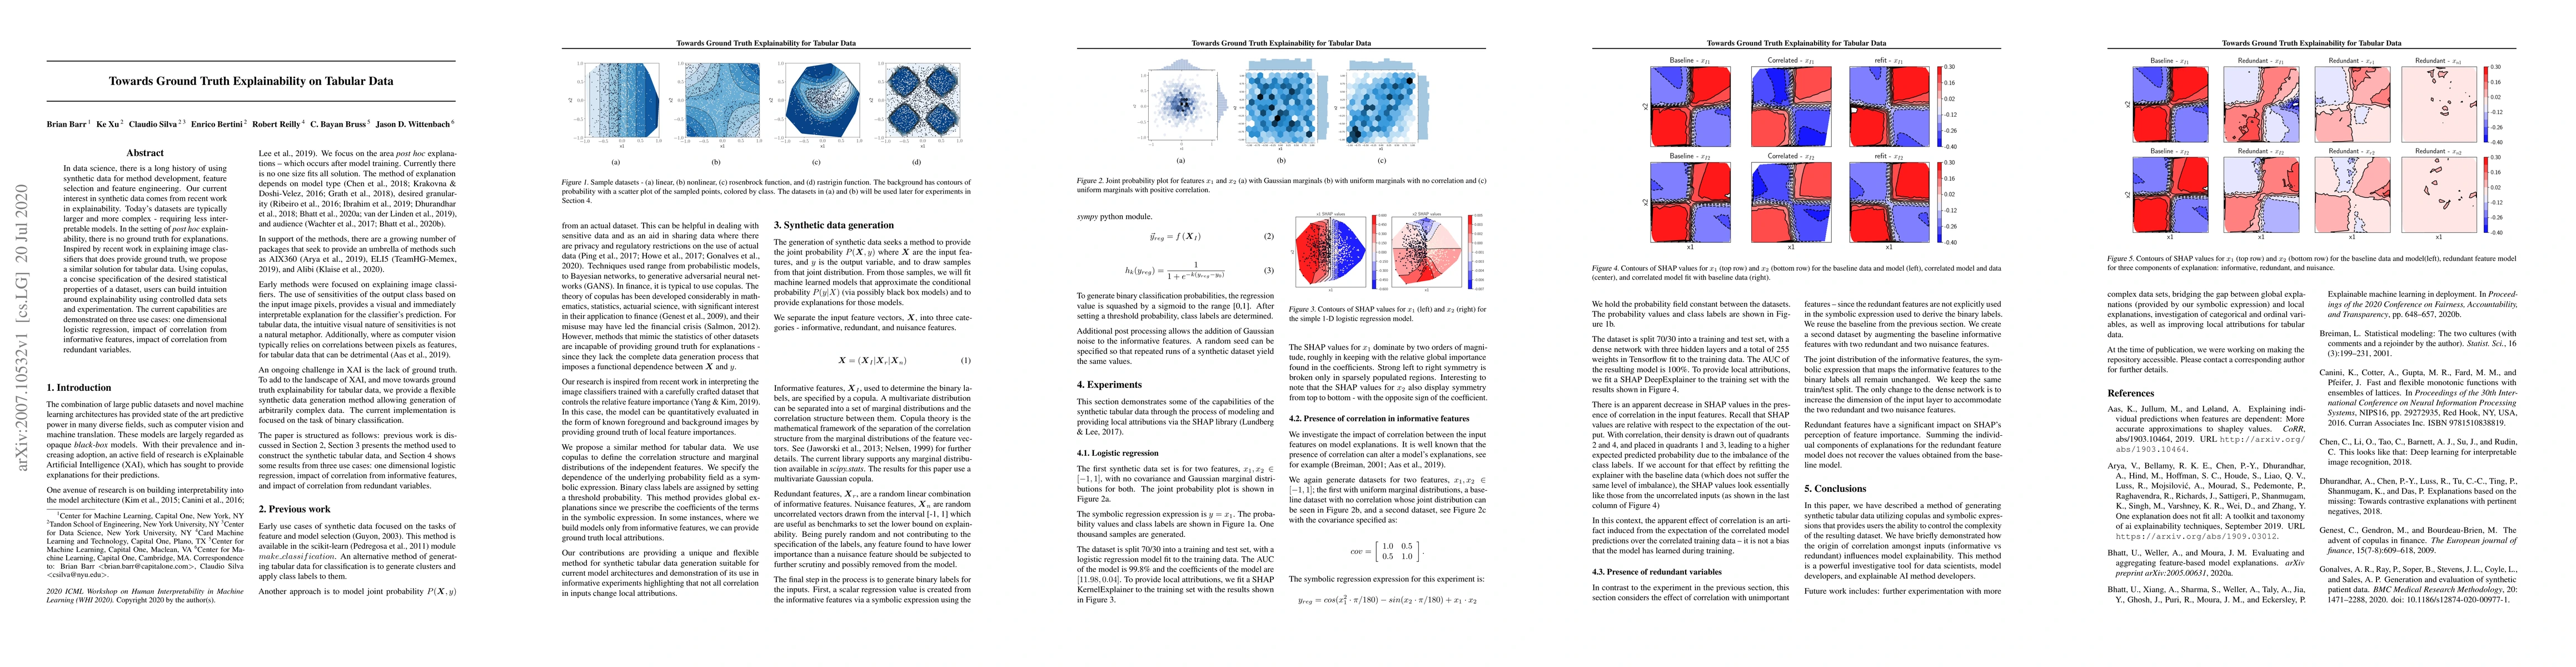
In data science, there is a long history of using synthetic data for method development, feature selection and feature engineering. Our current interest in synthetic data comes from recent work in e...
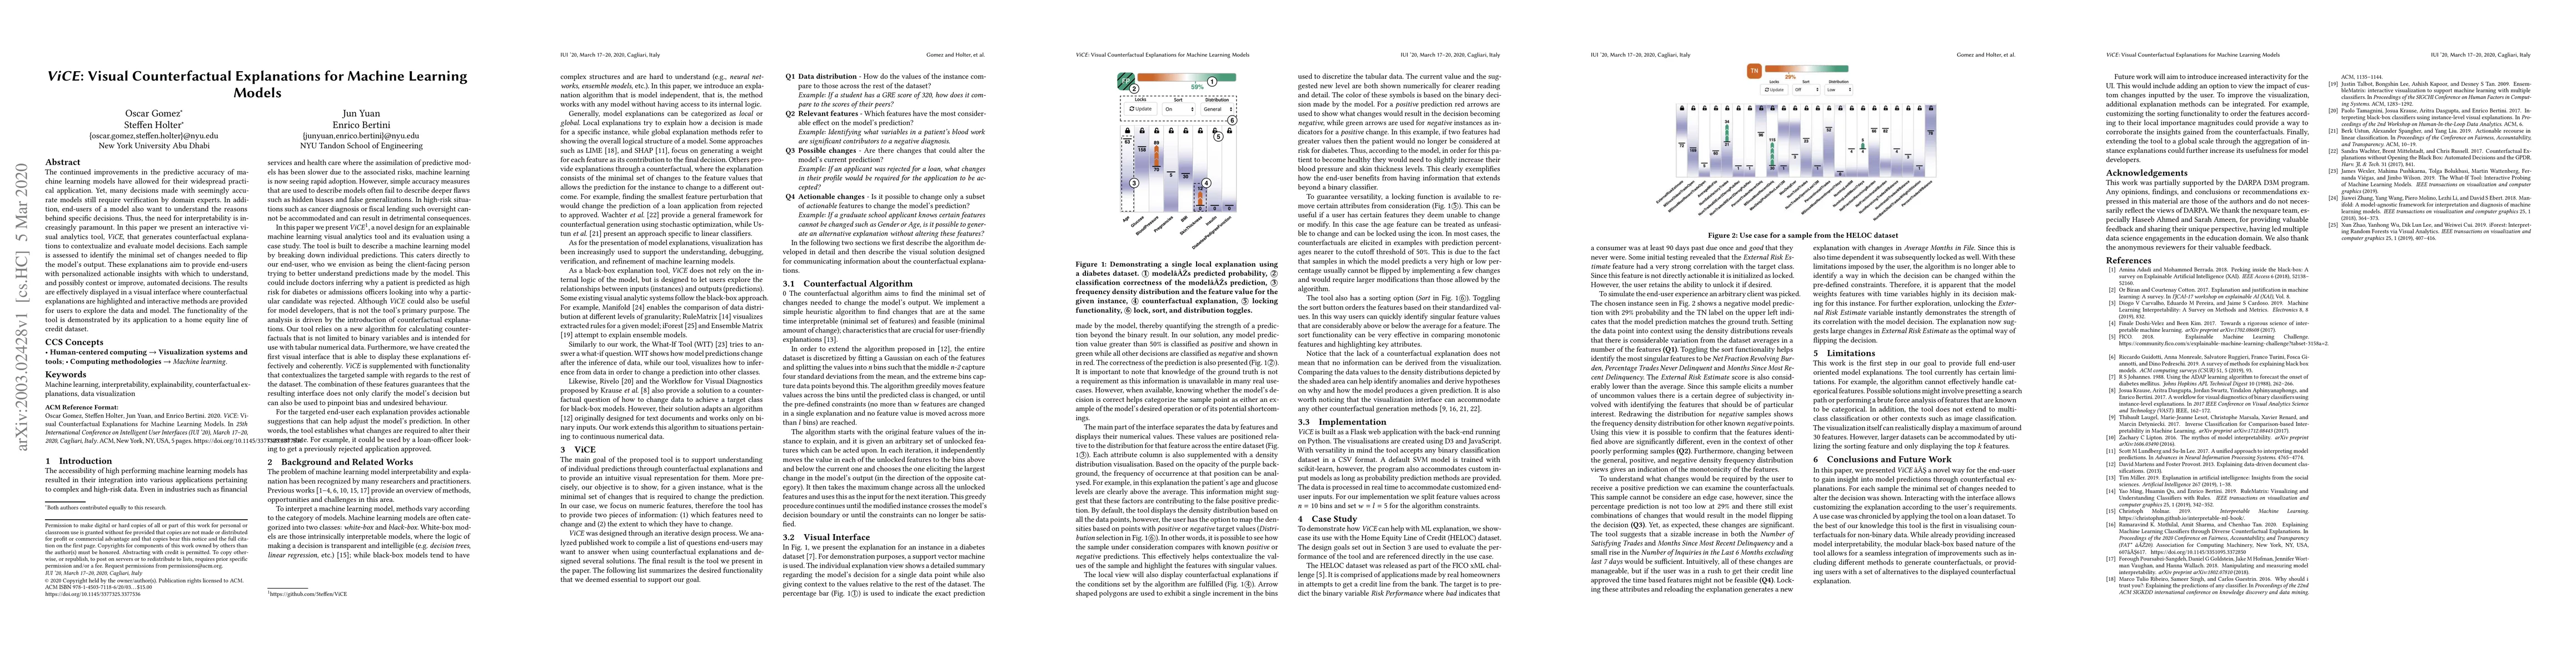
The continued improvements in the predictive accuracy of machine learning models have allowed for their widespread practical application. Yet, many decisions made with seemingly accurate models stil...
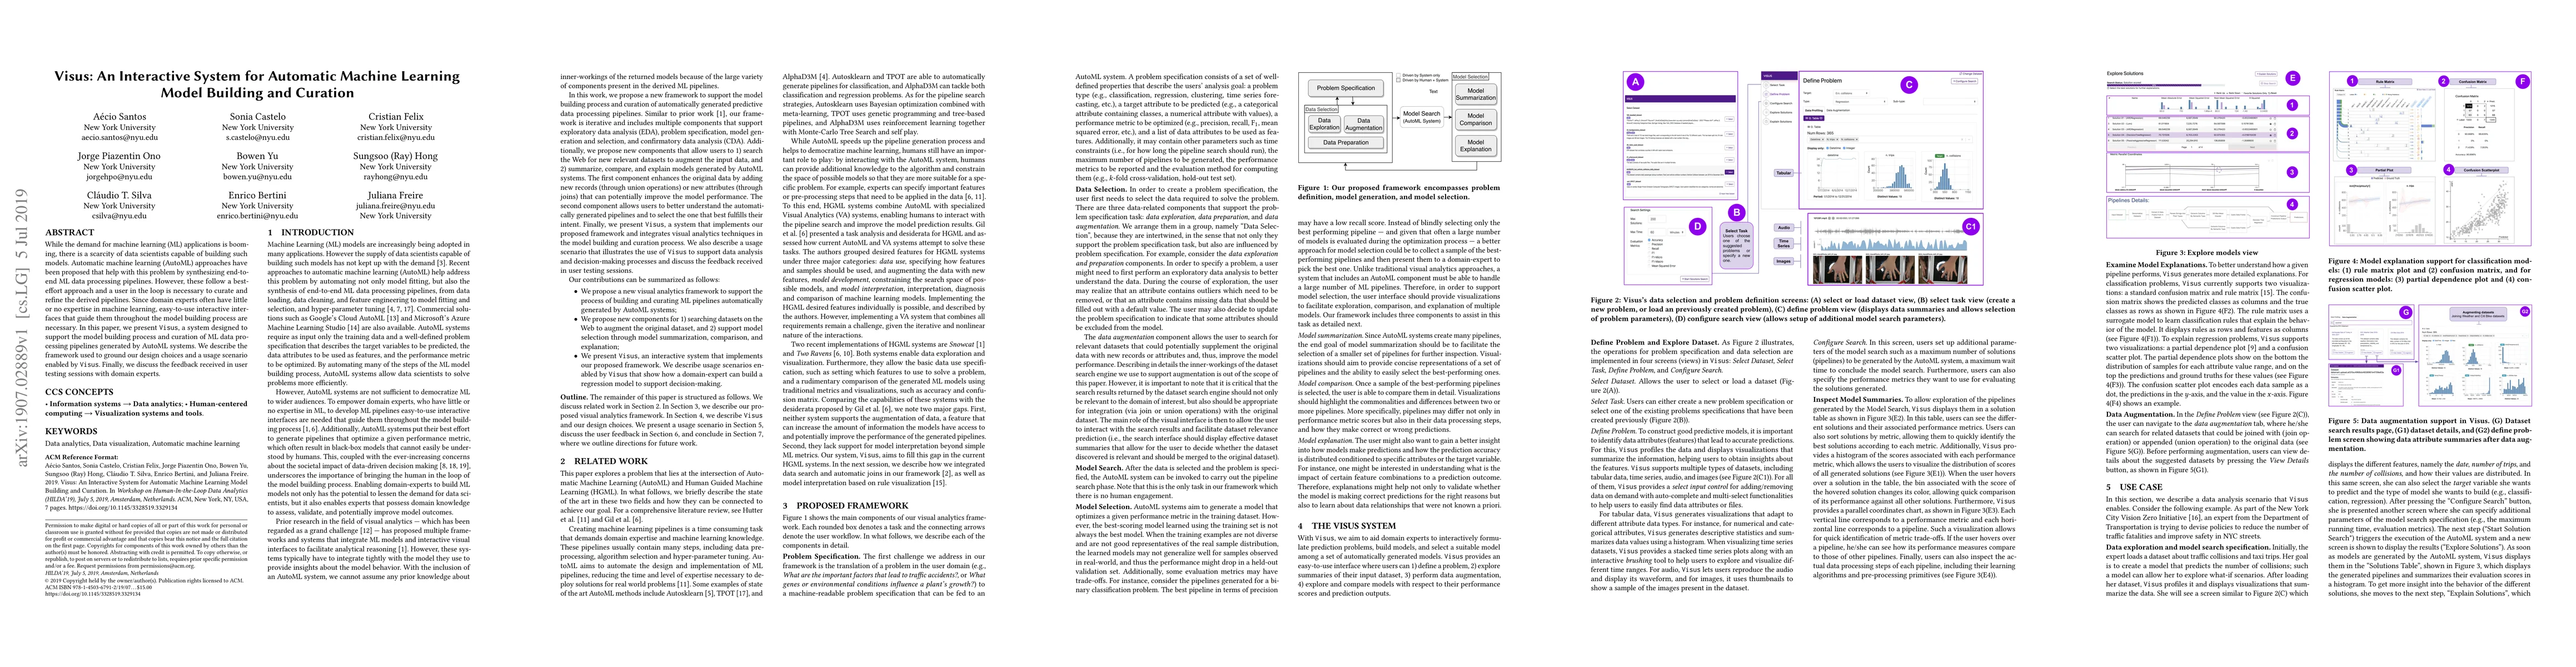
While the demand for machine learning (ML) applications is booming, there is a scarcity of data scientists capable of building such models. Automatic machine learning (AutoML) approaches have been p...
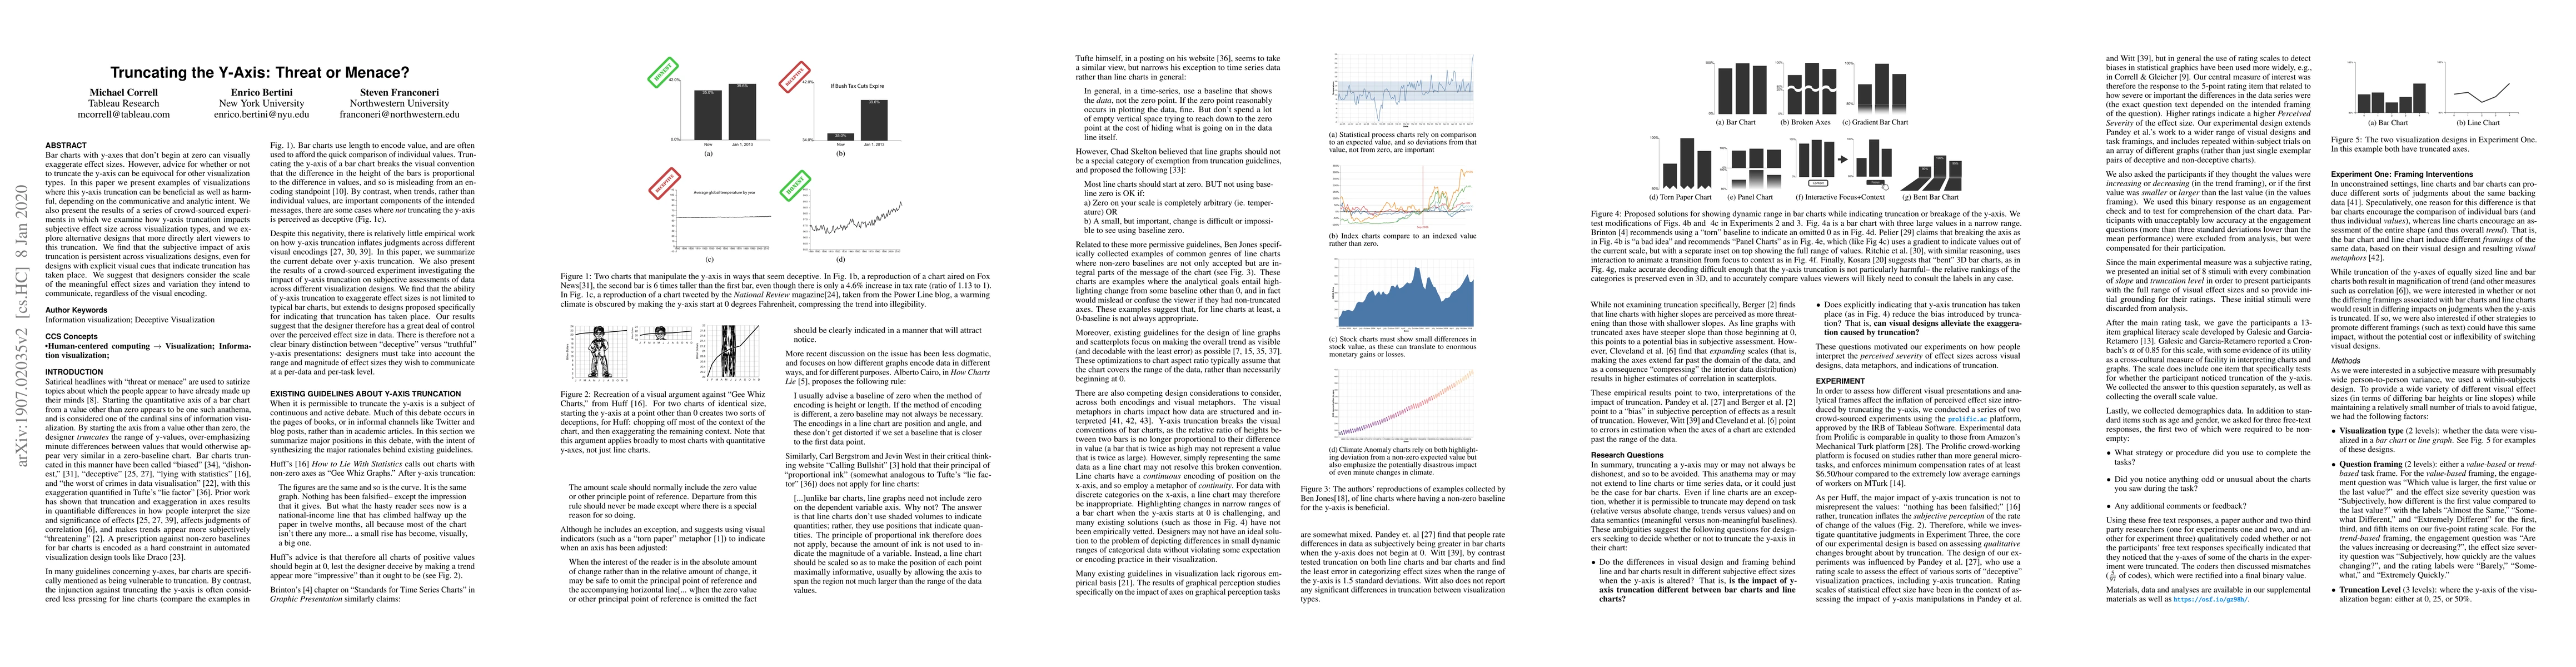
Bar charts with y-axes that don't begin at zero can visually exaggerate effect sizes. However, advice for whether or not to truncate the y-axis can be equivocal for other visualization types. In thi...
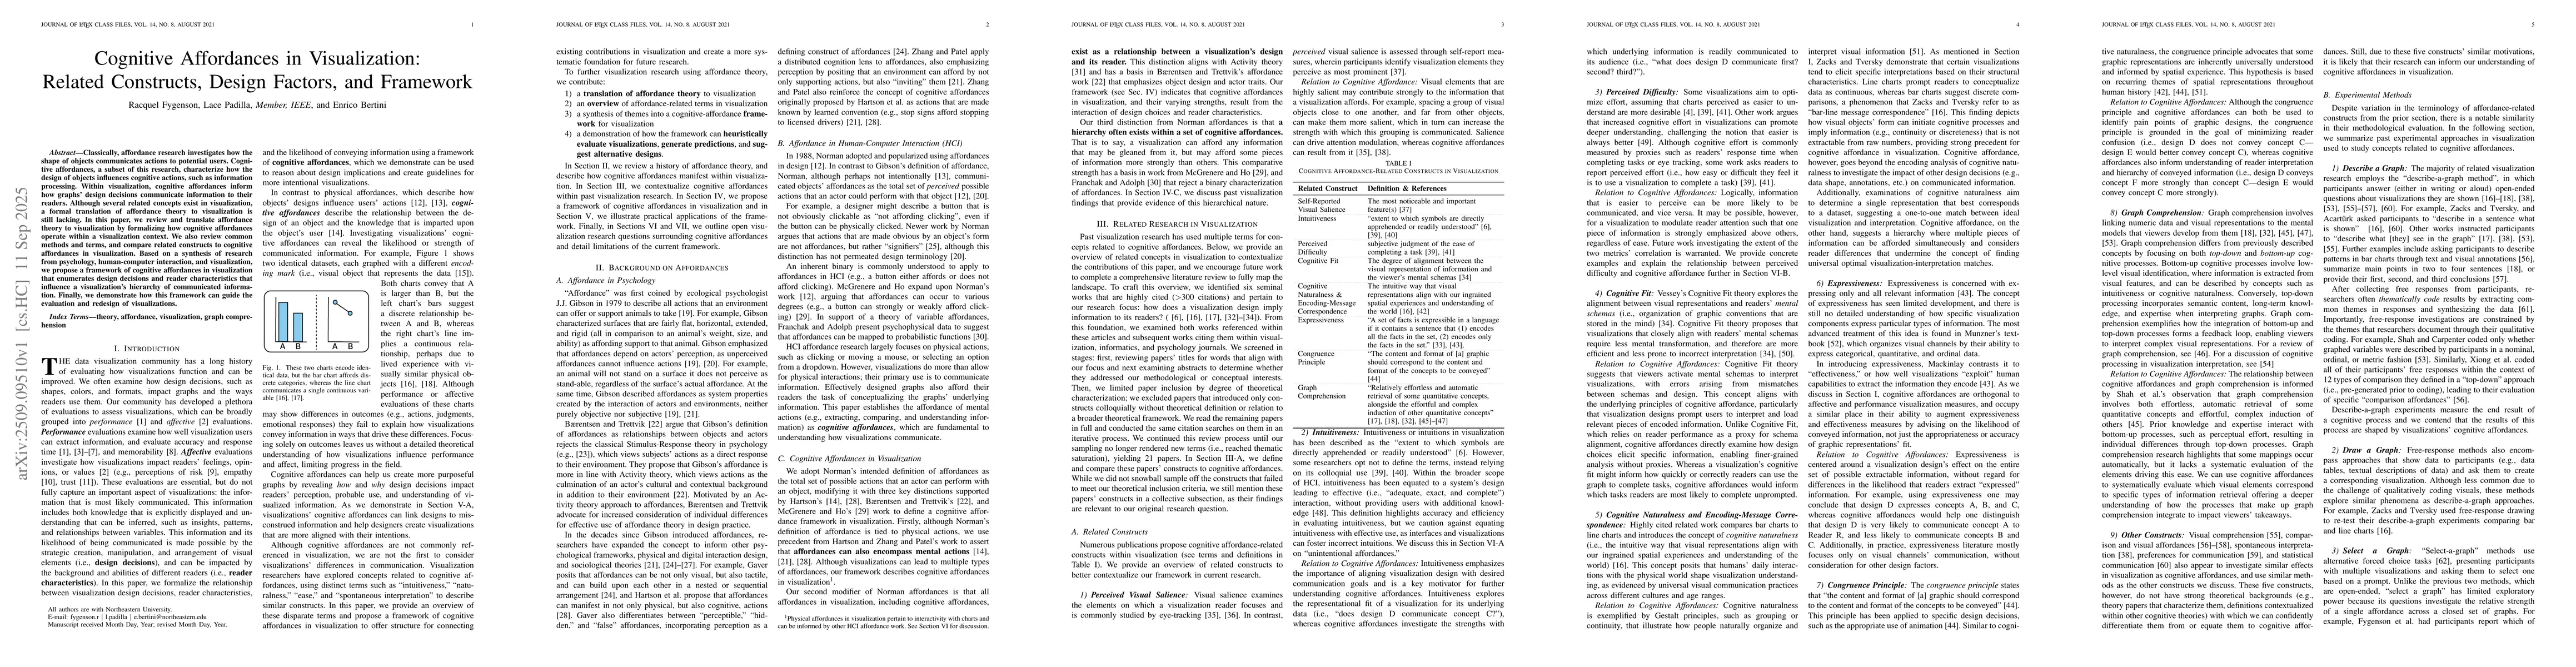
Classically, affordance research investigates how the shape of objects communicates actions to potential users. Cognitive affordances, a subset of this research, characterize how the design of objects...
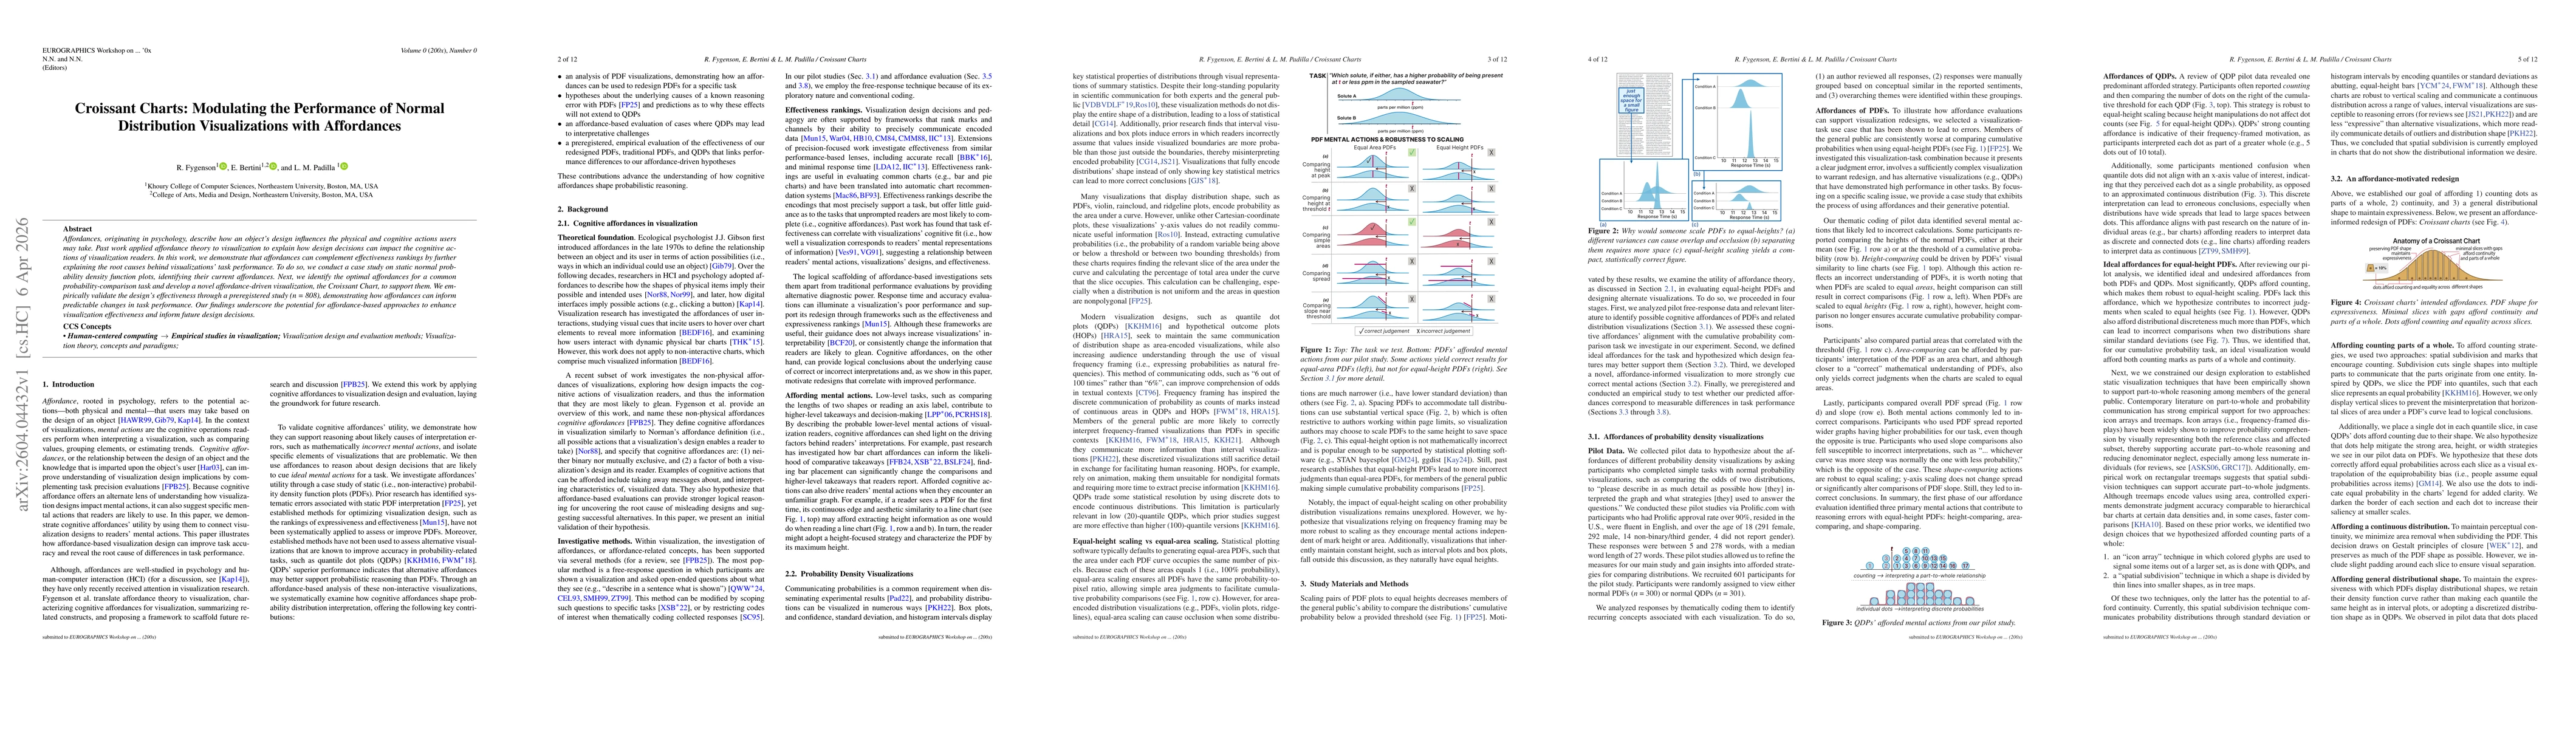
Affordances, originating in psychology, describe how an object's design influences the physical and cognitive actions users may take. Past work applied affordance theory to visualization to explain ho...