Topology Density Map for Urban Data Visualization and Analysis
Publication
Metrics
AI Quick Summary
A new method called Topology Density Map is proposed for visualizing urban data, offering accurate and intuitive density maps by analyzing road networks and traffic conditions. The method provides a feasible solution for decision-making in urban analysis.
Paper Preview
Abstract
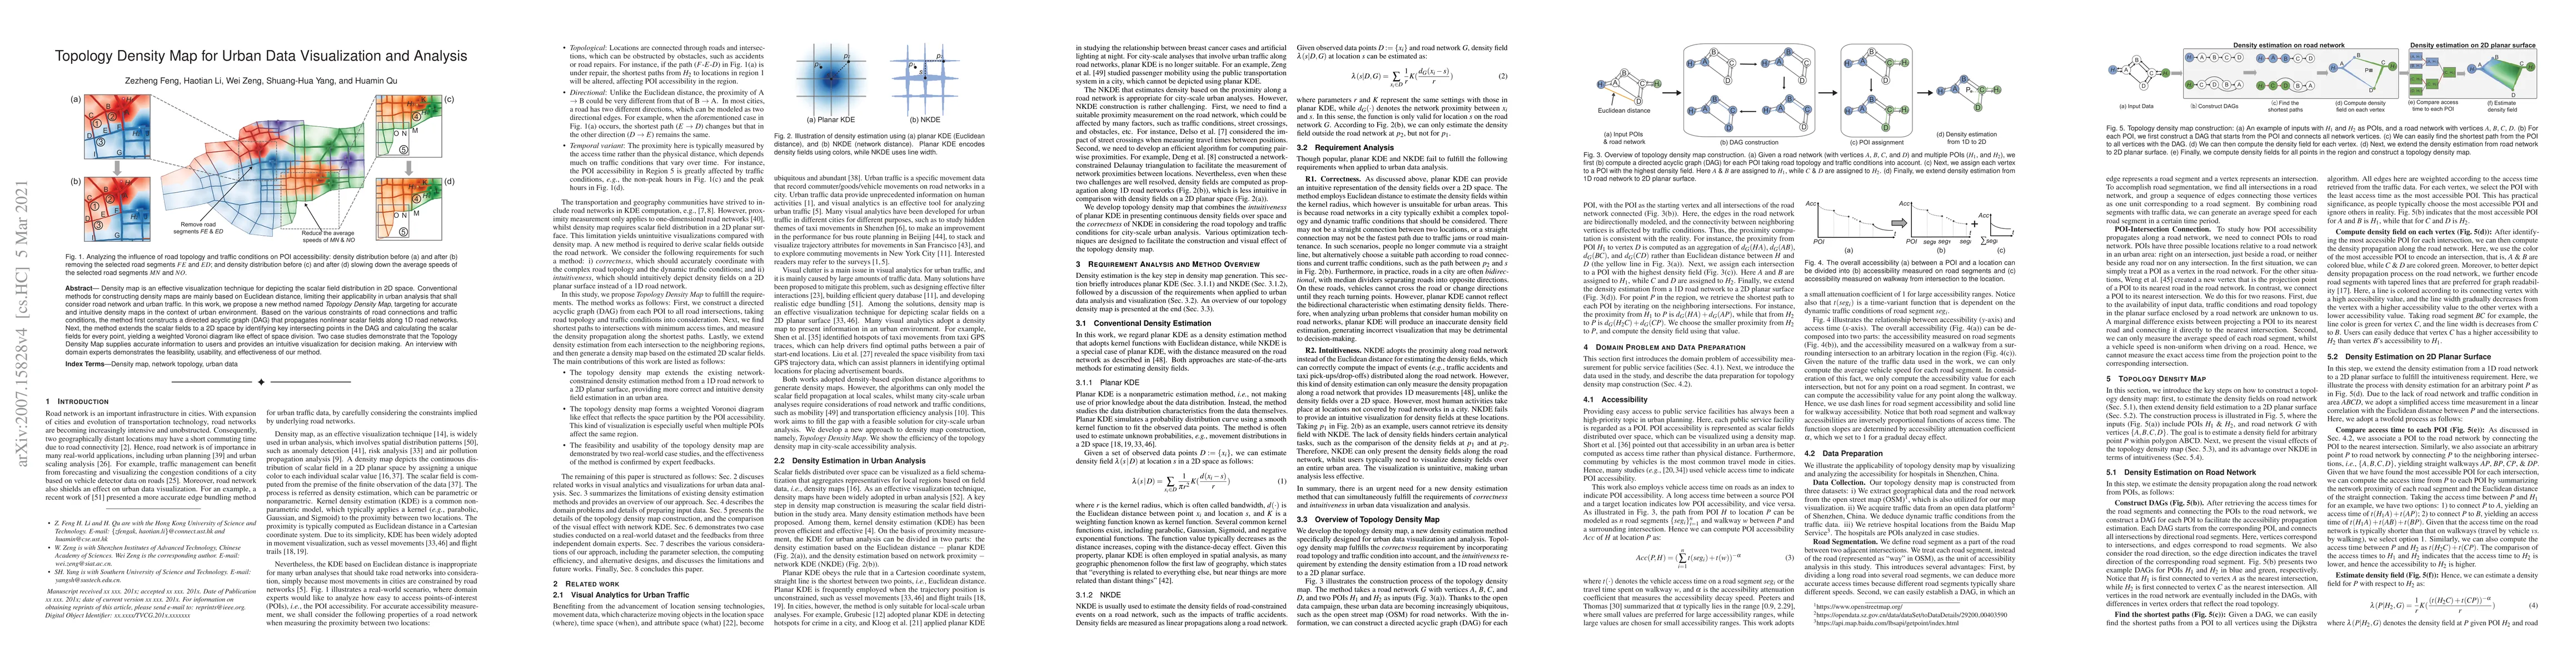
Density map is an effective visualization technique for depicting the scalar field distribution in 2D space. Conventional methods for constructing density maps are mainly based on Euclidean distance, limiting their applicability in urban analysis that shall consider road network and urban traffic. In this work, we propose a new method named Topology Density Map, targeting for accurate and intuitive density maps in the context of urban environment. Based on the various constraints of road connections and traffic conditions, the method first constructs a directed acyclic graph (DAG) that propagates nonlinear scalar fields along 1D road networks. Next, the method extends the scalar fields to a 2D space by identifying key intersecting points in the DAG, dividing the underlying territory into planar regions using a weighted Voronoi diagram, and calculating the scalar fields for every point. Two case studies demonstrate that the Topology Density Map supplies accurate information to users and provides an intuitive visualization for decision making. An interview with domain experts demonstrates the feasibility, usability, and effectiveness of our method.
AI Key Findings
Get AI-generated insights about this paper's methodology, results, significance, and more — seven facets brought into focus.
Impact
Paper Details
Authors
PDF Preview
Key Terms
Citation Network
Current paper (gray), citations (green), references (blue)
Display is limited for performance on very large graphs.
Discussion 0