01
MethodologyHow they did it
A semi-automated datatour was created to aid network exploration and help learn concepts of network analysis.
This paper presents NetworkNarratives, a semi-automatic data tour system designed to facilitate the exploration of complex networks through goal-oriented tours. The system aids analysts in navigating network overviews, ego-network analysis, and community exploration, significantly reducing exploration effort and supporting both expert and novice users.
A semi-automated datatour was created to aid network exploration and help learn concepts of network analysis. More in Methodology →
The creation of a goal-oriented tour inspired by real-world analysis practices — The integration of semi-automated techniques to retrieve related facts on user demand More in Key Results →
This research aims to provide a promising future for tools that can automatically identify and visually communicate insights by drawing on storytelling techniques. More in Significance →
The initial set of 10 datatours may not be sufficient — The system may not handle complex network structures More in Limitations →
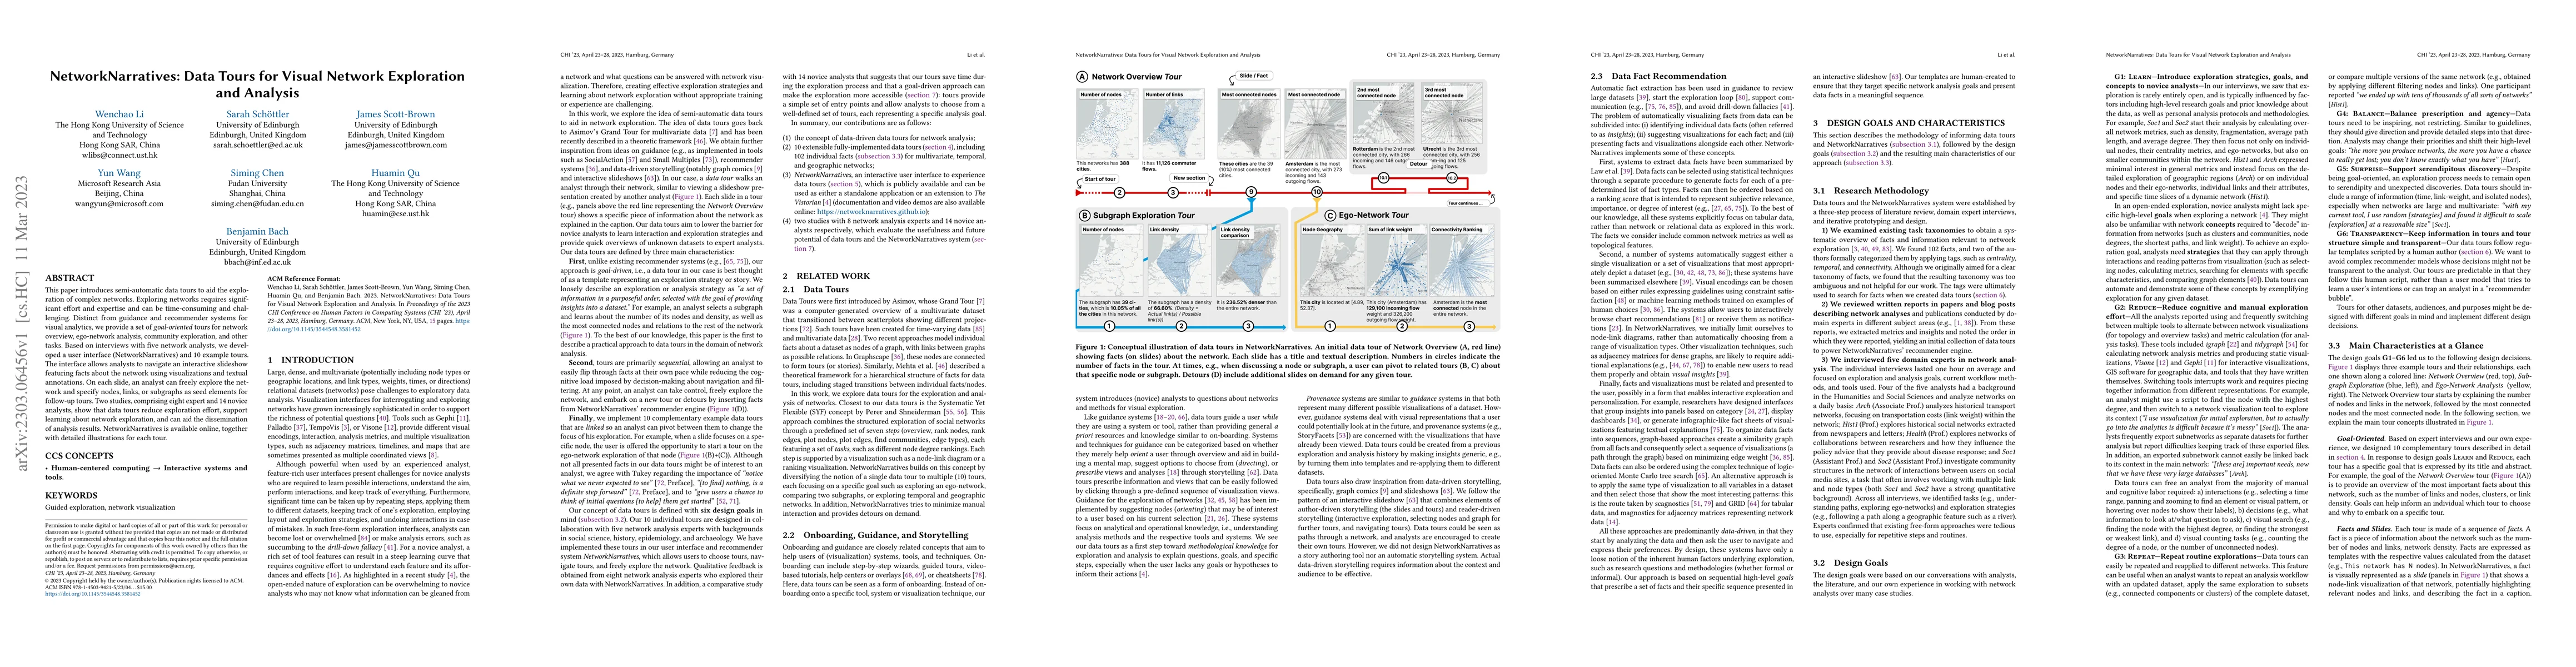
This paper introduces semi-automatic data tours to aid the exploration of complex networks. Exploring networks requires significant effort and expertise and can be time-consuming and challenging. Distinct from guidance and recommender systems for visual analytics, we provide a set of goal-oriented tours for network overview, ego-network analysis, community exploration, and other tasks. Based on interviews with five network analysts, we developed a user interface (NetworkNarratives) and 10 example tours. The interface allows analysts to navigate an interactive slideshow featuring facts about the network using visualizations and textual annotations. On each slide, an analyst can freely explore the network and specify nodes, links, or subgraphs as seed elements for follow-up tours. Two studies, comprising eight expert and 14 novice analysts, show that data tours reduce exploration effort, support learning about network exploration, and can aid the dissemination of analysis results. NetworkNarratives is available online, together with detailed illustrations for each tour.
Seven facets of this paper, analysed and brought into focus by AI.
This research aims to provide a promising future for tools that can automatically identify and visually communicate insights by drawing on storytelling techniques.
A semi-automated datatour was created to aid network exploration and help learn concepts of network analysis.
This research aims to provide a promising future for tools that can automatically identify and visually communicate insights by drawing on storytelling techniques.
The creation of a novel semi-automated datatour system that combines goal-oriented tours with data-driven recommender systems.
This work is the first to explore datatours in the context of network analysis, offering a promising approach for visual network exploration and analysis
Current paper (gray), citations (green), references (blue)
Display is limited for performance on very large graphs.
Discussion 0