AniVis: Generating Animated Transitions Between Statistical Charts with a Tree Model
Publication
Metrics
AI Quick Summary
AniVis automates the generation of animated transitions between statistical charts by modeling them as tree-based structures and formalizing differences as tree edit operations. The approach synthesizes smooth transitions through a sequence composition algorithm, validated by a prototype and comparative study.
Paper Preview
Abstract
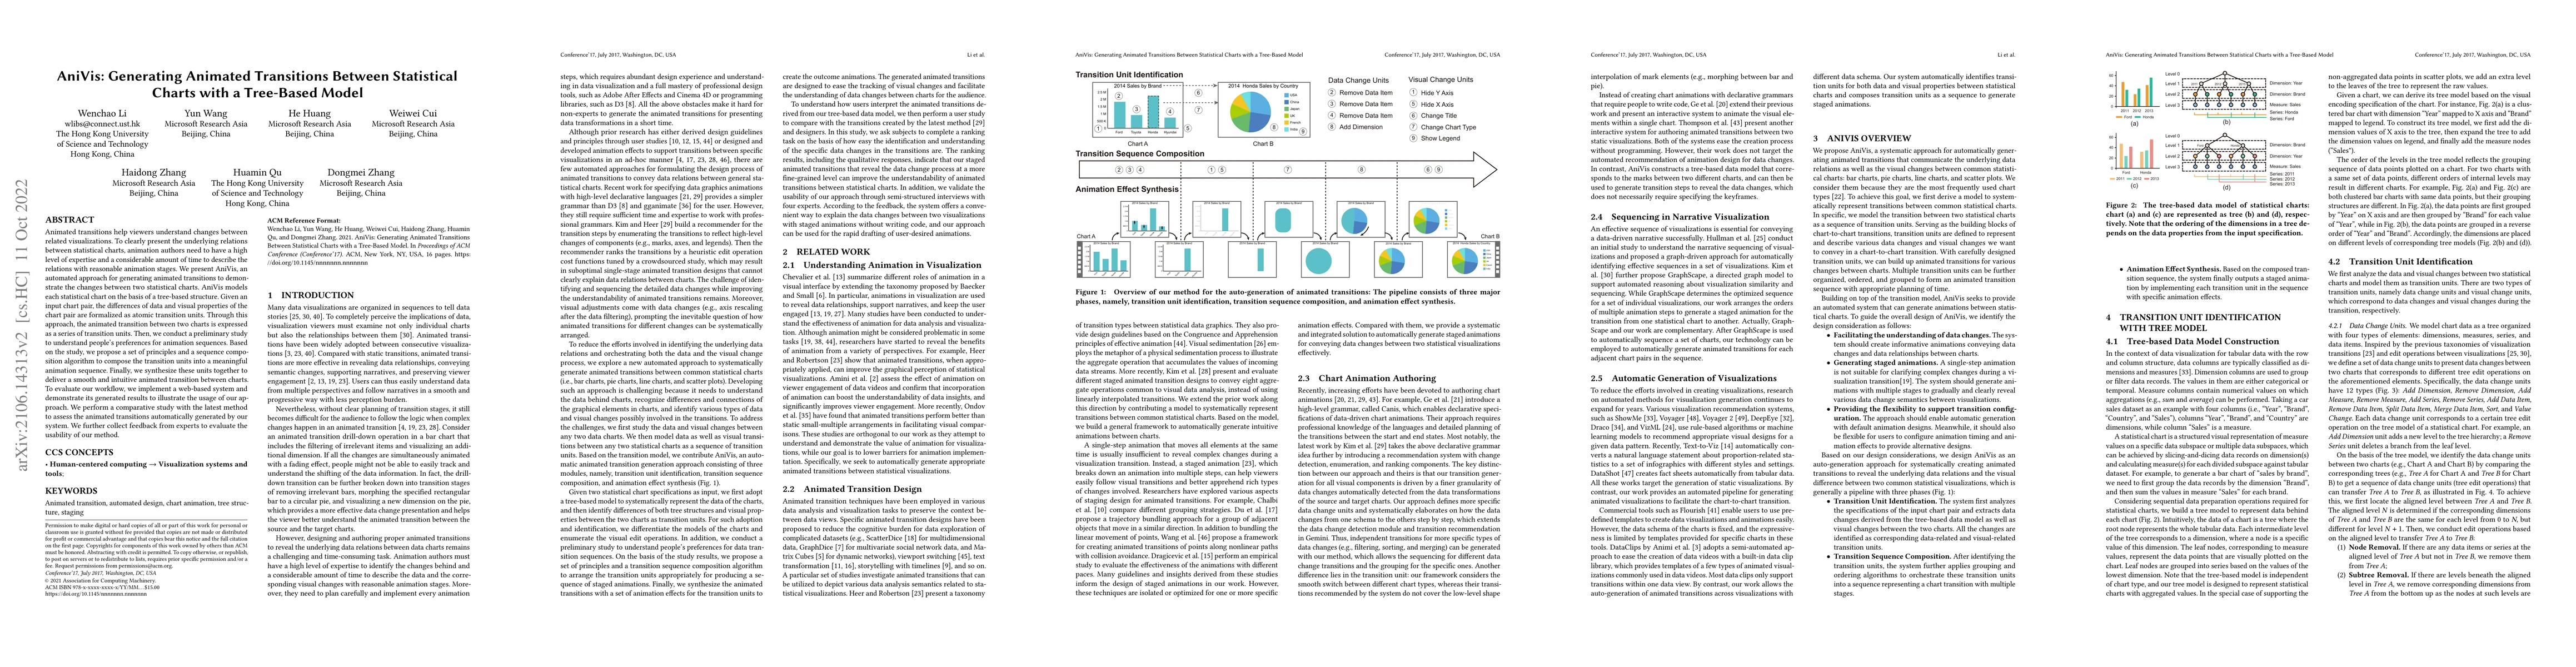
Animated transitions help viewers understand changes between related visualizations. To clearly present the underlying relations between statistical charts, animation authors need to have a high level of expertise and a considerable amount of time to describe the relations with reasonable animation stages. We present AniVis, an automated approach for generating animated transitions to demonstrate the changes between two statistical charts. AniVis models each statistical chart into a tree-based structure. Given an input chart pair, the differences of data and visual properties of the chart pair are formalized as tree edit operations. The edit operations can be mapped to atomic transition units. Through this approach, the animated transition between two charts can be expressed as a set of transition units. Then, we conduct a formative study to understand people's preferences for animation sequences. Based on the study, we propose a set of principles and a sequence composition algorithm to compose the transition units into a meaningful animation sequence. Finally, we synthesize these units together to deliver a smooth and intuitive animated transition between charts. To test our approach, we present a prototype system and its generated results to illustrate the usage of our framework. We perform a comparative study to assess the transition sequence derived from the tree model. We further collect qualitative feedback to evaluate the effectiveness and usefulness of our method.
AI Key Findings
Get AI-generated insights about this paper's methodology, results, significance, and more — seven facets brought into focus.
Impact
Paper Details
Authors
PDF Preview
Key Terms
Citation Network
Current paper (gray), citations (green), references (blue)
Display is limited for performance on very large graphs.
Discussion 0