Aquanims: Area-Preserving Animated Transitions in Statistical Data Graphics based on a Hydraulic Metaphor
Publication
Metrics
AI Quick Summary
"Aquanims" introduces animated transitions that maintain displayed areas during transformations, using a hydraulic metaphor to ensure area preservation in visualizations like bar charts and histograms. This approach facilitates understanding of changes in data and classification errors.
Paper Preview
Abstract
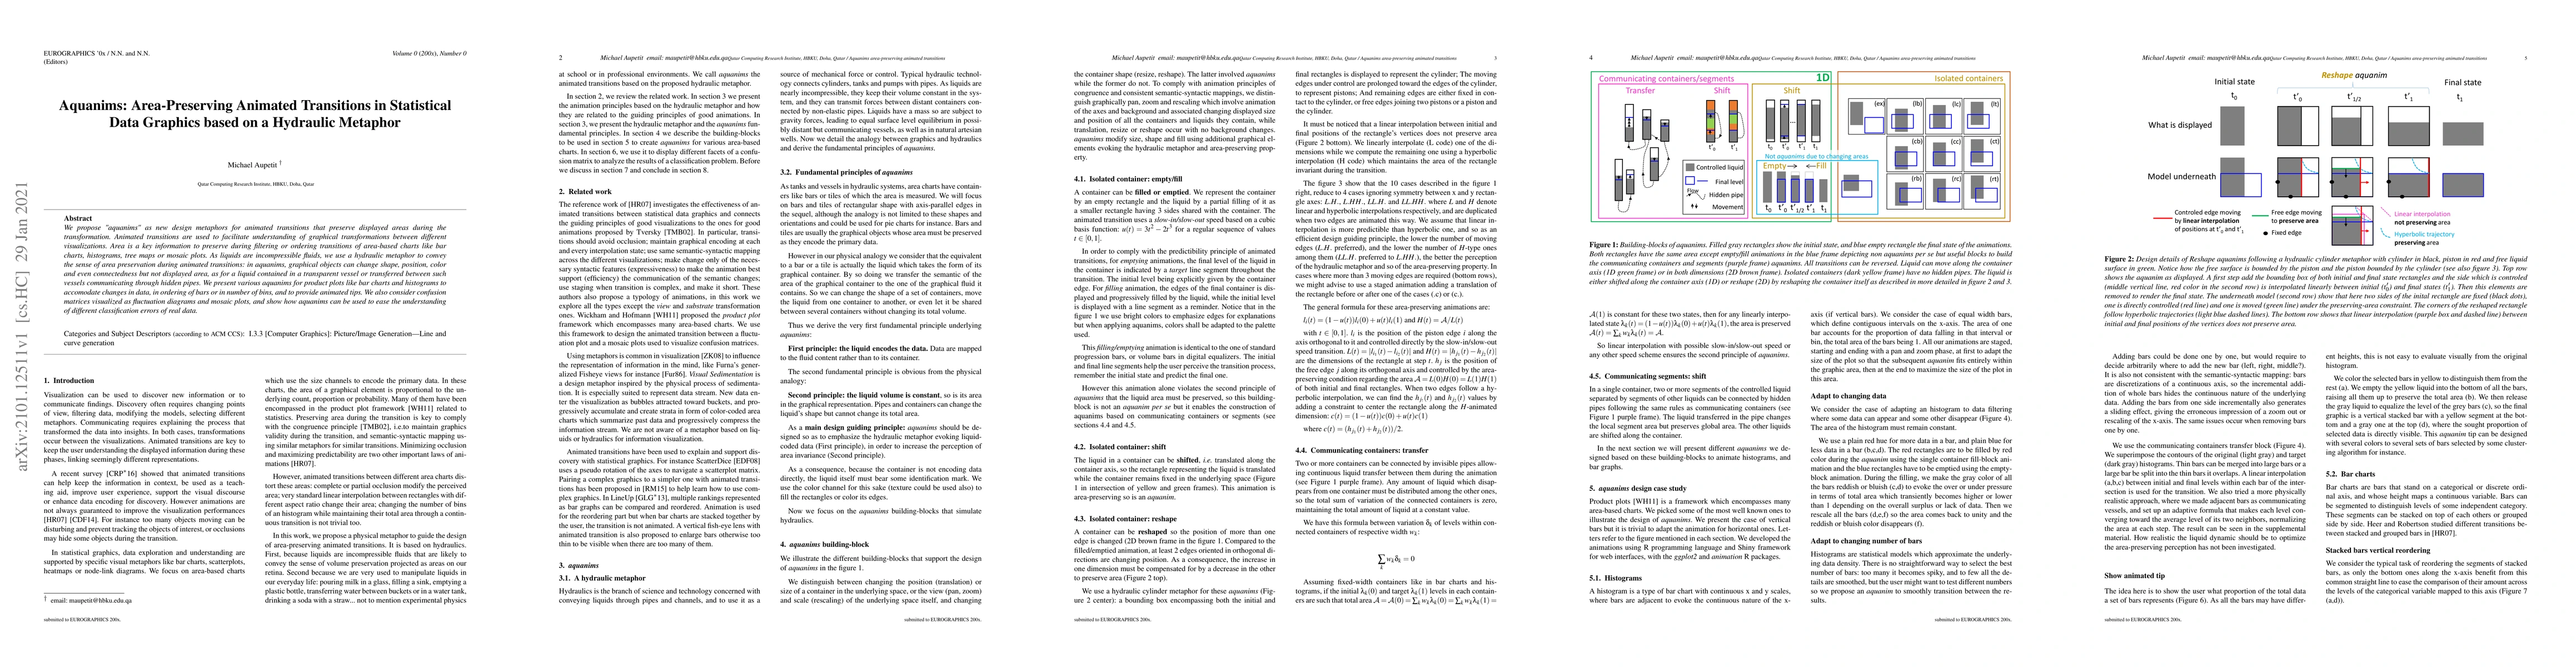
We propose "aquanims" as new design metaphors for animated transitions that preserve displayed areas during the transformation. Animated transitions are used to facilitate understanding of graphical transformations between different visualizations. Area is key information to preserve during filtering or ordering transitions of area-based charts like bar charts, histograms, treemaps, or mosaic plots. As liquids are incompressible fluids, we use a hydraulic metaphor to convey the sense of area preservation during animated transitions: in aquanims, graphical objects can change shape, position, color, and even connectedness but not displayed area, as for a liquid contained in a transparent vessel or transferred between such vessels communicating through hidden pipes. We present various aquanims for product plots like bar charts and histograms to accommodate changes in data, in the ordering of bars or in a number of bins, and to provide animated tips. We also consider confusion matrices visualized as fluctuation diagrams and mosaic plots, and show how aquanims can be used to ease the understanding of different classification errors of real data.
AI Key Findings
Get AI-generated insights about this paper's methodology, results, significance, and more — seven facets brought into focus.
Impact
Paper Details
Authors
PDF Preview
Key Terms
Citation Network
Current paper (gray), citations (green), references (blue)
Display is limited for performance on very large graphs.
Discussion 0