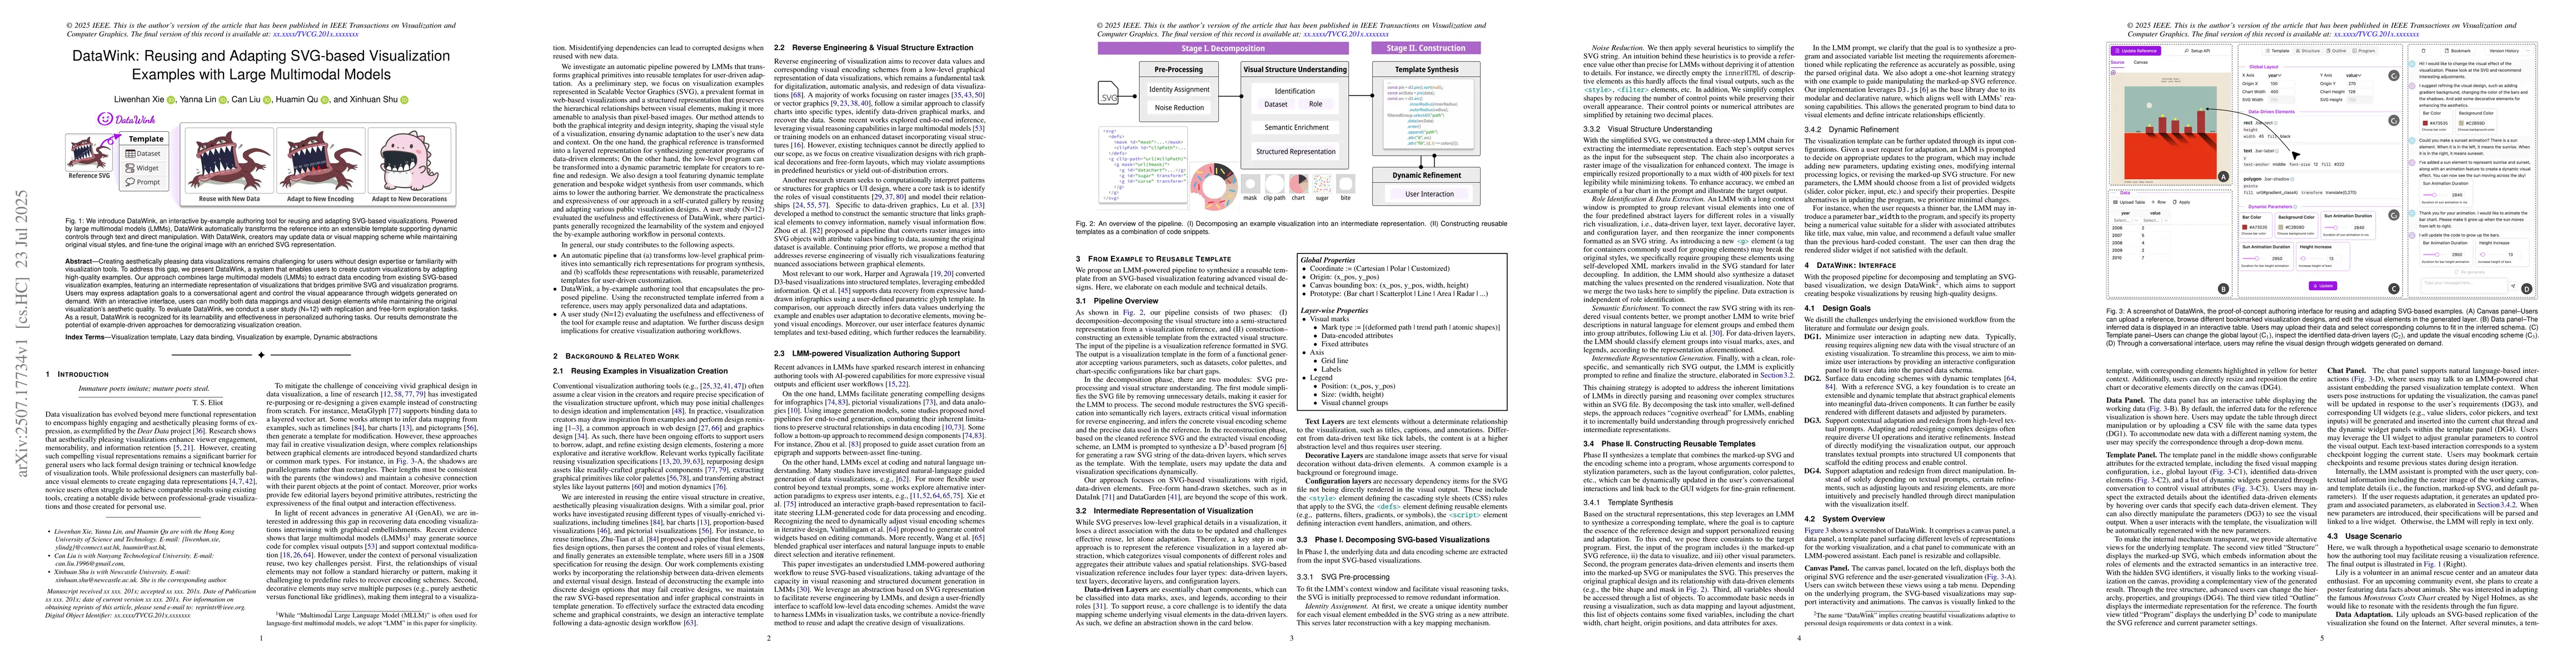
DataWink: Reusing and Adapting SVG-based Visualization Examples with Large Multimodal Models
Publication
Metrics
Paper Preview
Abstract
Creating aesthetically pleasing data visualizations remains challenging for users without design expertise or familiarity with visualization tools. To address this gap, we present DataWink, a system that enables users to create custom visualizations by adapting high-quality examples. Our approach combines large multimodal models (LMMs) to extract data encoding from existing SVG-based visualization examples, featuring an intermediate representation of visualizations that bridges primitive SVG and visualization programs. Users may express adaptation goals to a conversational agent and control the visual appearance through widgets generated on demand. With an interactive interface, users can modify both data mappings and visual design elements while maintaining the original visualization's aesthetic quality. To evaluate DataWink, we conduct a user study (N=12) with replication and free-form exploration tasks. As a result, DataWink is recognized for its learnability and effectiveness in personalized authoring tasks. Our results demonstrate the potential of example-driven approaches for democratizing visualization creation.
AI Key Findings
Get AI-generated insights about this paper's methodology, results, significance, and more — seven facets brought into focus.
Discussion 0