Quick Summary:

Narvis is a slideshow authoring tool designed to help teachers and students introduce and understand complex data visualization designs. It provides templates for annotations and animations, and automatically detects and organizes visualization components for efficient authoring.

Summary

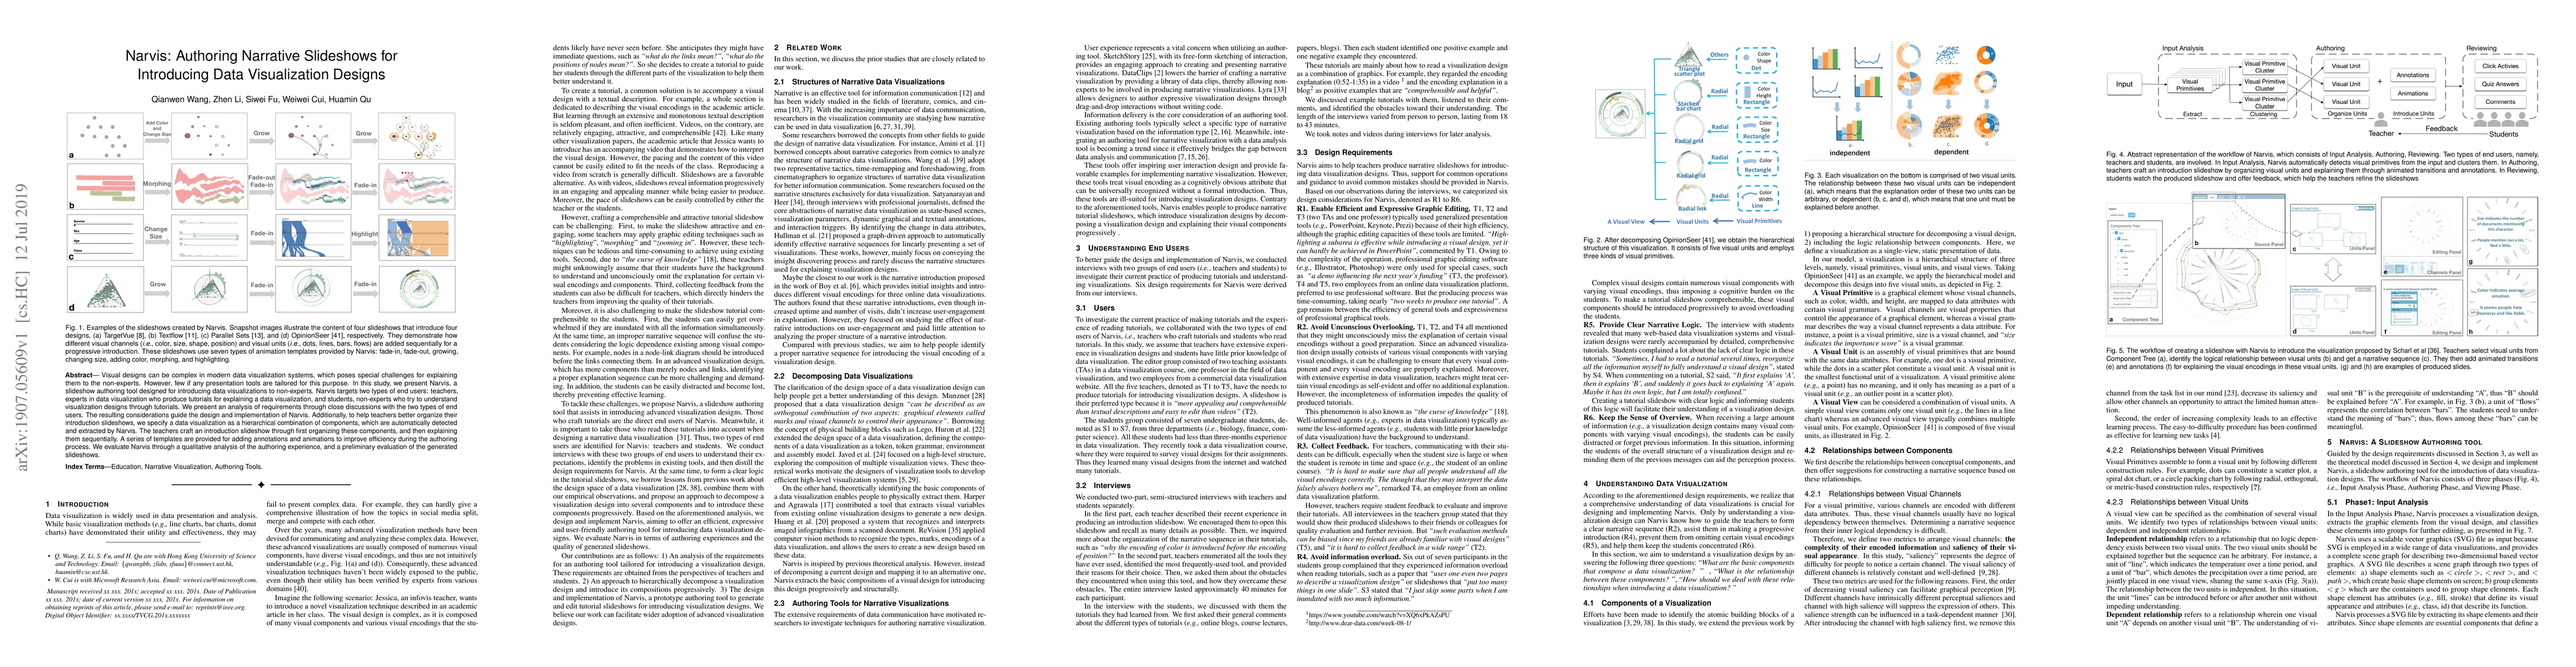
Visual designs can be complex in modern data visualization systems, which poses special challenges for explaining them to the non-experts. However, few if any presentation tools are tailored for this purpose. In this study, we present Narvis, a slideshow authoring tool designed for introducing data visualizations to non-experts. Narvis targets two types of end-users: teachers, experts in data visualization who produce tutorials for explaining a data visualization, and students, non-experts who try to understand visualization designs through tutorials. We present an analysis of requirements through close discussions with the two types of end-users. The resulting considerations guide the design and implementation of Narvis. Additionally, to help teachers better organize their introduction slideshows, we specify a data visualization as a hierarchical combination of components, which are automatically detected and extracted by Narvis. The teachers craft an introduction slideshow through first organizing these components, and then explaining them sequentially. A series of templates are provided for adding annotations and animations to improve efficiency during the authoring process. We evaluate Narvis through a qualitative analysis of the authoring experience, and a preliminary evaluation of the generated slideshows.

AI Key Findings

Get AI-generated insights about this paper's methodology, results, and significance.

Paper Details

PDF Preview

Download PDF

Key Terms

visualization (0.341)
experts (0.318)
experts (0.291)
explaining (0.280)
explaining (0.277)
introduction (0.211)
designs (0.211)
designs (0.209)
introduction (0.193)
users (0.178)
users (0.169)
components (0.158)
types (0.156)
end (0.155)
end (0.153)
types (0.150)
components (0.146)
data (0.142)
templates (0.142)
sequentially (0.142)

Citation Network

Current paper (gray), citations (green), references (blue)

Current Paper
Citations
References
Click to view
Title Authors Year Actions
A Survey on Annotations in Information Visualization: Empirical Insights, Applications, and Challenges
Md Dilshadur Rahman, Bhavana Doppalapudi, Ghulam Jilani Quadri, Paul Rosen
2024
View Paper
D-Tour: Semi-Automatic Generation of Interactive Guided Tours for Visualization Dashboard Onboarding
V. Dhanoa, A. Hinterreiter, Vanessa Fediuk, Niklas Elmqvist, Eduard Gröller, Marc Streit
2024
View Paper
Exploring annotation taxonomy in grouped bar charts: A qualitative classroom study
Md Dilshadur Rahman, Ghulam Jilani Quadri, D. Szafir, Paul Rosen
2024
View Paper
DG Comics: Semi-Automatically Authoring Graph Comics for Dynamic Graphs
Joohee Kim, Hyunwoo Lee, Duc-Minh Nguyen, Minjeong Shin, Bum Chul Kwon, Sungahn Ko, Niklas Elmqvist
2024
View Paper
KNowNEt:Guided Health Information Seeking from LLMs via Knowledge Graph Integration
Youfu Yan, Yu Hou, Yongkang Xiao, Rui Zhang, Qianwen Wang
2024
View Paper
Towards Understanding the Authoring Strategy and Effectiveness of Visualization Sketches
Ruike Jiang, Yiheng Liang, Hanning Shao, Le Liu, Xiaoru Yuan
2024
View Paper
Feature-Action Design Patterns for Storytelling Visualizations with Time Series Data
Saiful Khan, Scott Jones, Benjamin Bach, Jaehoon Cha, Min Chen, Julie Meikle, Jonathan C. Roberts, J. Thiyagalingam, Jo Wood, Panagiotis D. Ritsos
2024
View Paper
Leveraging Foundation Models for Crafting Narrative Visualization: A Survey.
Yi He, Ke Xu, Shixiong Cao, Yang Shi, Qing Chen, Nan Cao
2024
View Paper
Enabling Multimodal User Interactions for Genomics Visualization Creation
Qianwen Wang, Xiao Liu, Man Qing Liang, S. L’Yi, Nils Gehlenborg
2023
View Paper
Reviving Static Charts into Live Charts
Lu Ying, Yun Wang, Haotian Li, Shuguang Dou, Haidong Zhang, Xinyang Jiang, Huamin Qu, Yingcai Wu
2023
View Paper
Character-Oriented Design for Visual Data Storytelling
Keshav Dasu, Yun-Hsin Kuo, K. Ma
2023
View Paper
Re-understanding of data storytelling tools from a narrative perspective
Pengkun Ren, Yi Wang, Fan Zhao
2023
View Paper
A Qualitative Analysis of Common Practices in Annotations: A Taxonomy and Design Space
Md Dilshadur Rahman, Ghulam Jilani Quadri, Bhavana Doppalapudi, D. Szafir, Paul Rosen
2023
View Paper
DRAVA: Aligning Human Concepts with Machine Learning Latent Dimensions for the Visual Exploration of Small Multiples
Qianwen Wang, S. L’Yi, Nils Gehlenborg
2023
View Paper
Deimos: A Grammar of Dynamic Embodied Immersive Visualisation Morphs and Transitions
Benjamin Lee, Arvind Satyanarayan, Maxime Cordeil, Arnaud Prouzeau, B. Jenny, Tim Dwyer
2023
View Paper
From Invisible to Visible: Impacts of Metadata in Communicative Data Visualization
Alyxander Burns, C. Lee, Thai On, Cindy Xiong, Evan M. Peck, Narges Mahyar
2022
View Paper
Erato: Cooperative Data Story Editing via Fact Interpolation
Mengdi Sun, Ligan Cai, Weiwei Cui, Yanqiu Wu, Yang Shi, Nan Cao
2022
View Paper
A Process Model for Dashboard Onboarding
V. Dhanoa, C. Walchshofer, A. Hinterreiter, Holger Stitz, E. Groeller, M. Streit
2022
View Paper
Roslingifier: Semi-Automated Storytelling for Animated Scatterplots
Minjeong Shin, Joohee Kim, Yunha Han, Lexing Xie, M. Whitelaw, Bum Chul Kwon, Sungahn Ko, N. Elmqvist
2022
View Paper
Making the Invisible Visible: Risks and Benefits of Disclosing Metadata in Visualization
Alyxander Burns, Thai On, C. Lee, R. Shapiro, Cindy Xiong, Narges Mahyar
2021
View Paper
Three trajectories for narrative visualisation
Cameron Edmond, T. Bednarz
2021
View Paper
AI4VIS: Survey on Artificial Intelligence Approaches for Data Visualization
Aoyu Wu, Yun Wang, Xinhuan Shu, Dominik Moritz, Weiwei Cui, Haidong Zhang, Dongmei Zhang, Huamin Qu
2021
View Paper
Examining interaction techniques in data visualization authoring tools from the perspective of goals and human cognition: a survey
Sadia Rubab, Junxiu Tang, Yingcai Wu
2021
View Paper
Calliope: Automatic Visual Data Story Generation from a Spreadsheet
Danqing Shi, Xinyue Xu, F. Sun, Yang Shi, Nan Cao
2020
View Paper
Narrative Transitions in Data Videos
Junxiu Tang, Lingyun Yu, Tan Tang, Xinhuan Shu, Lu Ying, Yuhua Zhou, Peiran Ren, Yingcai Wu
2020
View Paper
Visual Analysis of Discrimination in Machine Learning
Qianwen Wang, Zhen Xu, Zhutian Chen, Yong Wang, Shixia Liu, Huamin Qu
2020
View Paper
2019 Index IEEE Transactions on Visualization and Computer Graphics Vol. 25
2020
View Paper
Cheat Sheets for Data Visualization Techniques
Zezhong Wang, Lovisa Sundin, Dave Murray-Rust, Benjamin Bach
2020
View Paper
Authoring Tool Prototype for Dashboard Onboarding Generation
V. Dhanoa, B. Thesis, Ivaletta Shakhova
2023
View Paper
Storybook: A Tool for the Semi-automatic Creation of Book Trailers
Eleonora Bernasconi, Miguel Ceriani, F. Luzi, Francesco Sapio, Massimo Mecella
2022
View Paper
Survey on Artificial Intelligence Approaches for Visualization Data
Aoyu Wu, Yun Wang, Xinhuan Shu, Dominik Moritz, Weiwei Cui, Haidong Zhang, Dongmei Zhang, Huamin Qu
2021
View Paper

Comments (0)

This website uses cookies to ensure you get the best experience. Learn more