ArxivLens

Quick Summary:

This paper proposes an automated method for extracting extensible timeline templates from bitmap images using deep learning. The approach involves a multi-task neural network for parsing global and local timeline information, followed by a reconstruction pipeline to generate the template. Evaluations on synthesized and real-world datasets demonstrate the effectiveness of the method.

Journal Reference: TVCG2019
DOI: 10.1109/TVCG.2019.2934810
arXiv Id: 1907.13550
Comments: 10 pages, Automated Infographic Design, Deep Learning-based Approach, Timeline Infographics, Multi-task Model
Date Published: 2023-10-10
Date Updated: 2023-10-10

Categories:

Key Terms (TF-IDF):

templates (0.261)
automatically (0.211)
template (0.207)
stage (0.168)
extract (0.165)
reconstruction (0.161)
visual (0.160)
real world (0.146)
approach (0.142)
effectiveness (0.141)
end (0.136)
dataset (0.134)
information (0.134)
images (0.134)
world (0.134)
dl (0.127)
layout (0.127)
collect (0.123)
expert (0.122)
merging (0.118)
License: http://arxiv.org/licenses/nonexclusive-distrib/1.0/

Summary:

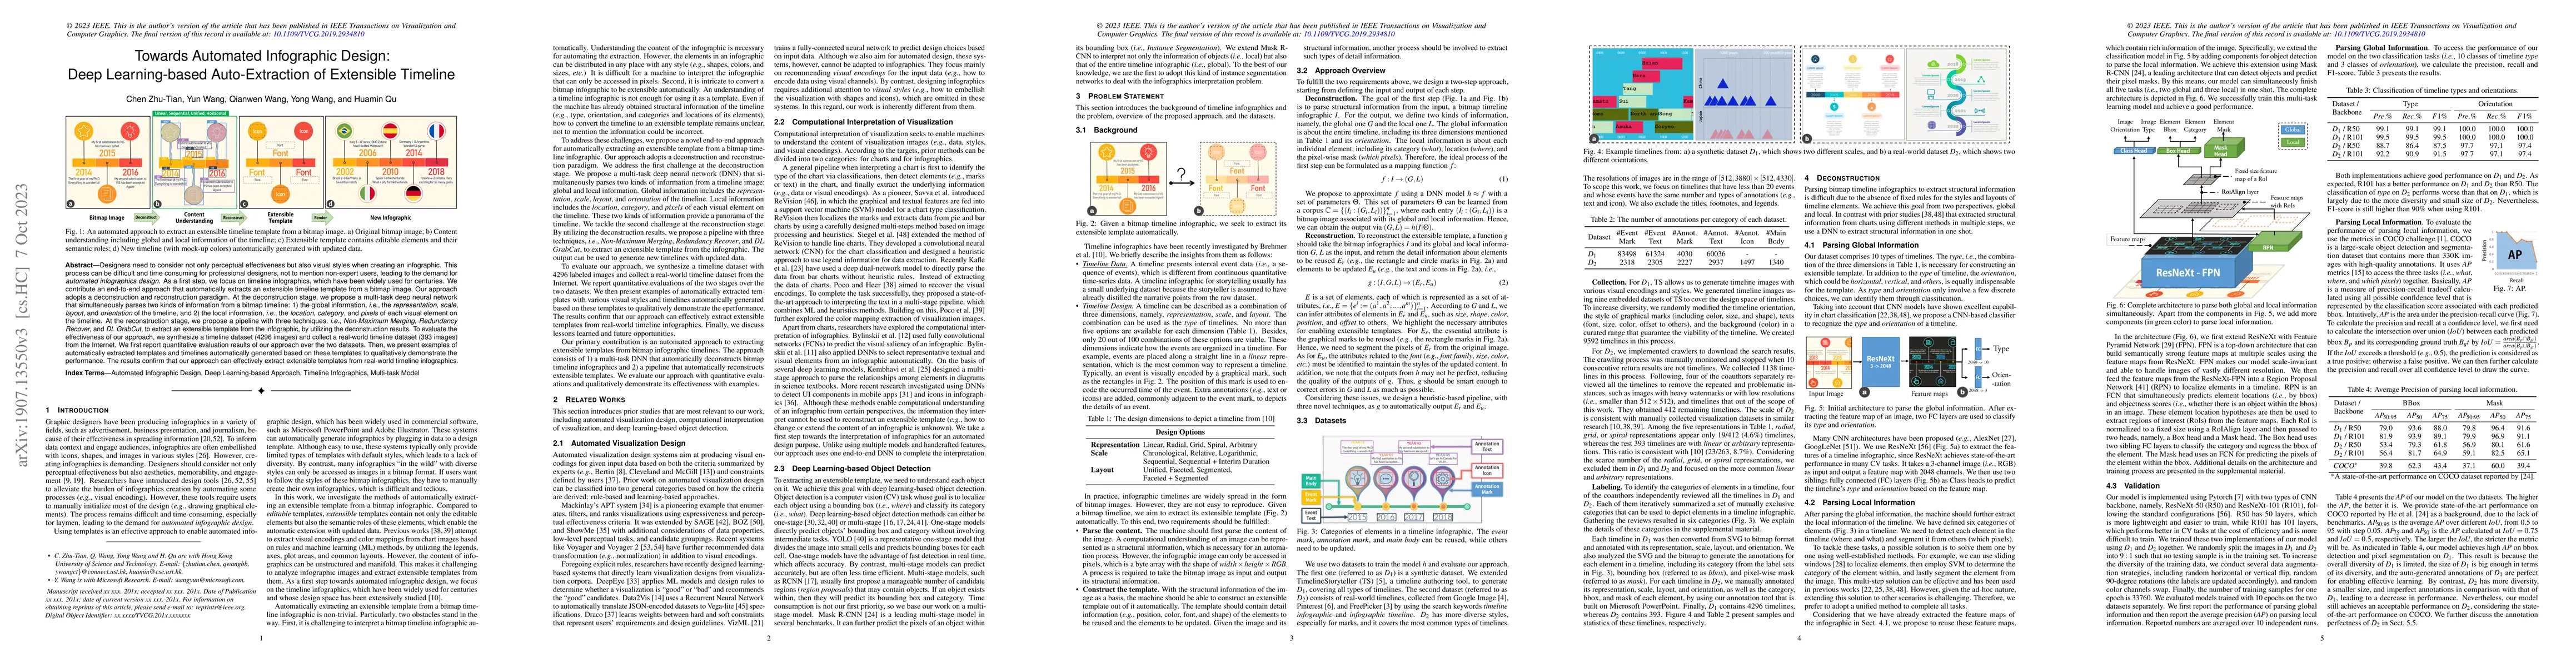
Designers need to consider not only perceptual effectiveness but also visual styles when creating an infographic. This process can be difficult and time consuming for professional designers, not to mention non-expert users, leading to the demand for automated infographics design. As a first step, we focus on timeline infographics, which have been widely used for centuries. We contribute an end-to-end approach that automatically extracts an extensible timeline template from a bitmap image. Our approach adopts a deconstruction and reconstruction paradigm. At the deconstruction stage, we propose a multi-task deep neural network that simultaneously parses two kinds of information from a bitmap timeline: 1) the global information, i.e., the representation, scale, layout, and orientation of the timeline, and 2) the local information, i.e., the location, category, and pixels of each visual element on the timeline. At the reconstruction stage, we propose a pipeline with three techniques, i.e., Non-Maximum Merging, Redundancy Recover, and DL GrabCut, to extract an extensible template from the infographic, by utilizing the deconstruction results. To evaluate the effectiveness of our approach, we synthesize a timeline dataset (4296 images) and collect a real-world timeline dataset (393 images) from the Internet. We first report quantitative evaluation results of our approach over the two datasets. Then, we present examples of automatically extracted templates and timelines automatically generated based on these templates to qualitatively demonstrate the performance. The results confirm that our approach can effectively extract extensible templates from real-world timeline infographics.

Citation & Reference Network Visualization

This graph shows how this paper is connected to other research. The current paper is shown in dark gray, papers that cite it are in green, and papers it references are in blue. You can:

Current Paper
Papers citing this work (Citations)
Papers cited by this work (References)

• Hover over any node to see the paper title

• Click a node to view that paper's details

• Drag nodes to rearrange the graph

• Use the zoom controls (bottom right) to zoom in/out

Citations and References

Title Authors Year Actions
ChartKG: A Knowledge-Graph-Based Representation for Chart Images
Zhiguang Zhou, Haoxuan Wang, Zhengqing Zhao, Fengling Zheng, Yongheng Wang, Wei Chen, Yong Wang
2024
View Paper
Natural Language Generation for Visualizations: State of the Art, Challenges and Future Directions
Enamul Hoque, Mohammed Saidul Islam
2024
View Paper
MapCraft: Dissecting and Designing Custom Geo-Infographics
Xinyuan Zhang, Yifan Xu, Kaiwen Li, Lingyun Yu, Yu Liu
2024
View Paper
Generalization of CNNs on Relational Reasoning with Bar Charts
Zhenxing Cui, Lu Chen, Yunhai Wang, D. Haehn, Yong Wang, Hanspeter Pfister
2024
View Paper
Automating Government Report Generation: A Generative AI Approach for Efficient Data Extraction, Analysis, and Visualization
Rajan Gupta, Gaurav Pandey, S. Pal
2024
View Paper
Manipulable Semantic Components: A Computational Representation of Data Visualization Scenes
Zhicheng Liu, Chen Chen, John Hooker
2024
View Paper
Datasets of Visualization for Machine Learning
Can Liu, Ruike Jiang, Shaocong Tan, Jiacheng Yu, Chaofan Yang, Hanning Shao, Xiaoru Yuan
2024
View Paper
AutoLegend: A User Feedback-Driven Adaptive Legend Generator for Visualizations
Can Liu, Xiyao Mei, Zhibang Jiang, Shaocong Tan, Xiaoru Yuan
2024
View Paper
Generative AI for Visualization: State of the Art and Future Directions
Yilin Ye, Jianing Hao, Yihan Hou, Zhan Wang, Shishi Xiao, Yuyu Luo, Wei Zeng
2024
View Paper
VisCollage: Annotative Collages for Organizing Data Event Charts
Xiao-han Li, Yi-Ting Hung, Jia-Yu Pan, Wen-Chieh Lin
2024
View Paper
A bibliometric exploration of infographics as tools for visual literacy in education
Paula Marcelle, Okan Arslan, A. Balogun, Monalisa Dash
2024
View Paper
Integration of infographics in higher education: challenges faced by novice creators
Evelina Jaleniauskiene, J. Kasperiūnienė
2024
View Paper
GraphiMind: LLM-centric Interface for Information Graphics Design
Qiruin Huang, Min Lu, J. Lanir, D. Lischinski, D. Cohen-Or, Hui Huang
2024
View Paper
Enabling Multimodal User Interactions for Genomics Visualization Creation
Qianwen Wang, Xiao Liu, Man Qing Liang, S. L’Yi, Nils Gehlenborg
2023
View Paper
VG: Automatic Grading of D3 Visualizations
Matthew Hull, Vivian Pednekar, Hannah Murray, Nimisha Roy, Emmanuel Tung, Susanta Routray, Connor Guerin, Justin Chen, Zijie J. Wang, Seongmin Lee, M. Roozbahani, Duen Horng Chau
2023
View Paper
Foundation Models Meet Visualizations: Challenges and Opportunities
Weikai Yang, Mengchen Liu, Zheng Wang, Shixia Liu
2023
View Paper
Where Are We So Far? Understanding Data Storytelling Tools from the Perspective of Human-AI Collaboration
Haotian Li, Yun Wang, Huamin Qu
2023
View Paper
AdaVis: Adaptive and Explainable Visualization Recommendation for Tabular Data
Songheng Zhang, Y. Wang, Haotian Li, Huamin Qu
2023
View Paper
Calliope-Net: Automatic Generation of Graph Data Facts via Annotated Node-Link Diagrams
Qing Chen, Nan Chen, W. Shuai, Guande Wu, Zhe Xu, H. Tong, Nana Cao
2023
View Paper
InvVis: Large-Scale Data Embedding for Invertible Visualization
Huayuan Ye, Chenhui Li, Yang Li, Changbo Wang
2023
View Paper
Mystique: Deconstructing SVG Charts for Layout Reuse
Chen Chen, Bongshin Lee, Yunhai Wang, Yunjeong Chang, Z. Liu
2023
View Paper
Re-understanding of data storytelling tools from a narrative perspective
Pengkun Ren, Yi Wang, Fan Zhao
2023
View Paper
The State of the Art in Creating Visualization Corpora for Automated Chart Analysis
Chen Chen, Zhicheng Liu
2023
View Paper
BlinkViz: Fast and Scalable Approximate Visualization on Very Large Datasets using Neural-Enhanced Mixed Sum-Product Networks
Yimeng Qiao, Yinan Jing, Hanbing Zhang, Zhenying He, Kai Zhang, Xiaoyang Sean Wang
2023
View Paper
Let the Chart Spark: Embedding Semantic Context into Chart with Text-to-Image Generative Model
Shishi Xiao, Suizi Huang, Yue Lin, Yilin Ye, Weizhen Zeng
2023
View Paper
How Can Deep Neural Networks Aid Visualization Perception Research? Three Studies on Correlation Judgments in Scatterplots
Fumeng Yang, Yuxin Ma, Lane Harrison, J. Tompkin, D. Laidlaw
2023
View Paper
Who Do We Mean When We Talk About Visualization Novices?
Alyxander Burns, C. Lee, Ria Chawla, Evan M. Peck, Narges Mahyar
2023
View Paper
viz2viz: Prompt-driven stylized visualization generation using a diffusion model
Jiaqi Wu, John Joon Young Chung, Eytan Adar
2023
View Paper
Reinforced Labels: Multi-Agent Deep Reinforcement Learning for Point-Feature Label Placement
P. Bobák, Ladislav Čmolík, Martin Čadík
2023
View Paper
VISAtlas: An Image-Based Exploration and Query System for Large Visualization Collections via Neural Image Embedding
Yilin Ye, Rong Huang, Weizhen Zeng
2022
View Paper
Knowledge-Decks: Automatically Generating Presentation Slide Decks of Visual Analytics Knowledge Discovery Applications
L. Christino, Taylor Hill, F. Paulovich
2022
View Paper
GraphDecoder: Recovering Diverse Network Graphs From Visualization Images via Attention-Aware Learning
Sicheng Song, Chenhui Li, Dong Li, Juntong Chen, Changbo Wang
2022
View Paper
AskYourDB: An end-to-end system for querying and visualizing relational databases using natural language
Manu Joseph, Harsh Raj, Anubhav Yadav, Aaryaman Sharma
2022
View Paper
Supporting Expressive and Faithful Pictorial Visualization Design with Visual Style Transfer
Yang Shi, Pei Liu, Siji Chen, Mengdi Sun, Nan Cao
2022
View Paper
Sporthesia: Augmenting Sports Videos Using Natural Language
Zhutian Chen, Qisen Yang, Xiao Xie, Johanna Beyer, Haijun Xia, Yingnian Wu, H. Pfister
2022
View Paper
How Does Automation Shape the Process of Narrative Visualization: A Survey of Tools
Qing Chen, Shixiong Cao, Jiazhe Wang, Nan Cao
2022
View Paper
Chart Question Answering: State of the Art and Future Directions
Enamul Hoque, P. Kavehzadeh, Ahmed Masry
2022
View Paper
CrossData: Leveraging Text-Data Connections for Authoring Data Documents
Zhutian Chen, Haijun Xia
2022
View Paper
Infographics Wizard: Flexible Infographics Authoring and Design Exploration
Anjul Tyagi, J. Zhao, Pushkar Patel, Swasti Khurana, Klaus Mueller
2022
View Paper
ComputableViz: Mathematical Operators as a Formalism for Visualisation Processing and Analysis
Aoyu Wu, Wai Tong, Haotian Li, Dominik Moritz, Yong Wang, Huamin Qu
2022
View Paper
Roslingifier: Semi-Automated Storytelling for Animated Scatterplots
Minjeong Shin, Joohee Kim, Yunha Han, Lexing Xie, M. Whitelaw, Bum Chul Kwon, Sungahn Ko, N. Elmqvist
2022
View Paper
ChartText: Linking Text with Charts in Documents
J. Pinheiro, Jorge Poco
2022
View Paper
Graph Interpretation, Summarization and Visualization Techniques: A Review and Open Research Issues
P. Mishra, Santosh Kumar, M. K. Chaube
2022
View Paper
Graph-Based Information Block Detection in Infographic with Gestalt Organization Principles
Jie Lin, Yi Cai, Xin Wu, Jianwei Lu
2021
View Paper
A Mixed-Initiative Approach to Reusing Infographie Charts
Weiwei Cui, Jinpeng Wang, He Huang, Yun Wang, Chin-Yew Lin, Haidong Zhang, Dongmei Zhang
2021
View Paper
Visual Design Reuse Through Style Recognition and Transfer
Jeremy Warner
2021
View Paper
Evaginating scientific charts: Recovering direct and derived information encodings from chart images
P. Mishra, Santosh Kumar, M. K. Chaube
2021
View Paper
Augmenting Sports Videos with VisCommentator
Zhutian Chen, Shuainan Ye, Xiangtong Chu, Haijun Xia, Hui Zhang, Huamin Qu, Yingcai Wu
2021
View Paper
Towards Natural Language Interfaces for Data Visualization: A Survey
Leixian Shen, Enya Shen, Yuyu Luo, Xiaocong Yang, Xuming Hu, Xiongshuai Zhang, Zhiwei Tai, Jianmin Wang
2021
View Paper
User-Centric Semi-Automated Infographics Authoring and Recommendation
Anjul Tyagi, Jian Zhao, Pushkar Patel, Swasti Khurana, Klaus Mueller
2021
View Paper
KG4Vis: A Knowledge Graph-Based Approach for Visualization Recommendation
Haotian Li, Yong Wang, Songheng Zhang, Yangqiu Song, Huamin Qu
2021
View Paper
MultiVision: Designing Analytical Dashboards with Deep Learning Based Recommendation
Aoyu Wu, Yun Wang, Mengyu Zhou, Xinyi He, Haidong Zhang, Huamin Qu, Dongmei Zhang
2021
View Paper
Designing With Pictographs: Envision Topics Without Sacrificing Understanding
Alyxander Burns, Cindy Xiong, S. Franconeri, A. Cairo, Narges Mahyar
2021
View Paper
Animated Presentation of Static Infographics with InfoMotion
Yun Wang, Yi Gao, R. Huang, Weiwei Cui, Haidong Zhang, Dongmei Zhang
2021
View Paper
Information Block Detection in Infographic Based on Spatial Proximity and Structural Similarity (Student Abstract)
Jie Lin, Xin Wu, Jianwei Lu, Yi Cai
2021
View Paper
Automatic Generation of Unit Visualization-based Scrollytelling for Impromptu Data Facts Delivery
Junhua Lu, Wei Chen, Hui Ye, Jie Wang, Honghui Mei, Yuhui Gu, Yingcai Wu, X. Zhang, K. Ma
2021
View Paper
Learning Multimodal Affinities for Textual Editing in Images
Or Perel, Oron Anschel, Omri Ben-Eliezer, Shai Mazor, Hadar Averbuch-Elor
2021
View Paper
InfoColorizer: Interactive Recommendation of Color Palettes for Infographics
Linping Yuan, Ziqi Zhou, Jian Zhao, Yiqiu Guo, F. Du, Huamin Qu
2021
View Paper
AI4VIS: Survey on Artificial Intelligence Approaches for Data Visualization
Aoyu Wu, Yun Wang, Xinhuan Shu, Dominik Moritz, Weiwei Cui, Haidong Zhang, Dongmei Zhang, Huamin Qu
2021
View Paper
Preparing Infographics for Post-publication Promotion of Research on Social Media
M. Joshi, Latika Gupta
2021
View Paper
Learning to Automate Chart Layout Configurations Using Crowdsourced Paired Comparison
Aoyu Wu, Liwenhan Xie, Bongshin Lee, Yun Wang, Weiwei Cui, Huamin Qu
2021
View Paper
A Survey on ML4VIS: Applying Machine Learning Advances to Data Visualization
Qianwen Wang, Zhutian Chen, Yong Wang, Huamin Qu
2020
View Paper
Applying Machine Learning Advances to Data Visualization: A Survey on ML4VIS
Qianwen Wang, Zhutian Chen, Yong Wang, Huamin Qu
2020
View Paper
Chartem: Reviving Chart Images with Data Embedding
Jiayun Fu, B. Zhu, Weiwei Cui, Song Ge, Yun Wang, Haidong Zhang, He Huang, Yuanyuan Tang, Dongmei Zhang, Xiaojing Ma
2020
View Paper
A survey on automatic infographics and visualization recommendations
Sujia Zhu, Guodao Sun, Qi Jiang, Meng Zha, Ronghua Liang
2020
View Paper
Visualization Research Lab at HKUST
Yong Wang
2020
View Paper
Retrieve-Then-Adapt: Example-based Automatic Generation for Proportion-related Infographics
Chunyao Qian, Shizhao Sun, Weiwei Cui, Jian-Guang Lou, Haidong Zhang, Dongmei Zhang
2020
View Paper
Composition and Configuration Patterns in Multiple-View Visualizations
Xi Chen, Wei Zeng, Yanna Lin, H. Al-Maneea, Jonathan Roberts, Remco Chang
2020
View Paper
Infomages: Embedding Data into Thematic Images
Darius Coelho, Klaus Mueller
2020
View Paper
Chart Mining: A Survey of Methods for Automated Chart Analysis
Kenny Davila, Srirangaraj Setlur, D. Doermann, Urala Kota Bhargava, V. Govindaraju
2020
View Paper
Exploring Visual Information Flows in Infographics
Min Lu, Chufeng Wang, J. Lanir, Nanxuan Zhao, H. Pfister, D. Cohen-Or, Hui Huang
2020
View Paper
DataQuilt: Extracting Visual Elements from Images to Craft Pictorial Visualizations
J. Zhang, N. Sultanum, A. Bezerianos, Fanny Chevalier
2020
View Paper
Augmenting Static Visualizations with PapARVis Designer
Zhutian Chen, Wai-Shun Tong, Qianwen Wang, B. Bach, Huamin Qu
2020
View Paper
Infographics Wizard: Flexible Infographics Authoring and Design Exploration
Tobias Schreck
2022
View Paper
Survey on Artificial Intelligence Approaches for Visualization Data
Aoyu Wu, Yun Wang, Xinhuan Shu, Dominik Moritz, Weiwei Cui, Haidong Zhang, Dongmei Zhang, Huamin Qu
2021
View Paper
Exploring Visualization Implementation Challenges Faced by D3 Users Online
L. Battle, Danni Feng, Kelli Webber
2021
View Paper

Comments (0)

This website uses cookies to ensure you get the best experience. Learn more