CloudDet: Interactive Visual Analysis of Anomalous Performances in Cloud Computing Systems
Publication
Metrics
AI Quick Summary
This paper presents CloudDet, a visual analytics system to detect, inspect, and diagnose anomalies in cloud computing systems through interactive visualization of multivariate time series data.
Paper Preview
Abstract
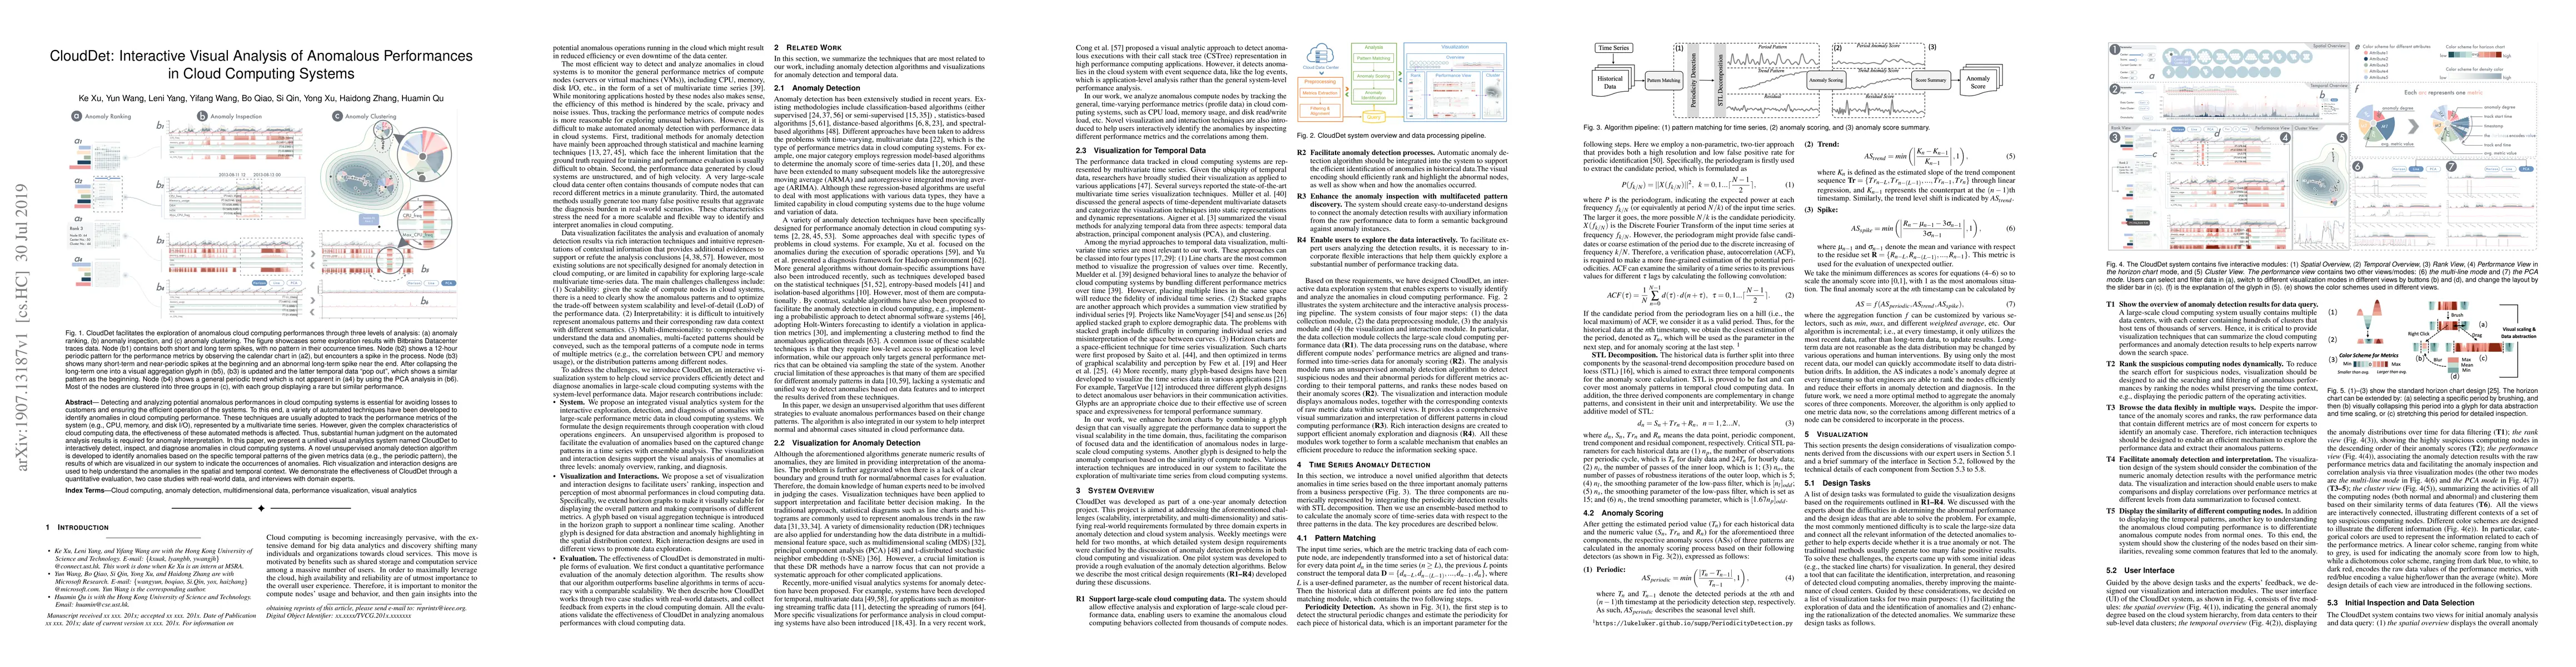
Detecting and analyzing potential anomalous performances in cloud computing systems is essential for avoiding losses to customers and ensuring the efficient operation of the systems. To this end, a variety of automated techniques have been developed to identify anomalies in cloud computing performance. These techniques are usually adopted to track the performance metrics of the system (e.g., CPU, memory, and disk I/O), represented by a multivariate time series. However, given the complex characteristics of cloud computing data, the effectiveness of these automated methods is affected. Thus, substantial human judgment on the automated analysis results is required for anomaly interpretation. In this paper, we present a unified visual analytics system named CloudDet to interactively detect, inspect, and diagnose anomalies in cloud computing systems. A novel unsupervised anomaly detection algorithm is developed to identify anomalies based on the specific temporal patterns of the given metrics data (e.g., the periodic pattern), the results of which are visualized in our system to indicate the occurrences of anomalies. Rich visualization and interaction designs are used to help understand the anomalies in the spatial and temporal context. We demonstrate the effectiveness of CloudDet through a quantitative evaluation, two case studies with real-world data, and interviews with domain experts.
AI Key Findings
Get AI-generated insights about this paper's methodology, results, significance, and more — seven facets brought into focus.
Impact
Paper Details
PDF Preview
Key Terms
Citation Network
Current paper (gray), citations (green), references (blue)
Display is limited for performance on very large graphs.
Discussion 0