Prismatic: Interactive Multi-View Cluster Analysis of Concept Stocks
Publication
Metrics
AI Quick Summary
Prismatic is a visual analytics system designed to facilitate interactive multi-view cluster analysis of concept stocks by integrating quantitative and qualitative data. It employs dynamic cluster generation, knowledge-based exploration, and correlation-based validation to provide nuanced insights into business correlations, validated through case studies and expert feedback.
Paper Preview
Abstract
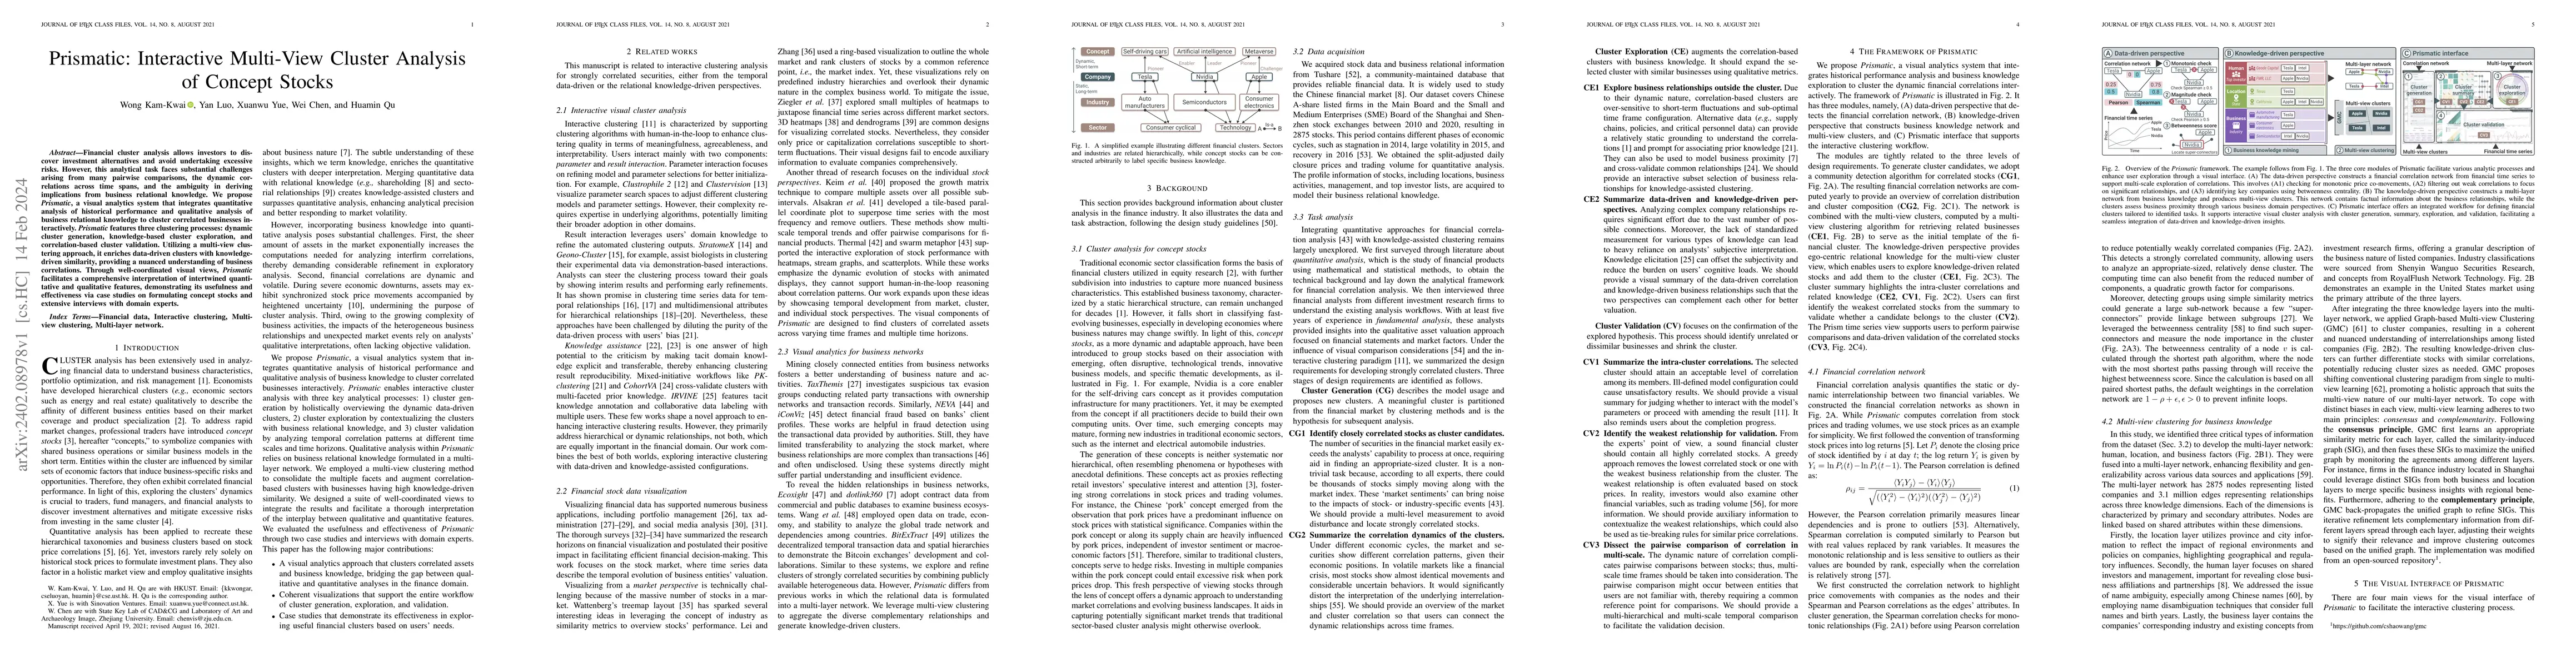
Financial cluster analysis allows investors to discover investment alternatives and avoid undertaking excessive risks. However, this analytical task faces substantial challenges arising from many pairwise comparisons, the dynamic correlations across time spans, and the ambiguity in deriving implications from business relational knowledge. We propose Prismatic, a visual analytics system that integrates quantitative analysis of historical performance and qualitative analysis of business relational knowledge to cluster correlated businesses interactively. Prismatic features three clustering processes: dynamic cluster generation, knowledge-based cluster exploration, and correlation-based cluster validation. Utilizing a multi-view clustering approach, it enriches data-driven clusters with knowledge-driven similarity, providing a nuanced understanding of business correlations. Through well-coordinated visual views, Prismatic facilitates a comprehensive interpretation of intertwined quantitative and qualitative features, demonstrating its usefulness and effectiveness via case studies on formulating concept stocks and extensive interviews with domain experts.
AI Key Findings
Get AI-generated insights about this paper's methodology, results, significance, and more — seven facets brought into focus.
Impact
Paper Details
Authors
PDF Preview
Key Terms
Citation Network
Current paper (gray), citations (green), references (blue)
Display is limited for performance on very large graphs.
Discussion 0