Quick Summary:

DMiner proposes a data-driven method for mining design rules from existing dashboards to automate their organization, focusing on arrangement and coordination of visualizations. The results show that the recommender can achieve human-level performance in automating dashboard design.

Summary

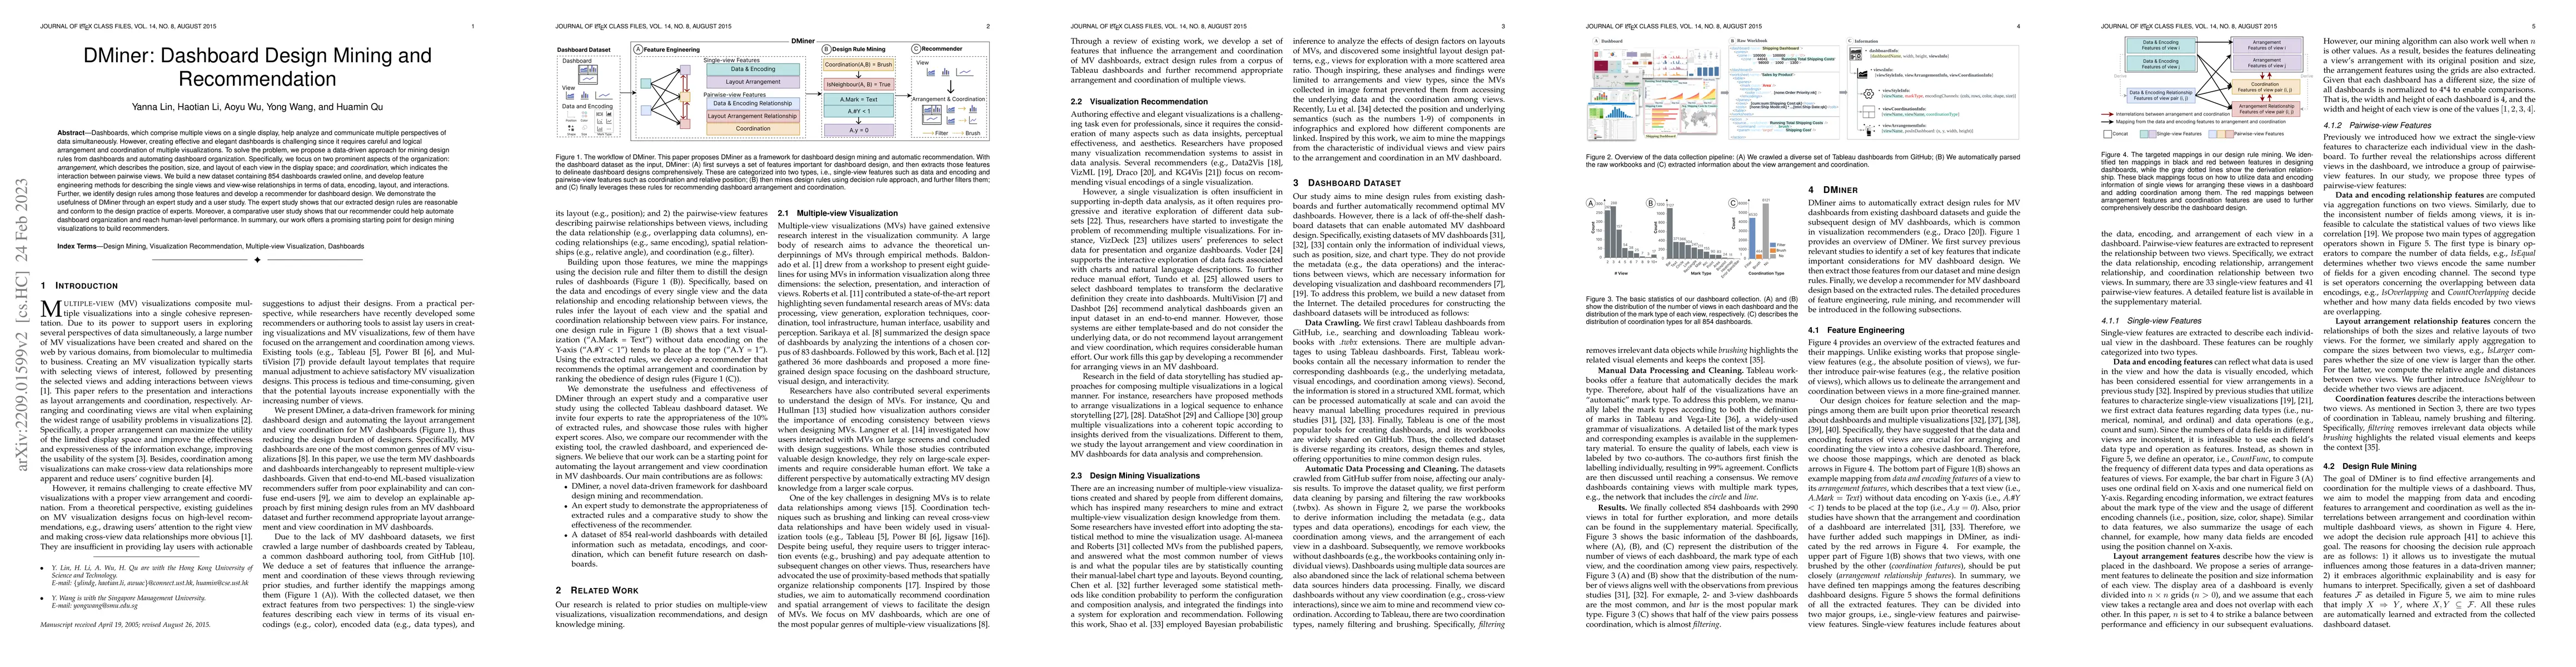
Dashboards, which comprise multiple views on a single display, help analyze and communicate multiple perspectives of data simultaneously. However, creating effective and elegant dashboards is challenging since it requires careful and logical arrangement and coordination of multiple visualizations. To solve the problem, we propose a data-driven approach for mining design rules from dashboards and automating dashboard organization. Specifically, we focus on two prominent aspects of the organization: arrangement, which describes the position, size, and layout of each view in the display space; and coordination, which indicates the interaction between pairwise views. We build a new dataset containing 854 dashboards crawled online, and develop feature engineering methods for describing the single views and view-wise relationships in terms of data, encoding, layout, and interactions. Further, we identify design rules among those features and develop a recommender for dashboard design. We demonstrate the usefulness of DMiner through an expert study and a user study. The expert study shows that our extracted design rules are reasonable and conform to the design practice of experts. Moreover, a comparative user study shows that our recommender could help automate dashboard organization and reach human-level performance. In summary, our work offers a promising starting point for design mining visualizations to build recommenders.

AI Key Findings

Get AI-generated insights about this paper's methodology, results, and significance.

Paper Details

PDF Preview

Download PDF

Key Terms

views (0.237)
recommender (0.210)
layout (0.205)
rules (0.205)
expert (0.196)
mining (0.195)
coordination (0.190)
design (0.190)
display (0.178)
build (0.152)
help (0.147)
user (0.146)
view (0.144)
multiple (0.142)
develop (0.123)
shows (0.119)
logical (0.117)
usefulness (0.116)
pairwise (0.116)
starting point (0.116)

Citation Network

Current paper (gray), citations (green), references (blue)

Current Paper
Citations
References
Click to view

Similar Papers

Found 4 papers
Title Authors Year Actions
InterLink: Linking Text with Code and Output in Computational Notebooks
Yanna Lin, Leni Yang, Haotian Li, Huamin Qu, Dominik Moritz
2025
View Paper
NoteFlow: Recommending Charts as Sight Glasses for Tracing Data Flow in Computational Notebooks
Yuan Tian, Dazhen Deng, Sen Yang, Huawei Zheng, Bowen Shi, Kai Xiong, Xinjing Yi, Yingcai Wu
2025
View Paper
Designing Spatial Visualization and Interactions of Immersive Sankey Diagram in Virtual Reality
Yang Lu, Junxian Li, Zhitong Cui, Jiapeng Hu, Yanna Lin, Shijian Luo
2024
View Paper
RSVP for VPSA : A Meta Design Study on Rapid Suggestive Visualization Prototyping for Visual Parameter Space Analysis
Manfred Klaffenboeck, Michael Gleicher, Johannes Sorger, Michael Wimmer, Torsten Moeller
2024
View Paper
The Effects of Layout Order on Interface Complexity: An Eye-Tracking Study for Dashboard Design
Nuowen Zhang, Jing Zhang, Shangsong Jiang, Wei Ge
2024
View Paper
From Data to Story: Towards Automatic Animated Data Video Creation with LLM-Based Multi-Agent Systems
Leixian Shen, Haotian Li, Yun Wang, Huamin Qu
2024
View Paper
PyGWalker: On-the-fly Assistant for Exploratory Visual Data Analysis
Yue Yu, Leixian Shen, Fei Long, Huamin Qu, Hao Chen
2024
View Paper
RemixTape: Enriching Narratives about Metrics with Semantic Alignment and Contextual Recommendation
Matthew Brehmer, Margaret Drouhard, Arjun Srinivasan
2024
View Paper
VisCollage: Annotative Collages for Organizing Data Event Charts
Xiao-han Li, Yi-Ting Hung, Jia-Yu Pan, Wen-Chieh Lin
2024
View Paper
Visualization for Human-Centered AI Tools
Md. Naimul Hoque, Sungbok Shin, Niklas Elmqvist
2024
View Paper
LEVA: Using Large Language Models to Enhance Visual Analytics
Yuheng Zhao, Yixing Zhang, Yu Zhang, Xinyi Zhao, Junjie Wang, Zekai Shao, C. Turkay, Siming Chen
2024
View Paper
Where Are We So Far? Understanding Data Storytelling Tools from the Perspective of Human-AI Collaboration
Haotian Li, Yun Wang, Huamin Qu
2023
View Paper
AdaVis: Adaptive and Explainable Visualization Recommendation for Tabular Data
Songheng Zhang, Y. Wang, Haotian Li, Huamin Qu
2023
View Paper
OldVisOnline: Curating a Dataset of Historical Visualizations
Yu Zhang, Ruike Jiang, Liwenhan Xie, Yuheng Zhao, Can Liu, Tianhong Ding, Siming Chen, Xiaoru Yuan
2023
View Paper
Data Player: Automatic Generation of Data Videos with Narration-Animation Interplay
Leixian Shen, Yizhi Zhang, Haidong Zhang, Yun Wang
2023
View Paper
InkSight: Leveraging Sketch Interaction for Documenting Chart Findings in Computational Notebooks
Yanna Lin, Haotian Li, Leni Yang, Aoyu Wu, Huamin Qu
2023
View Paper
Notable: On-the-fly Assistant for Data Storytelling in Computational Notebooks
Haotian Li, Lu Ying, Haidong Zhang, Yingcai Wu, Huamin Qu, Yun Wang
2023
View Paper
Studying Parallel Coordinates Under Varying Aspect Ratios
Leon Meka, Mirjam Kronsteiner, Johanna Schmidt
2025
View Paper
BOLT: A Natural Language Interface for Dashboard Authoring
Arjun Srinivasan, V. Setlur
2023
View Paper

Comments (0)

This website uses cookies to ensure you get the best experience. Learn more