ArxivLens

Quick Summary:

This paper proposes heuristics for designing cooperative dashboards that facilitate analytical conversations, moving beyond traditional visual design guidelines. The authors' approach, tested with graduate students, reveals that these heuristics enhance the design process by encouraging more fluid, supportive, and responsive dashboards.

arXiv Id: 2308.04514
Comments: 11 pages, 3 figures, 3 tables
Date Published: 2023-08-10
Date Updated: 2023-08-10

Categories:

Key Terms (TF-IDF):

cooperative (0.272)
analytical (0.234)
design (0.221)
principles (0.185)
support (0.158)
repair (0.152)
reporting (0.138)
interactive (0.135)
freely (0.134)
evolved (0.133)
practices (0.132)
goals (0.132)
assignment (0.130)
students (0.130)
displays (0.129)
style (0.129)
refinement (0.128)
participants (0.127)
reasons (0.123)
query (0.123)
License: http://creativecommons.org/licenses/by/4.0/

Summary:

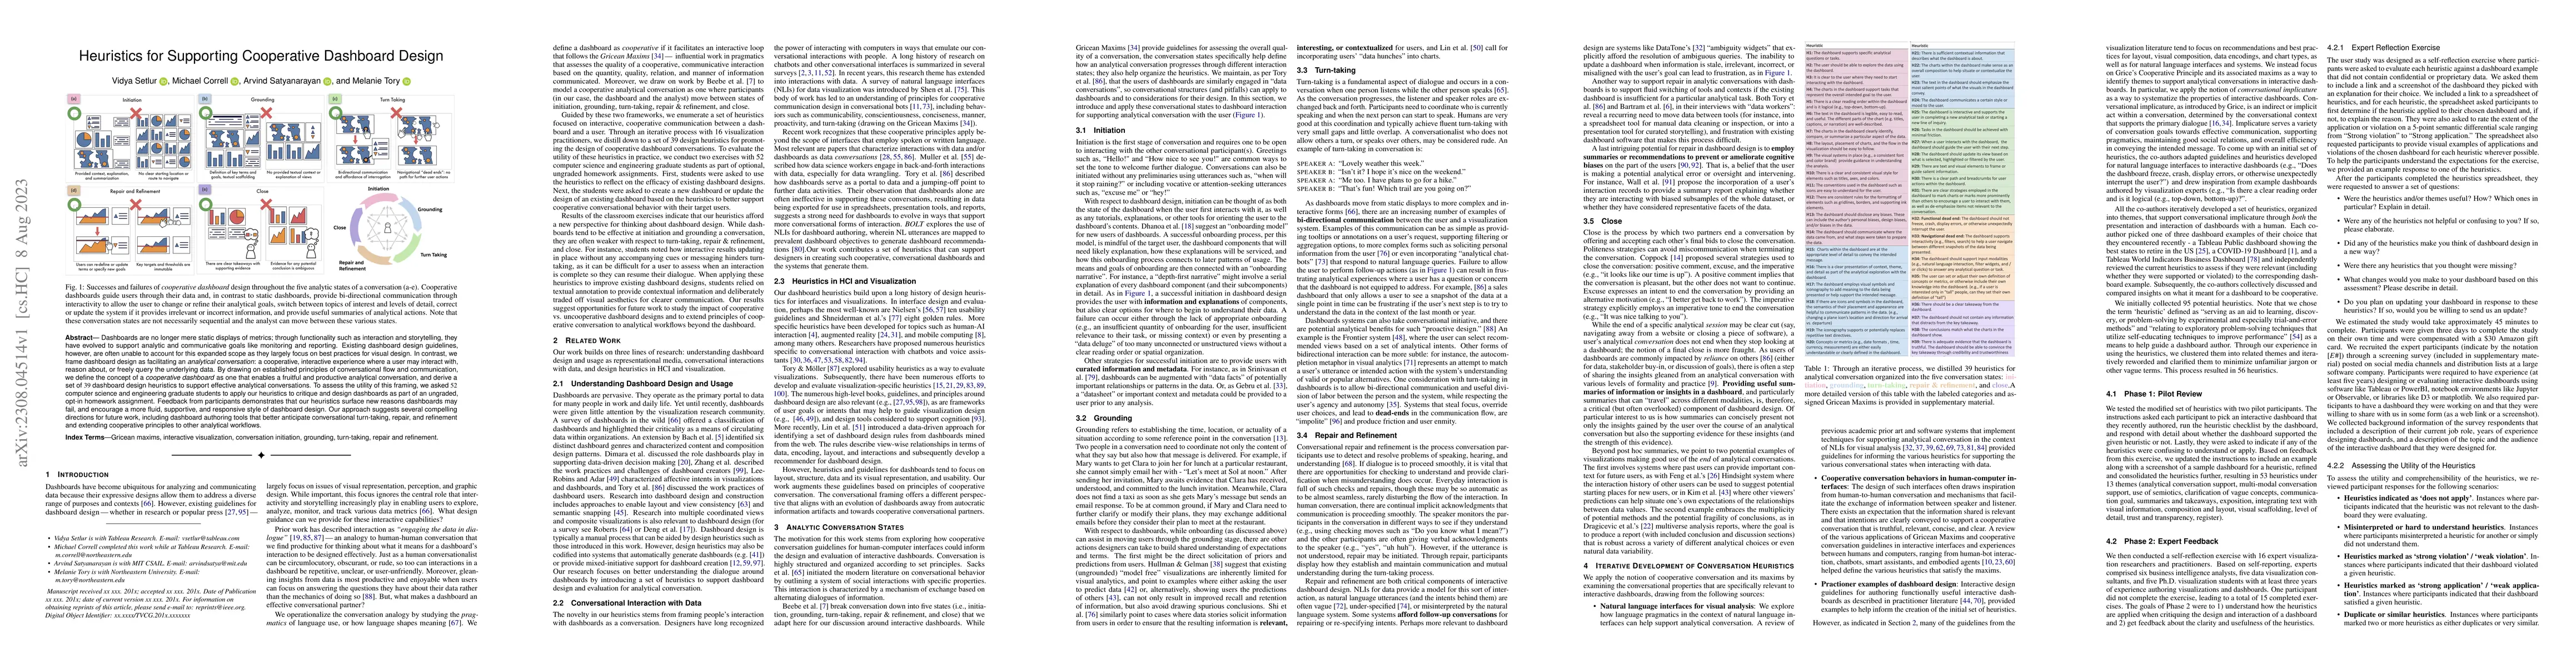
Dashboards are no longer mere static displays of metrics; through functionality such as interaction and storytelling, they have evolved to support analytic and communicative goals like monitoring and reporting. Existing dashboard design guidelines, however, are often unable to account for this expanded scope as they largely focus on best practices for visual design. In contrast, we frame dashboard design as facilitating an analytical conversation: a cooperative, interactive experience where a user may interact with, reason about, or freely query the underlying data. By drawing on established principles of conversational flow and communication, we define the concept of a cooperative dashboard as one that enables a fruitful and productive analytical conversation, and derive a set of 39 dashboard design heuristics to support effective analytical conversations. To assess the utility of this framing, we asked 52 computer science and engineering graduate students to apply our heuristics to critique and design dashboards as part of an ungraded, opt-in homework assignment. Feedback from participants demonstrates that our heuristics surface new reasons dashboards may fail, and encourage a more fluid, supportive, and responsive style of dashboard design. Our approach suggests several compelling directions for future work, including dashboard authoring tools that better anticipate conversational turn-taking, repair, and refinement and extending cooperative principles to other analytical workflows.

Citation & Reference Network Visualization

This graph shows how this paper is connected to other research. The current paper is shown in dark gray, papers that cite it are in green, and papers it references are in blue. You can:

Current Paper
Papers citing this work (Citations)
Papers cited by this work (References)

• Hover over any node to see the paper title

• Click a node to view that paper's details

• Drag nodes to rearrange the graph

• Use the zoom controls (bottom right) to zoom in/out

Citations and References

Title Authors Year Actions
Plume: Scaffolding Text Composition in Dashboards
Maxim Lisnic, V. Setlur, N. Sultanum
2025
View Paper
EduGuard RetainX: An advanced analytical dashboard for predicting and improving student retention in tertiary education
Nornina J. Dia, Joseph C. Sieras, Suhaina A. Khalid, Amer Hussien T. Macatotong, Jeffrey M. Mondejar, Elizabeth R. Genotiva, Reymark D. Delena
2025
View Paper
Charting EDA: Characterizing Interactive Visualization Use in Computational Notebooks with a Mixed-Methods Formalism
Dylan Wootton, Amy Rae Fox, Evan Peck, Arvind Satyanarayan
2024
View Paper
From Instruction to Insight: Exploring the Functional and Semantic Roles of Text in Interactive Dashboards
N. Sultanum, V. Setlur
2024
View Paper
“I Came Across a Junk”: Understanding Design Flaws of Data Visualization from the Public's Perspective
Xingyu Lan, Yu Liu
2024
View Paper
Development of a Real-Time Dashboard for Overdose Touchpoints: User-Centered Design Approach
Amey A. Salvi, Logan A. Gillenwater, B. Cockrum, Sarah E Wiehe, Kaitlyn Christian, John Cayton, Timothy Bailey, Katherine Schwartz, Allyson L Dir, Bradley Ray, M. Aalsma, Khairi Reda
2024
View Paper
Studying Parallel Coordinates Under Varying Aspect Ratios
Leon Meka, Mirjam Kronsteiner, Johanna Schmidt
2025
View Paper
A Systematic Review of Visualization Recommendation Systems: Goals, Strategies, Interfaces, and Evaluations
Zehua Zeng, Leilani Battle
2024
View Paper
Cooperative Design of a Dashboard for Monitoring the P4D Cohort Study on Major Depression
H. Maharlou, N. Bössel-Debbert, M. Lucht, H. B. Maier, S. Mücke, F. Müntefering, B. Neuhaus, J. Prokein, Ch. Reif-Leonhard, J. Voges, H. Weber, A. Weihs, H. Frieling, S. Oeltze-Jafra
View Paper

Similar Papers

Dashboard Design Patterns

Min Chen, Cagatay Turkay, Alfie Abdul-Rahman, Benjamin Bach, Saiful Khan, Euan Freeman, Yulei Fan

Published: 2022-08-25

DMiner: Dashboard Design Mining and Recommendation

Huamin Qu, Yong Wang, Haotian Li, Aoyu Wu, Yanna Lin

Published: 2023-07-04

Comments (0)

This website uses cookies to ensure you get the best experience. Learn more