ArxivLens

Quick Summary:

This paper presents eight groups of design patterns for dashboards, derived from a systematic review of 144 examples, to guide designers in making informed decisions. The study complements previous surveys by providing structured design solutions and discussing tradeoffs, supported by a workshop with 23 participants.

Journal Reference: Transactions on Visualization and Computer Graphics (2023)
arXiv Id: 2205.00757
Comments: Accepted by the IEEE VIS conference (Oklahoma City, OK), 2022. Best Paper Honorable Mention
Date Published: 2022-08-25
Date Updated: 2022-08-25

Categories:

Key Terms (TF-IDF):

design (0.289)
patterns (0.263)
guidance (0.246)
discuss (0.176)
common (0.172)
processes (0.162)
github io (0.149)
io (0.145)
descriptions (0.143)
case studies (0.143)
paper introduces (0.141)
participants (0.140)
combinations (0.139)
creation (0.135)
surveys (0.135)
evaluations (0.135)
designs (0.134)
decisions (0.133)
working (0.131)
surprisingly (0.131)
License: http://arxiv.org/licenses/nonexclusive-distrib/1.0/

Summary:

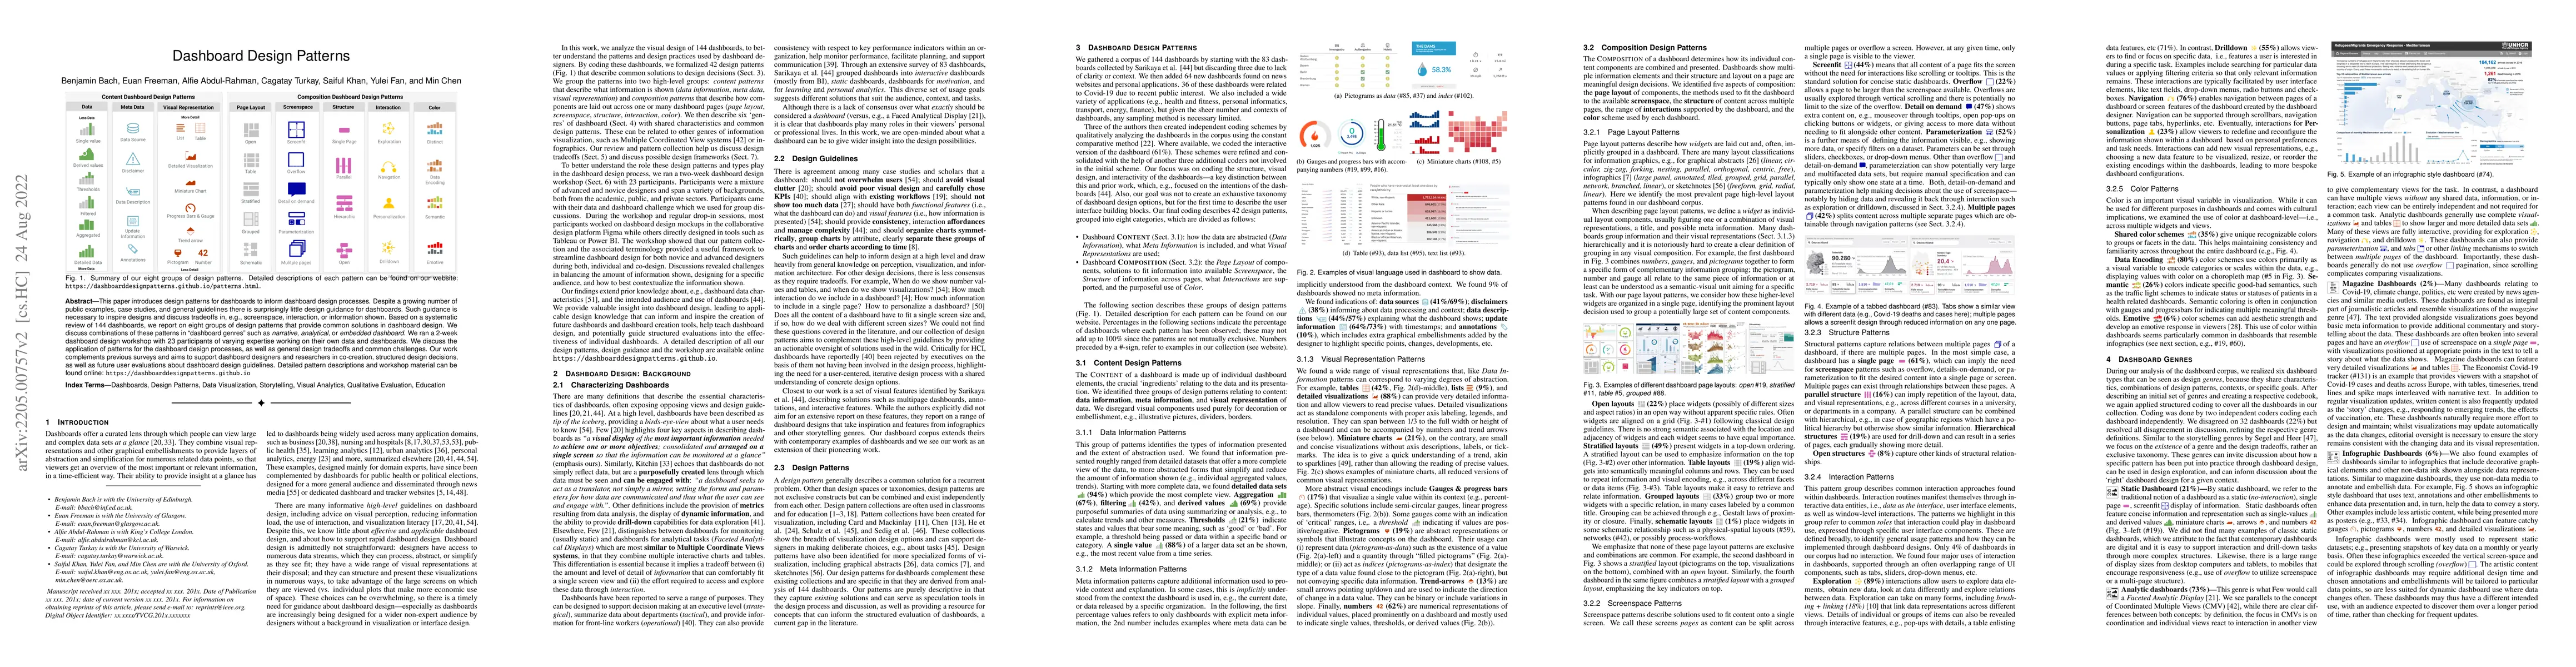
This paper introduces design patterns for dashboards to inform dashboard design processes. Despite a growing number of public examples, case studies, and general guidelines there is surprisingly little design guidance for dashboards. Such guidance is necessary to inspire designs and discuss tradeoffs in, e.g., screenspace, interaction, or information shown. Based on a systematic review of 144 dashboards, we report on eight groups of design patterns that provide common solutions in dashboard design. We discuss combinations of these patterns in dashboard genres such as narrative, analytical, or embedded dashboard. We ran a 2-week dashboard design workshop with 23 participants of varying expertise working on their own data and dashboards. We discuss the application of patterns for the dashboard design processes, as well as general design tradeoffs and common challenges. Our work complements previous surveys and aims to support dashboard designers and researchers in co-creation, structured design decisions, as well as future user evaluations about dashboard design guidelines. Detailed pattern descriptions and workshop material can be found online: https://dashboarddesignpatterns.github.io

Citation & Reference Network Visualization

This graph shows how this paper is connected to other research. The current paper is shown in dark gray, papers that cite it are in green, and papers it references are in blue. You can:

Current Paper
Papers citing this work (Citations)
Papers cited by this work (References)

• Hover over any node to see the paper title

• Click a node to view that paper's details

• Drag nodes to rearrange the graph

• Use the zoom controls (bottom right) to zoom in/out

Citations and References

Title Authors Year Actions
Behavioural Indicators of Usability in Visual Analytics Dashboards
M. Alhamadi, Hatim Alsayahani, Sarah Clinch, Markel Vigo
2025
View Paper
A methodology for the systematic design of storytelling dashboards applied to Industry 4.0
Ana Lavalle, A. Maté, Maribel Yasmina Santos, Pedro Guimarães, Juan Trujillo, A. Santos
2025
View Paper
Analysis of The Influence of User Interface (UI) and User Experience (UX) on Big Data Websites on Administrative Dashboard Function Interest (Mediahub Case Study)
Frenkie Tan, Muhamad Dody, Firmansyah
2024
View Paper
Systems Policy Analysis for Antimicrobial Resistance Targeted Action (SPAARTA): A Research Protocol
Raheelah Ahmad, Nina Zhu, Rishabh Jain, Jyoti Joshi, M. Mpundu, Paola Amigo Gutierrez, Alison Holmes, Tillman Weyde, R. Atun
2024
View Paper
Toward Guidelines for Designing Holistic Integrated Information Visualizations for Time-Critical Contexts: Systematic Review
Ahmed Mohammed Patel, Weston Baxter, Talya Porat
2024
View Paper
Challenges and Opportunities for Tool Adoption in Industrial UX Research Collaborations
Daye Kang, Jeffrey M. Rzeszotarski
2024
View Paper
Reflections on interactive visualization of electronic health records: past, present, future
Alessio Arleo, Annie T. Chen, David Gotz, Swaminathan Kandaswamy, Jürgen Bernard
2024
View Paper
Drillboards: Adaptive Visualization Dashboards for Dynamic Personalization of Visualization Experiences
Sungbok Shin, Inyoup Na, Niklas Elmqvist
2024
View Paper
Portfolio Evolution Analysis for SPL Scoping: Unveiling the dynamics with dedicated time-series dashboards
Raul Medeiros, Oscar Díaz, Mustafa Al-Hajjaji, Michael Schulze
2024
View Paper
Unlocking Potential: Analyzing the Content, Style, Structure, and Interactivity of Mesonets as Operational Dashboards
Savannah Olivas, Jeannette Sutton, Micki Olson
2024
View Paper
MS Pattern Explorer: interactive visual exploration of temporal activity patterns for multiple sclerosis
G. Morgenshtern, Yves Rutishauser, C. Haag, V. von Wyl, J. Bernard
2024
View Paper
D-Tour: Semi-Automatic Generation of Interactive Guided Tours for Visualization Dashboard Onboarding
V. Dhanoa, A. Hinterreiter, Vanessa Fediuk, Niklas Elmqvist, Eduard Gröller, Marc Streit
2024
View Paper
Telling Data Stories with the Hero's Journey: Design Guidance for Creating Data Videos
Zheng Wei, Huamin Qu, Xian Xu
2024
View Paper
GRETA analytics: Communicating the spatial dimension of energy citizenship using a collaborative Shiny app
Jonas Lieth, Dennis Abel, Stefan Jünger
2024
View Paper
The Effects of Layout Order on Interface Complexity: An Eye-Tracking Study for Dashboard Design
Nuowen Zhang, Jing Zhang, Shangsong Jiang, Wei Ge
2024
View Paper
Dashboard Sahabat Skizofrenia Pemantau Perkembangan Klien Berbasis Web di Pondok Pemulihan Sahabat
Shalommita Pranatantri, Restyandito Restyandito, Yuan Lukito
2024
View Paper
Visualization Atlases: Explaining and Exploring Complex Topics Through Data, Visualization, and Narration
Jinrui Wang, Xinhuan Shu, Benjamin Bach, Uta Hinrichs
2024
View Paper
Smart Dashboard for Water Quality Monitoring and Predicting in Koi Fish Farming Using IoT and Sarima Modeling
Tsania Rifqa Annisa, Dita Pramesti, Hanif Fakhrurroja, Bevan Pradika Putranto, Fahreza Anggriantaka
2024
View Paper
Demystifying Spatial Dependence: Interactive Visualizations for Interpreting Local Spatial Autocorrelation
Lee Mason, Bl'anaid Hicks, Jonas S. Almeida
2024
View Paper
Bringing Data into the Conversation: Adapting Content from Business Intelligence Dashboards for Threaded Collaboration Platforms
Hyeok Kim, Arjun Srinivasan, Matthew Brehmer
2024
View Paper
Letter to the editor of Heliyon: Development of minimum data set and dashboard for monitoring adverse events in radiology departments. Heliyon. 2024;10(9): e30054
Zahra Azadmanjir, V. Rahimi-Movaghar
2024
View Paper
From Instruction to Insight: Exploring the Functional and Semantic Roles of Text in Interactive Dashboards
N. Sultanum, V. Setlur
2024
View Paper
Data Guards: Challenges and Solutions for Fostering Trust in Data
N. Sultanum, Dennis Bromley, Michael Correll
2024
View Paper
Integrating Human-Computer Interaction Principles in User-Centered Dashboard Design: Insights from Maintenance Management
Sepideh Hassankhani Dolatabadi, E. Gatial, Ivana Budinska, Z. Balogh
2024
View Paper
A Learning Analytics Dashboard for K-12 English Teachers - Bridging the Gap Between Student Process Data and Teacher Needs
Leona Colling, Mareike Kholin, Walt Detmar Meurers
2024
View Paper
Analyzing the Relationship Between Meteorological Parameters and Electric Energy Consumption Using Support Vector Machine and Cooling Degree Days Algorithm
Nabila Wafiqotul Azizah, E. Y. Puspaningrum, I. Gede, Susrama Mas Diyasa
2024
View Paper
Development of a Real-Time Dashboard for Overdose Touchpoints: User-Centered Design Approach
Amey A. Salvi, Logan A. Gillenwater, B. Cockrum, Sarah E Wiehe, Kaitlyn Christian, John Cayton, Timothy Bailey, Katherine Schwartz, Allyson L Dir, Bradley Ray, M. Aalsma, Khairi Reda
2024
View Paper
RemixTape: Enriching Narratives about Metrics with Semantic Alignment and Contextual Recommendation
Matthew Brehmer, Margaret Drouhard, Arjun Srinivasan
2024
View Paper
A Deep Learning Approach for Traffic Circle Detection
Raphael Brunold, Beat Brändli, Leandro Gregorini, André Glatzl, A. V. Schie, Michael Burch
2024
View Paper
LoCoMoTe Dashboard: An Interactive Online Dashboard for the Standardised Categorisation of Natural Walking VR Experiments
Charlotte Croucher, Wendy Powell, Travis J. Wiltshire, Pieter Spronck
2024
View Paper
The effects of visualisation literacy and data storytelling dashboards on teachers’ cognitive load
Yuchen Liu, Stanislav Pozdniakov, Roberto Martínez-Maldonado
2024
View Paper
Use of the Usability Scale System as a Monitoring Dashboard Test for Inpatient Covid-19 Patients in Hospitals
Alaric Rasendriya Aniko, T. F. Kusumasari, Sinung Suakanto
2024
View Paper
Feature-Action Design Patterns for Storytelling Visualizations with Time Series Data
Saiful Khan, Scott Jones, Benjamin Bach, Jaehoon Cha, Min Chen, Julie Meikle, Jonathan C. Roberts, J. Thiyagalingam, Jo Wood, Panagiotis D. Ritsos
2024
View Paper
A Survey of Designs for Combined 2D+3D Visual Representations
Jia-Shun Hong, R. Hnatyshyn, Ebrar A. D. Santos, Ross Maciejewski, Tobias Isenberg
2024
View Paper
Construção de um Dashboard para Análise dos Dados de Câncer na Macrorregião de Saúde do Sudeste de Minas Gerais
J. P. Medeiros, M. C. Nogueira
2023
View Paper
Towards the development of complex thinking in university students: Mixed methods with ideathon and artificial intelligence
Isolda Margarita Castillo-Martínez, A. Argüelles-Cruz, Octavio Elías Piñal-Ramírez, Leonardo-David Glasserman-Morales, M. Ramírez-Montoya, Alejandra Carreon-Hermosillo
2023
View Paper
Transitioning to a Commercial Dashboarding System: Socio-Technical Observations and Opportunities
C. Walchshofer, V. Dhanoa, Marc Streit, Miriah Meyer
2023
View Paper
Visualizing Information on Smartwatch Faces: A Review and Design Space
Alaul Islam, Tingying He, A. Bezerianos, Bongshin Lee, Tanja Blascheck, Petra Isenberg
2023
View Paper
Show Me My Users: A Dashboard Visualizing User Interaction Logs
Jinrui Wang, Mashael AlKadi, Benjamin Bach
2023
View Paper
Fostering Enterprise Conversations Around Data on Collaboration Platforms
Hyeok Kim, Arjun Srinivasan, Matthew Brehmer
2023
View Paper
Towards the Adoption of a Plugable Architecture for Network Features Visualization
G. P. Jesi, A. Odorizzi, Gianluca Mazzini
2023
View Paper
Designing Situated Dashboards: Challenges and Opportunities
Anika Sayara, Benjamin Lee, Carlos Quijano-Chavez, Michael Sedlmair
2023
View Paper
Effective Visualization Electrification System via PSCADA Event Log in Railway Industry
Syamsul Azrin Bin Kamaruddin, H. Hashim, Elmy Johana Binti Mohamad, Nazwa Hidayah Binti Mohamad, H. Mamat
2023
View Paper
Highlighting the Importance of Intentional Aspects in Data Narrative Crafting Processes
Faten El Outa, Patrick Marcel, Verónika Peralta, Panos Vassiliadis
2023
View Paper
Challenges and Opportunities in Data Visualization Education: A Call to Action
B. Bach, Mandy Keck, Fateme Rajabiyazdi, Tatiana Losev, Isabel Meirelles, J. Dykes, R. Laramee, Mashael AlKadi, Christina Stoiber, Samuel Huron, Charles Perin, Luiz Morais, W. Aigner, Doris Kosminsky, Magdalena Boucher, S. Knudsen, A. Manataki, J. Aerts, Uta Hinrichs, J. C. Roberts, Sheelagh Carpendale
2023
View Paper
Heuristics for Supporting Cooperative Dashboard Design
V. Setlur, M. Correll, Arvind Satyanarayan, Melanie Tory
2023
View Paper
WhaleVis: Visualizing the History of Commercial Whaling
Ameya S. Patil, Zoe R Rand, T. Branch, L. Battle
2023
View Paper
Graphical features of interactive dashboards have little influence on engineering students performing a design task
Steven Hoffenson, Cory J. G. Philippe, Zuting Chen, Christian Barrientos, Zhongyuan Yu, Brian Chell, M. Blackburn
2023
View Paper
More Than Data Stories: Broadening the Role of Visualization in Contemporary Journalism
Yu Fu, J. Stasko
2023
View Paper
Chart2Vec: A Universal Embedding of Context-Aware Visualizations
Qing Chen, Ying Chen, Wei Shuai, Ruishi Zou, Yi Guo, Jiazhe Wang, Nana Cao
2023
View Paper
WITHDRAWN: RAMPVIS: A visualization and visual analytics infrastructure for COVID-19 data
Erik Rydow, Tuna Gönen, A. Kachkaev, Saiful Khan
2023
View Paper
Interactive process mining of cancer treatment sequences with melanoma real-world data
A. Wicky, R. Gatta, S. Latifyan, R. Micheli, C. Gerard, S. Pradervand, O. Michielin, M. Cuendet
2023
View Paper
EduVis: Workshop on Visualization Education, Literacy, and Activities
Mandy Keck, Samuel Huron, Georgia Panagiotidou, Christina Stoiber, Fateme Rajabiyazdi, Charles Perin, J. C. Roberts, B. Bach
2023
View Paper
Techniques for Immersive Data Storytelling
R. Jain
2023
View Paper
Design System of Plant Decorative Ceramic Pattern Based on Multi-Objective Genetic Algorithm
Fan Shuai
2023
View Paper
Visual Design as the Key Factor for Effective Environmental Analytics Dashboard
Z. Zainuddin, Farashazillah Yahya, Ahmad Fareez Yahya
2022
View Paper
DMiner: Dashboard Design Mining and Recommendation
Yanna Lin, Haotian Li, Aoyu Wu, Yong Wang, Huamin Qu
2022
View Paper
DashBot: Insight-Driven Dashboard Generation Based on Deep Reinforcement Learning
Dazhen Deng, Aoyu Wu, Huamin Qu, Yingcai Wu
2022
View Paper
An Adaptive Benchmark for Modeling User Exploration of Large Datasets
Joanna Purich, Hira Mahmood, Diana Chou, Chidi Udeze, L. Battle
2022
View Paper
Talk2Data: A Natural Language Interface for Exploratory Visual Analysis via Question Decomposition
Yi Guo, Danqing Shi, Mingjuan Guo, Yanqiu Wu, Nana Cao, Qing Chen
2021
View Paper
Integrating Information Governance as the Foundation for Information Dashboard Design Ontology
Ahadi Haji Mohd Nasir, E. Salwana, Mohammad Nazir Ahmad
2025
View Paper
Studying Parallel Coordinates Under Varying Aspect Ratios
Leon Meka, Mirjam Kronsteiner, Johanna Schmidt
2025
View Paper
Towards Unified Information Dashboard Design - Common Principles, Practices, and Challenges
Ahadi Haji Mohd Nasir, Ely Salwana Mat Surin, Mohammad Nazir Ahmad
2024
View Paper
Dashboard Design: Interactive and Visual Exploration of Spotify Songs
Sarah Clavadetscher, Michael Schlotter, Nadine Christen, Juliane Streitberg, Michael Burch
2024
View Paper
A Systematic Review of Visualization Recommendation Systems: Goals, Strategies, Interfaces, and Evaluations
Zehua Zeng, Leilani Battle
2024
View Paper
Nonparametric Predictive Inference Forest Fire Dashboard
Amirah Hazwani Roslin, Noryanti Muhammad
2024
View Paper
Implementation of Flood Emergency Response System with Face Analytics
E.Mardaid, Z. Z. Abidin, S. A. Asmai, Z. A. Abas, Fakulti Teknologi Maklumat, Dan Komunikasi
2023
View Paper
Multi-Criteria Optimization for Automatic Dashboard Design
Ji-Won Choi, Jaemin Jo
2023
View Paper
BOLT: A Natural Language Interface for Dashboard Authoring
Arjun Srinivasan, V. Setlur
2023
View Paper
Design Considerations of Insight-Driven Dashboard Generation
Dazhen Deng
2022
View Paper
VisTorch: Authoring Physical Visualization Dashboards using Handheld Projectors
Biswaksen Patnaik, Huaishu Peng, Niklas Elmqvist
View Paper

Similar Papers

Heuristics for Supporting Cooperative Dashboard Design

Arvind Satyanarayan, Vidya Setlur, Melanie Tory, Michael Correll

Published: 2023-08-10

DMiner: Dashboard Design Mining and Recommendation

Huamin Qu, Yong Wang, Haotian Li, Aoyu Wu, Yanna Lin

Published: 2023-07-04

Toward a Scalable Census of Dashboard Designs in the Wild: A Case Study with Tableau Public

Arjun Srinivasan, Leilani Battle, Vidya Setlur, Michael Correll, Anamaria Crisan, Joanna Purich

Published: 2023-10-18

Indexing Analytics to Instances: How Integrating a Dashboard can Support Design Education

Ruihong Huang, John Keyser, Ajit Jain, Andruid Kerne, Jinsil Seo, Nic Lupfer, Aaron Perrine, Gabriel Britain, Yoonsuck Choe, Annie Sungkajun, Robert Lightfoot, Timothy McGuire

Published: 2024-04-09

Comments (0)

This website uses cookies to ensure you get the best experience. Learn more