InclusiViz is a visual analytics system that uses human mobility data to analyze urban segregation across residential and activity spaces, employing deep learning and explainable AI to reveal underlying segregation patterns and support targeted urban interventions. The system's effectiveness was validated through quantitative evaluation and case studies, showcasing its potential for fostering inclusive urban planning.
No key terms available for this paper.
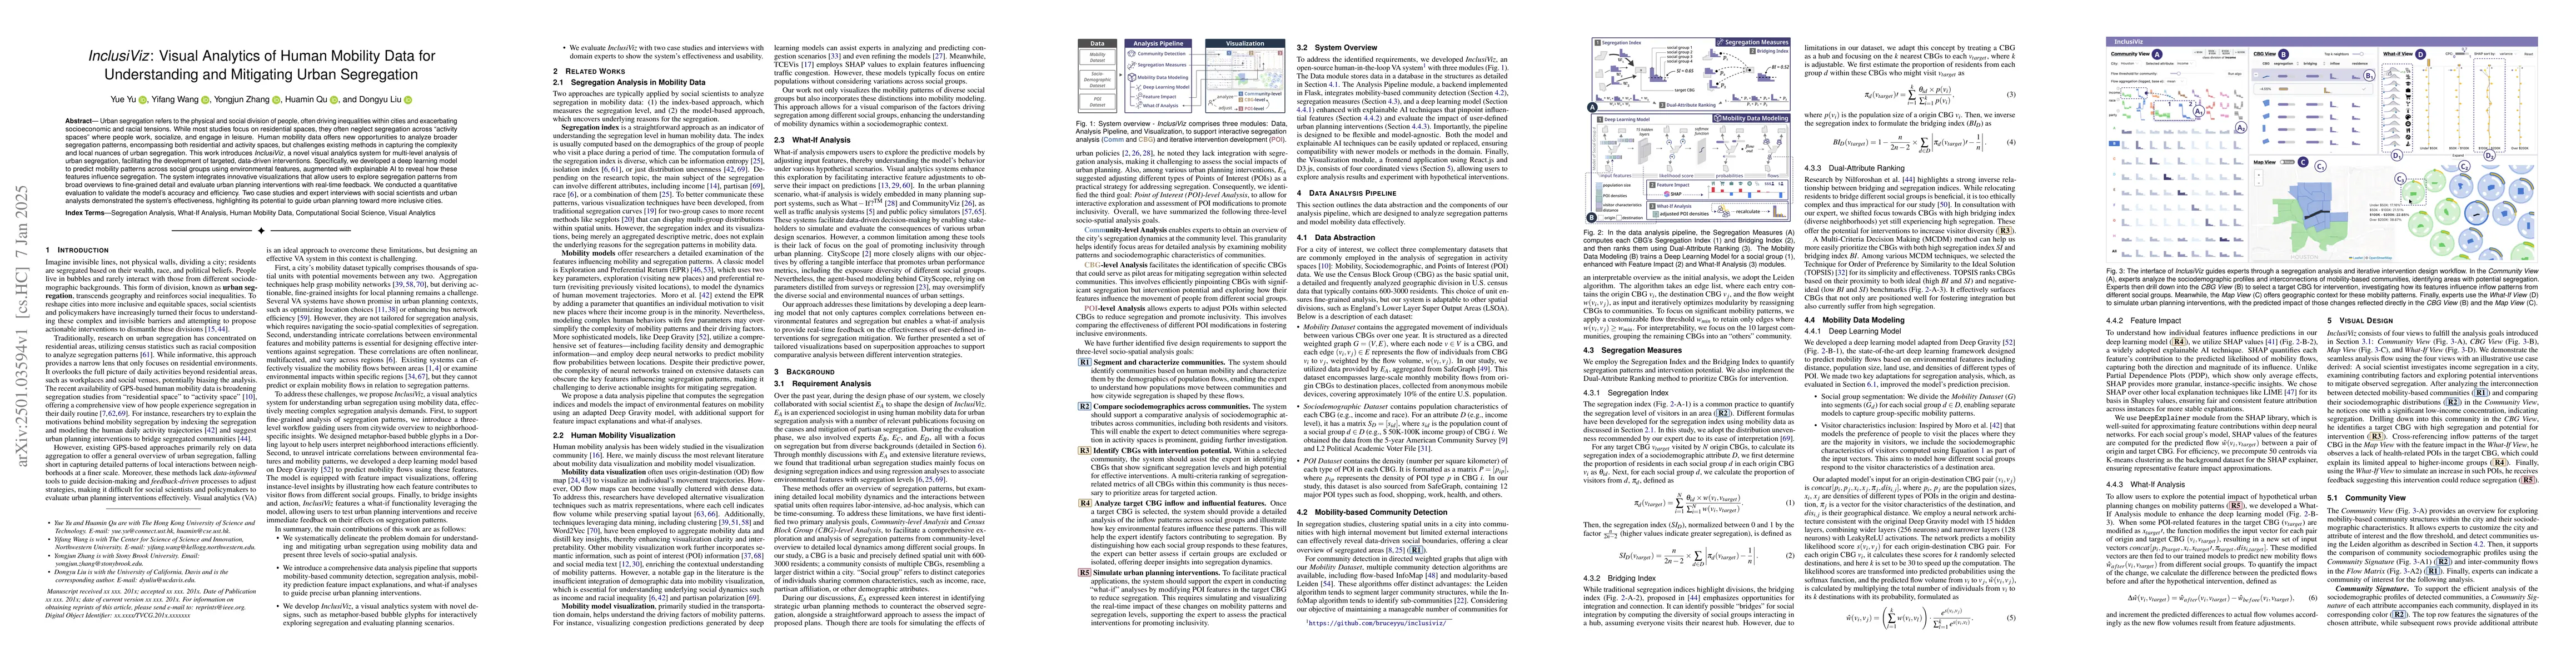
Urban segregation refers to the physical and social division of people, often driving inequalities within cities and exacerbating socioeconomic and racial tensions. While most studies focus on residential spaces, they often neglect segregation across "activity spaces" where people work, socialize, and engage in leisure. Human mobility data offers new opportunities to analyze broader segregation patterns, encompassing both residential and activity spaces, but challenges existing methods in capturing the complexity and local nuances of urban segregation. This work introduces InclusiViz, a novel visual analytics system for multi-level analysis of urban segregation, facilitating the development of targeted, data-driven interventions. Specifically, we developed a deep learning model to predict mobility patterns across social groups using environmental features, augmented with explainable AI to reveal how these features influence segregation. The system integrates innovative visualizations that allow users to explore segregation patterns from broad overviews to fine-grained detail and evaluate urban planning interventions with real-time feedback. We conducted a quantitative evaluation to validate the model's accuracy and efficiency. Two case studies and expert interviews with social scientists and urban analysts demonstrated the system's effectiveness, highlighting its potential to guide urban planning toward more inclusive cities.
This graph shows how this paper is connected to other research. The current paper is shown in dark gray, papers that cite it are in green, and papers it references are in blue. You can:
• Hover over any node to see the paper title
• Click a node to view that paper's details
• Drag nodes to rearrange the graph
• Use the zoom controls (bottom right) to zoom in/out
No citations found for this paper.
Title | Authors | Year | Actions |
---|---|---|---|
Economic Inequality and the Geography of Activity Space Segregation: Combining Mobile Device Data and Census Data
|
Siwei Cheng, Yongjun Zhang, Jenna Shaw
|
2025
|
View Paper |
A Survey on Progressive Visualization
|
Alex Ulmer, Marco Angelini, Jean-Daniel Fekete, Jörn Kohlhammer, T. May
|
2023
|
View Paper |
Human mobility networks reveal increased segregation in large cities
|
H. Nilforoshan, Wenli Looi, E. Pierson, Blanca Villanueva, N. Fishman, Yiling Chen, John Sholar, Beth Redbird, D. Grusky, J. Leskovec
|
2023
|
View Paper |
Segplot: A New Method for Visualizing Patterns of Multi-Group Segregation
|
Benjamin Elbers, R. Gruijters
|
2023
|
View Paper |
NeighViz: Towards Better Understanding of Neighborhood Effects on Social Groups with Spatial Data
|
Yue Yu, Yifang Wang, Qisen Yang, Di Weng, Yongjun Zhang, Xiaogang Wu, Yingnian Wu, Huamin Qu
|
2023
|
View Paper |
GeoExplainer: A Visual Analytics Framework for Spatial Modeling Contextualization and Report Generation
|
Fan Lei, Yuxin Ma, S. Fotheringham, Elizabeth A. Mack, Ziqi Li, M. Sachdeva, Sarah Bardin, Ross Maciejewski
|
2023
|
View Paper |
FSLens: A Visual Analytics Approach to Evaluating and Optimizing the Spatial Layout of Fire Stations
|
Long-fei Chen, He Wang, Ouyang Yang, Yang Zhou, Naiyu Wang, Quan Li
|
2023
|
View Paper |
Human mobility patterns are associated with experienced partisan segregation in US metropolitan areas
|
Yongjun Zhang, Siwei Cheng, Zhi Li, Wenhao Jiang
|
2023
|
View Paper |
A Multiscale Geospatial Dataset and an Interactive Visualization Dashboard for Computational Epidemiology and Open Scientific Research
|
Muhammad Usman, Honglu Zhou, Seonghyeon Moon, Xun Zhang, P. Faloutsos, M. Kapadia
|
2022
|
View Paper |
A framework proposal for machine learning-driven agent-based models through a case study analysis
|
Y. Turgut, C. Bozdag
|
2022
|
View Paper |
A survey of urban visual analytics: Advances and future directions
|
Zikun Deng, Di Weng, Shuhan Liu, Yuan Tian, Mingliang Xu, Yingnian Wu
|
2022
|
View Paper |
Unfolding community homophily in U.S. metropolitans via human mobility
|
Xiao Huang, Yuhui Zhao, Siqin Wang, Xiao Li, Di Yang, Yu Feng, Yang Xu, Liao Zhu, Biyu Chen
|
2022
|
View Paper |
A Visual Analytics System for Improving Attention-based Traffic Forecasting Models
|
Seungmin Jin, Hyunwoo Lee, Cheonbok Park, Hyeshin Chu, Yunwon Tae, J. Choo, Sungahn Ko
|
2022
|
View Paper |
A spatial agent-based joint model of electric vehicle and vehicle-to-grid adoption: A case of Beijing
|
Jun Liu, Chengxiang Zhuge, Justin Tang, Meng Meng, J. Zhang
|
2022
|
View Paper |
Estimating experienced racial segregation in US cities using large-scale GPS data
|
S. Athey, B. Ferguson, M. Gentzkow, Tobias Schmidt
|
2021
|
View Paper |
VBridge: Connecting the Dots Between Features and Data to Explain Healthcare Models
|
Furui Cheng, Dongyu Liu, F. Du, Yanna Lin, Alexandra Zytek, Haomin Li, Huamin Qu, K. Veeramachaneni
|
2021
|
View Paper |
Mobility patterns are associated with experienced income segregation in large US cities
|
E. Moro, D. Calacci, Xiaowen Dong, A. Pentland
|
2021
|
View Paper |
A Deep Gravity model for mobility flows generation
|
F. Simini, Gianni Barlacchi, Massimilano Luca, Luca Pappalardo
|
2020
|
View Paper |
A Visual Analytics System for Exploring, Monitoring, and Forecasting Road Traffic Congestion
|
Chunggi Lee, Yeonjun Kim, Seungmin Jin, Dongmin Kim, Ross Maciejewski, D. Ebert, Sungahn Ko
|
2020
|
View Paper |
Towards Better Bus Networks: A Visual Analytics Approach
|
Di Weng, Chen Zheng, Zikun Deng, Mingze Ma, Jie Bao, Yu Zheng, Mingliang Xu, Yingcai Wu
|
2020
|
View Paper |
Income Segregation and Intergenerational Mobility Across Colleges in the United States*
|
Raj Chetty, John N Friedman, Emmanuel Saez, Nicholas Turner, Danny Yagan
|
2020
|
View Paper |
Urban Mobility and Activity Space
|
K. Cagney, E. Cornwell, Alyssa W. Goldman, Liang Cai
|
2020
|
View Paper |
EpiMob: Interactive Visual Analytics of CitywideHuman Mobility Restrictions for Epidemic Control
|
Zhiwen Zhang, Chuang Yang, Z. Fan, Renhe Jiang, Quanjun Chen, Xuan Song, R. Shibasaki
|
2020
|
View Paper |
Socially-Structured Mobility Networks and School Segregation Dynamics: The Role of Emergent Consideration Sets
|
Julia Burdick-Will, Jeffrey A. Grigg, K. Nerenberg, F. Connolly
|
2020
|
View Paper |
UrbanMotion: Visual Analysis of Metropolitan-Scale Sparse Trajectories
|
Lei Shi, Congcong Huang, Meijun Liu, Jia Yan, Tao Jiang, Zhihao Tan, Yifan Hu, Wei Chen, Xiatian Zhang
|
2020
|
View Paper |
Many-to-Many Geographically-Embedded Flow Visualisation: An Evaluation
|
Yalong Yang, Tim Dwyer, Sarah Goodwin, K. Marriott
|
2019
|
View Paper |
The What-If Tool: Interactive Probing of Machine Learning Models
|
James Wexler, Mahima Pushkarna, Tolga Bolukbasi, M. Wattenberg, F. Viégas, Jimbo Wilson
|
2019
|
View Paper |
Bird's‐Eye ‐ Large‐Scale Visual Analytics of City Dynamics using Social Location Data
|
Robert Krueger, Qi Han, N. Ivanov, Sanae Mahtal, Dennis Thom, H. Pfister, Thomas Ertl
|
2019
|
View Paper |
The State of the Art in Visualizing Multivariate Networks
|
C. Nobre, Miriah D. Meyer, M. Streit, A. Lex
|
2019
|
View Paper |
TPFlow: Progressive Partition and Multidimensional Pattern Extraction for Large-Scale Spatio-Temporal Data Analysis
|
Dongyu Liu, Panpan Xu, Liu Ren
|
2019
|
View Paper |
Visual Abstraction of Large Scale Geospatial Origin-Destination Movement Data
|
Zhiguang Zhou, Linhao Meng, Cheng Tang, Ying Zhao, Zhiyong Guo, Miaoxin Hu, Wei Chen
|
2019
|
View Paper |
From Louvain to Leiden: guaranteeing well-connected communities
|
V. Traag, L. Waltman, Nees Jan van Eck
|
2018
|
View Paper |
CityScope: A Data-Driven Interactive Simulation Tool for Urban Design. Use Case Volpe
|
Luis Alonso, Yan Zhang, A. Grignard, Ariel Noyman, Yasushi Sakai, Markus Elkatsha, R. Doorley, K. Larson
|
2018
|
View Paper |
The Impact of New Mobility Modes on a City: A Generic Approach Using ABM
|
A. Grignard, Luis Alonso, P. Taillandier, B. Gaudou, T. Nguyen-Huu, Wolfgang Gruel, K. Larson
|
2018
|
View Paper |
Metro-Wordle: An Interactive Visualization for Urban Text Distributions Based on Wordle
|
Chenlu Li, Xiaoju Dong, Xiaoru Yuan
|
2018
|
View Paper |
Revealing Patterns and Trends of Mass Mobility Through Spatial and Temporal Abstraction of Origin-Destination Movement Data
|
G. Andrienko, N. Andrienko, G. Fuchs, J. Wood
|
2017
|
View Paper |
A Unified Approach to Interpreting Model Predictions
|
Scott M. Lundberg, Su-In Lee
|
2017
|
View Paper |
Spatio-temporal flow maps for visualizing movement and contact patterns
|
Bing Ni, Qiaomu Shen, Jiayi Xu, Huamin Qu
|
2017
|
View Paper |
Socioeconomic Segregation of Activity Spaces in Urban Neighborhoods: Does Shared Residence Mean Shared Routines?
|
Christopher R. Browning, Catherine A. Calder, Lauren J. Krivo, Anna L. Smith, Bethany Boettner
|
2017
|
View Paper |
Visualizing the Relationship Between Human Mobility and Points of Interest
|
Wei Zeng, Chi-Wing Fu, Stefan Müller Arisona, S. Schubiger, R. Burkhard, K. Ma
|
2017
|
View Paper |
Interacting with Predictions: Visual Inspection of Black-box Machine Learning Models
|
Josua Krause, Adam Perer, Kenney Ng
|
2016
|
View Paper |
Leveraging spatial abstraction in traffic analysis and forecasting with visual analytics
|
N. Andrienko, G. Andrienko, S. Rinzivillo
|
2016
|
View Paper |
“Why Should I Trust You?”: Explaining the Predictions of Any Classifier
|
Marco Tulio Ribeiro, Sameer Singh, Carlos Guestrin
|
2016
|
View Paper |
Interactive Visual Discovering of Movement Patterns from Sparsely Sampled Geo-tagged Social Media Data
|
Siming Chen, Xiaoru Yuan, Zhenhuang Wang, Cong Guo, Jie Liang, Zuchao Wang, X. Zhang, Jiawan Zhang
|
2016
|
View Paper |
MobilityGraphs: Visual Analysis of Mass Mobility Dynamics via Spatio-Temporal Graphs and Clustering
|
T. V. Landesberger, Felix Brodkorb, Philipp Roskosch, N. Andrienko, G. Andrienko, A. Kerren
|
2016
|
View Paper |
TelCoVis: Visual Exploration of Co-occurrence in Urban Human Mobility Based on Telco Data
|
Wenchao Wu, Jiayi Xu, Haipeng Zeng, Yixian Zheng, Huamin Qu, Bing Ni, Mingxuan Yuan, L. Ni
|
2016
|
View Paper |
Returners and explorers dichotomy in human mobility
|
Luca Pappalardo, F. Simini, S. Rinzivillo, D. Pedreschi, F. Giannotti, A. Barabási
|
2015
|
View Paper |
Origin-Destination Flow Data Smoothing and Mapping
|
Diansheng Guo, Xi Zhu
|
2014
|
View Paper |
Locations
|
J. Klein
|
2013
|
View Paper |
Weighted graph comparison techniques for brain connectivity analysis
|
Basak Alper, Benjamin Bach, N. Riche, Tobias Isenberg, Jean-Daniel Fekete
|
2013
|
View Paper |
Measuring segregation: an activity space approach
|
D. Wong, S. Shaw
|
2011
|
View Paper |
Area Cartograms: Their Use and Creation
|
D. Dorling
|
2011
|
View Paper |
Spatial Generalization and Aggregation of Massive Movement Data
|
N. Andrienko, G. Andrienko
|
2011
|
View Paper |
Modelling the scaling properties of human mobility
|
Chaoming Song, Tal Koren, Pu Wang, A. Barab'asi
|
2010
|
View Paper |
The map equation
|
M. Rosvall, D. Axelsson, Carl T. Bergstrom
|
2009
|
View Paper |
The “Working Group”
|
Gila Fatran, N. Greenwood
|
1994
|
View Paper |
TOPSIS for MODM
|
Young-Jou Lai, Ting-Yun Liu, C. Hwang
|
1994
|
View Paper |
A METHODOLOGICAL ANALYSIS OF SEGREGATION INDEXES
|
O. D. Duncan, B. Duncan
|
1955
|
View Paper |
Understanding and using American Community Survey Data: What all data users need to know
|
2020
|
||
Houston among the most politically-polarized cities in america, analysis finds,
|
2019
|
||
SmartAdP: Visual Analytics of Large-scale Taxi Trajectories for Selecting Billboard Locations
|
Dongyu Liu, Di Weng, Yuhong Li, Jie Bao, Yu Zheng, Huamin Qu, Yingcai Wu
|
2017
|
View Paper |
What the Demolition of Public Housing Teaches Us about the Impact of Racial Threat on Political Behavior
|
Ryan D. Enos
|
2016
|
View Paper |
Moving to Opportunity for Fair Housing Demonstration Program -- Final Impacts Evaluation
|
L. Sanbonmatsu, Jens Ludwig, Jens Ludwig, Lawrence F. Katz, Lawrence F. Katz, L. Gennetian, Greg J. Duncan, Ronald C. Kessler, Emma K. Adam, Thomas W. Mcdade, S. Lindau, S. Lindau
|
2011
|
View Paper |
Visualisation of origins, destinations and flows with od maps
|
2010
|
||
Communities in control: Developing local models using communityviz
|
2008
|
||
A new tool for a new planning: The What − If? TM planning support system
|
2008
|
||
Segregation and diversity measures in population distribution.
|
M. White
|
1986
|
View Paper |
R2 Compare sociodemographics across communities
|
|||
L2, Inc. L2 political academic voter file
|
|||
R4 Analyze target CBG inflow and influential features
|
|||
Survey reveals inequalities in houston, including nearly four in ten residents can’t afford a $400 emergency expense
|
|||
R1 Segment and characterize communities
|
|||
R5 Simulate urban planning interventions
|
|||
SafeGraph
|
|||
Visual analytics of traffic congestion influencing factors based on explainable machine learning
|
Showing first page preview. Click "Open Full PDF" to view the complete paper.
Yuan Liao, Jorge Gil, Sonia Yeh, Rafael H. M. Pereira, Laura Alessandretti
Published: 2024-06-27
Published: 2019-03-29
Gustavo Moreira, Maryam Hosseini, Marcos Lage, Fabio Miranda, Thomas Ortner, Milena Vuckovic, Filip Biljecki, Claudio Silva, Nivan Ferreira
Published: 2024-07-02
You need to log in to post a comment.
Your comment contains inappropriate language.
Are you sure you want to remove this tag?
Someone just favorited a paper!
Comments (0)