This paper defends visual analytics systems by addressing criticisms through two interview studies. It identifies 36 common criticisms from researchers and discusses their responses, aiming to improve the scientific rigor and values of VA systems. The authors encourage a critical and inclusive approach to understanding these systems' complexities.
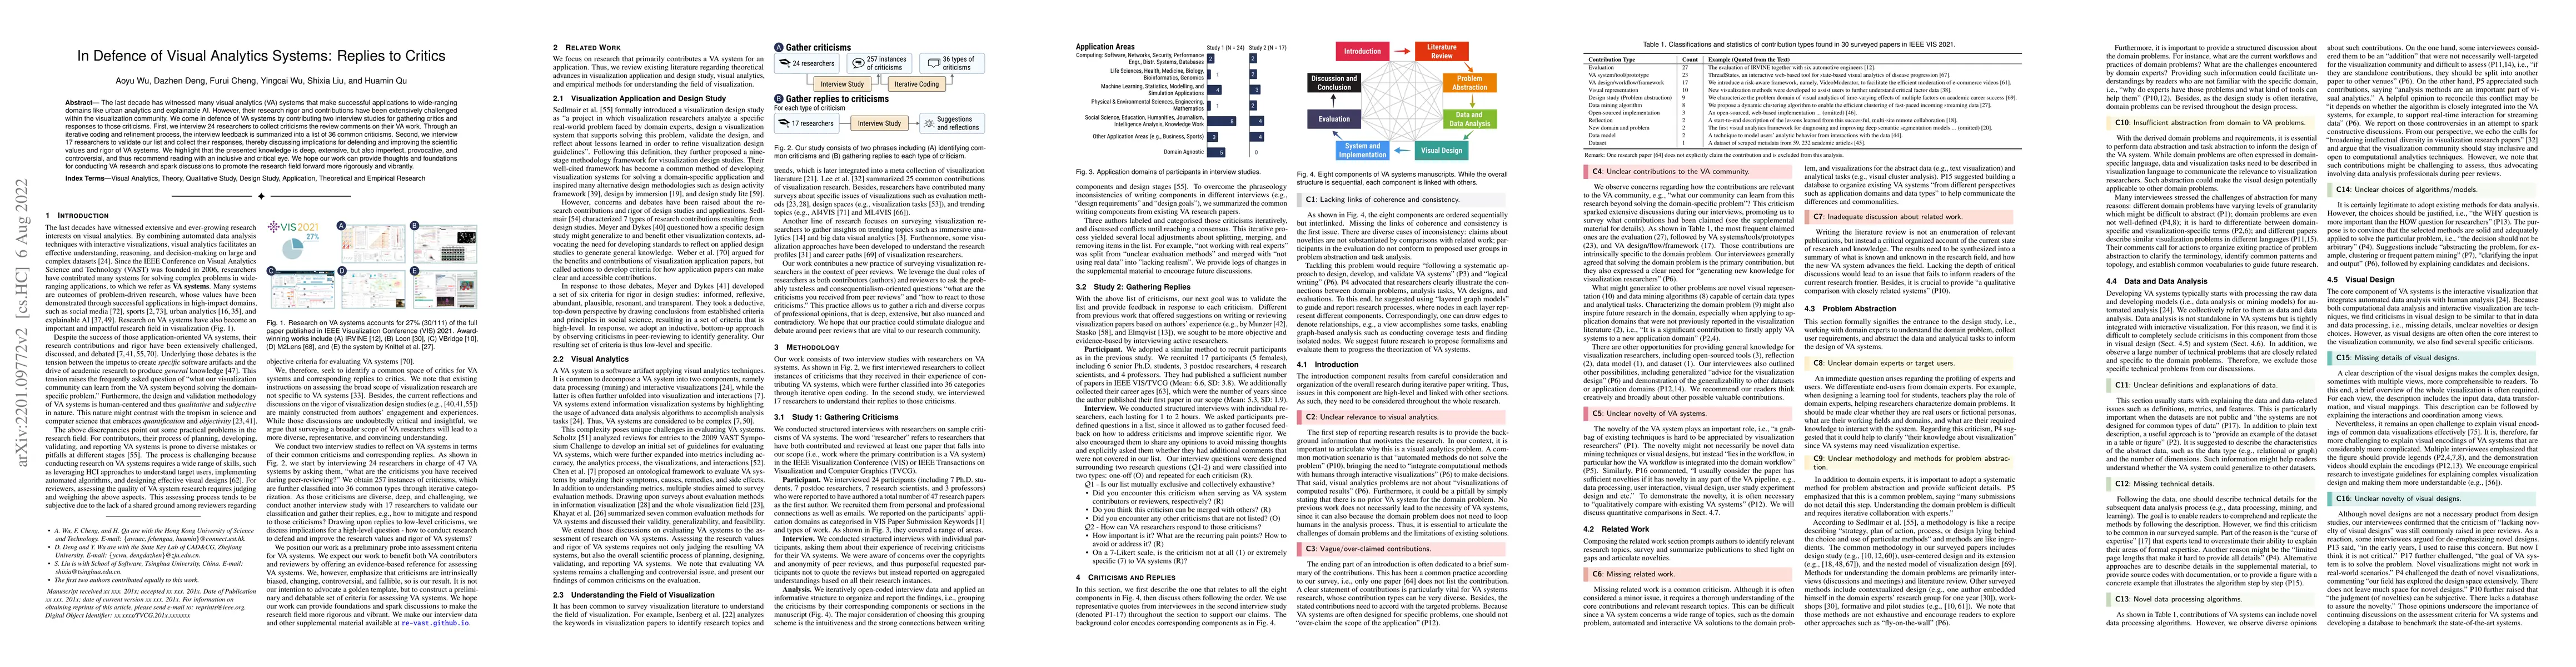
The last decade has witnessed many visual analytics (VA) systems that make successful applications to wide-ranging domains like urban analytics and explainable AI. However, their research rigor and contributions have been extensively challenged within the visualization community. We come in defence of VA systems by contributing two interview studies for gathering critics and responses to those criticisms. First, we interview 24 researchers to collect criticisms the review comments on their VA work. Through an iterative coding and refinement process, the interview feedback is summarized into a list of 36 common criticisms. Second, we interview 17 researchers to validate our list and collect their responses, thereby discussing implications for defending and improving the scientific values and rigor of VA systems. We highlight that the presented knowledge is deep, extensive, but also imperfect, provocative, and controversial, and thus recommend reading with an inclusive and critical eye. We hope our work can provide thoughts and foundations for conducting VA research and spark discussions to promote the research field forward more rigorously and vibrantly.
Get AI-generated insights about this paper's methodology, results, and significance.
Current paper (gray), citations (green), references (blue)
Mohamed Amine Chatti, Mouadh Guesmi, Arham Muslim et al.
Yu Zhang, Cagatay Turkay, Junjie Wang et al.
Title | Authors | Year | Actions |
---|---|---|---|
Uncertainty in Science is Malleable. Advocating for User-Agency in Defining Uncertainty in Visualizations: a Case Study in Geology
|
Vanessa Peña-Araya, Consuelo Martínez Fontaine, Xiang Wei, Guillaume Delpech, A. Bezerianos
|
2025
|
View Paper |
Curio: A Dataflow-Based Framework for Collaborative Urban Visual Analytics
|
Gustavo Moreira, Maryam Hosseini, Carolina Veiga, Lucas Alexandre, Nicola Colaninno, Daniel de Oliveira, Nivan Ferreira, Marcos Lage, Fabio Miranda
|
2024
|
View Paper |
Assessing the landscape of toolkits, frameworks, and authoring tools for urban visual analytics systems
|
L. Ferreira, Gustavo Moreira, Maryam Hosseini, Marcos Lage, Nivan Ferreira, Fabio Miranda
|
2024
|
View Paper |
CIME4R: Exploring iterative, AI-guided chemical reaction optimization campaigns in their parameter space
|
Christina Humer, Rachel Nicholls, Henry Heberle, Moritz Heckmann, Michael Pühringer, Thomas Wolf, Maximilian Lübbesmeyer, Julian Heinrich, Julius Hillenbrand, Giulio Volpin, Marc Streit
|
2024
|
View Paper |
LEVA: Using Large Language Models to Enhance Visual Analytics
|
Yuheng Zhao, Yixing Zhang, Yu Zhang, Xinyi Zhao, Junjie Wang, Zekai Shao, C. Turkay, Siming Chen
|
2024
|
View Paper |
How “Applied” is Fifteen Years of VAST conference?
|
Lei Shi, Lei Xia, Zipeng Liu, Ye Sun, Huijie Guo, Klaus Mueller
|
2023
|
View Paper |
Grand Challenges in Visual Analytics Applications
|
Aoyu Wu, Dazhen Deng, Min Chen, Shixia Liu, Daniel Keim, Ross Maciejewski, Silvia Miksch, Hendrik Strobelt, Fernanda B. Viégas, Martin Wattenberg, T. Rhyne
|
2023
|
View Paper |
: A Visual Analytics Approach for Understanding the Dual Frontiers of Science and Technology
|
Yifang Wang, Yifan Qian, Xiaoyu Qi, Nan Cao, Dashun Wang
|
2023
|
View Paper |
Visually Analysing the Fairness of Clustered Federated Learning with Non-IID Data
|
Li Huang, Weiwei Cui, Bin Zhu, Haidong Zhang
|
2023
|
View Paper |
SuperNOVA: Design Strategies and Opportunities for Interactive Visualization in Computational Notebooks
|
Zijie J. Wang, David Munechika, Seongmin Lee, Duen Horng Chau
|
2023
|
View Paper |
Troubling Collaboration: Matters of Care for Visualization Design Study
|
Derya Akbaba, Devin Lange, M. Correll, A. Lex, Miriah D. Meyer
|
2023
|
View Paper |
VAID: Indexing View Designs in Visual Analytics System
|
Lu Ying, Aoyu Wu, Haotian Li, Zikun Deng, Ji Lan, Jiang Wu, Yong Wang, Huamin Qu, Dazhen Deng, Yingcai Wu
|
2022
|
View Paper |
ECoalVis: Visual Analysis of Control Strategies in Coal-fired Power Plants
|
Shuhan Liu, Di Weng, Yuan Tian, Zikun Deng, Haoran Xu, Xiangyu Zhu, Honglei Yin, Xianyuan Zhan, Yingnian Wu
|
2022
|
View Paper |
OBTracker: Visual Analytics of Off-ball Movements in Basketball
|
Yihong Wu, Dazhen Deng, Xiao Xie, Moqi He, Jie Xu, Hongzeng Zhang, Hui Zhang, Yingnian Wu
|
2022
|
View Paper |
MetaGlyph: Automatic Generation of Metaphoric Glyph-based Visualization
|
Lu Ying, Xinhuan Shu, Dazhen Deng, Yuchen Yang, Tan Tang, Lingyun Yu, Yingcai Wu
|
2022
|
View Paper |
DashBot: Insight-Driven Dashboard Generation Based on Deep Reinforcement Learning
|
Dazhen Deng, Aoyu Wu, Huamin Qu, Yingcai Wu
|
2022
|
View Paper |
RASIPAM: Interactive Pattern Mining of Multivariate Event Sequences in Racket Sports
|
Jiang Wu, Dongyu Liu, Ziyang Guo, Yingnian Wu
|
2022
|
View Paper |
HardVis: Visual Analytics to Handle Instance Hardness Using Undersampling and Oversampling Techniques
|
Angelos Chatzimparmpas, F. Paulovich, A. Kerren
|
2022
|
View Paper |
Revisiting the Design Patterns of Composite Visualizations
|
Dazhen Deng, Weiwei Cui, Xiyu Meng, Mengye Xu, Yu Liao, Haidong Zhang, Yingcai Wu
|
2022
|
View Paper |
Design Considerations of Insight-Driven Dashboard Generation
|
Dazhen Deng
|
2022
|
View Paper |
Comments (0)