Visualization Atlases: Explaining and Exploring Complex Topics through Data, Visualization, and Narration
Publication
Metrics
AI Quick Summary
This paper introduces visualization atlases as web-based compendiums explaining complex topics through data visualizations and narration, identifies design patterns and genres, and discusses their ethical implications and potential impact. It combines exploratory visualization, storytelling, and structured navigation to serve diverse audiences.
Paper Preview
Abstract
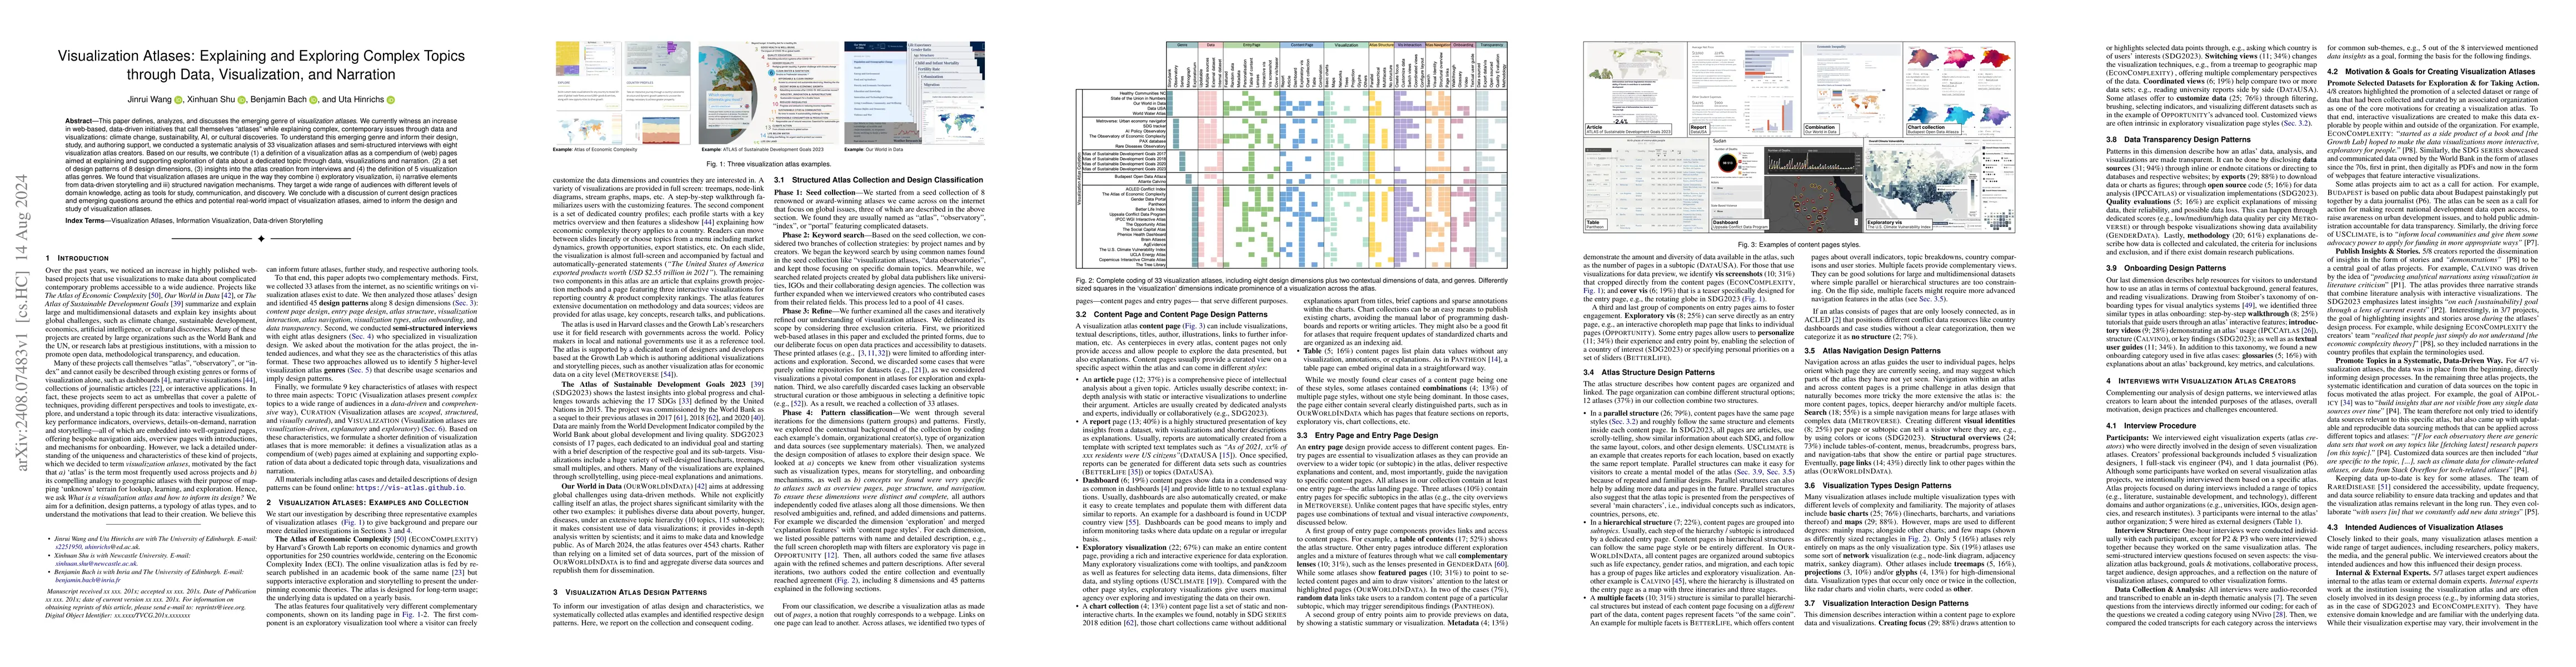
This paper defines, analyzes, and discusses the emerging genre of visualization atlases. We currently witness an increase in web-based, data-driven initiatives that call themselves "atlases" while explaining complex, contemporary issues through data and visualizations: climate change, sustainability, AI, or cultural discoveries. To understand this emerging genre and inform their design, study, and authoring support, we conducted a systematic analysis of 33 visualization atlases and semi-structured interviews with eight visualization atlas creators. Based on our results, we contribute (1) a definition of a visualization atlas as a compendium of (web) pages aimed at explaining and supporting exploration of data about a dedicated topic through data, visualizations and narration. (2) a set of design patterns of 8 design dimensions, (3) insights into the atlas creation from interviews and (4) the definition of 5 visualization atlas genres. We found that visualization atlases are unique in the way they combine i) exploratory visualization, ii) narrative elements from data-driven storytelling and iii) structured navigation mechanisms. They target a wide range of audiences with different levels of domain knowledge, acting as tools for study, communication, and discovery. We conclude with a discussion of current design practices and emerging questions around the ethics and potential real-world impact of visualization atlases, aimed to inform the design and study of visualization atlases.
AI Key Findings
Get AI-generated insights about this paper's methodology, results, significance, and more — seven facets brought into focus.
Impact
Authors
PDF Preview
Citation Network
Current paper (gray), citations (green), references (blue)
Display is limited for performance on very large graphs.
Discussion 0