Show Me My Users: A Dashboard Visualizing User Interaction Logs
Publication
Metrics
AI Quick Summary
This paper presents a dashboard and analysis pipeline for monitoring user interactions in visualization tools, extracting KPIs from log data to display live metrics. The dashboard aids analysts in understanding user behaviors, planning interventions, and enhancing tool features.
Paper Preview
Abstract
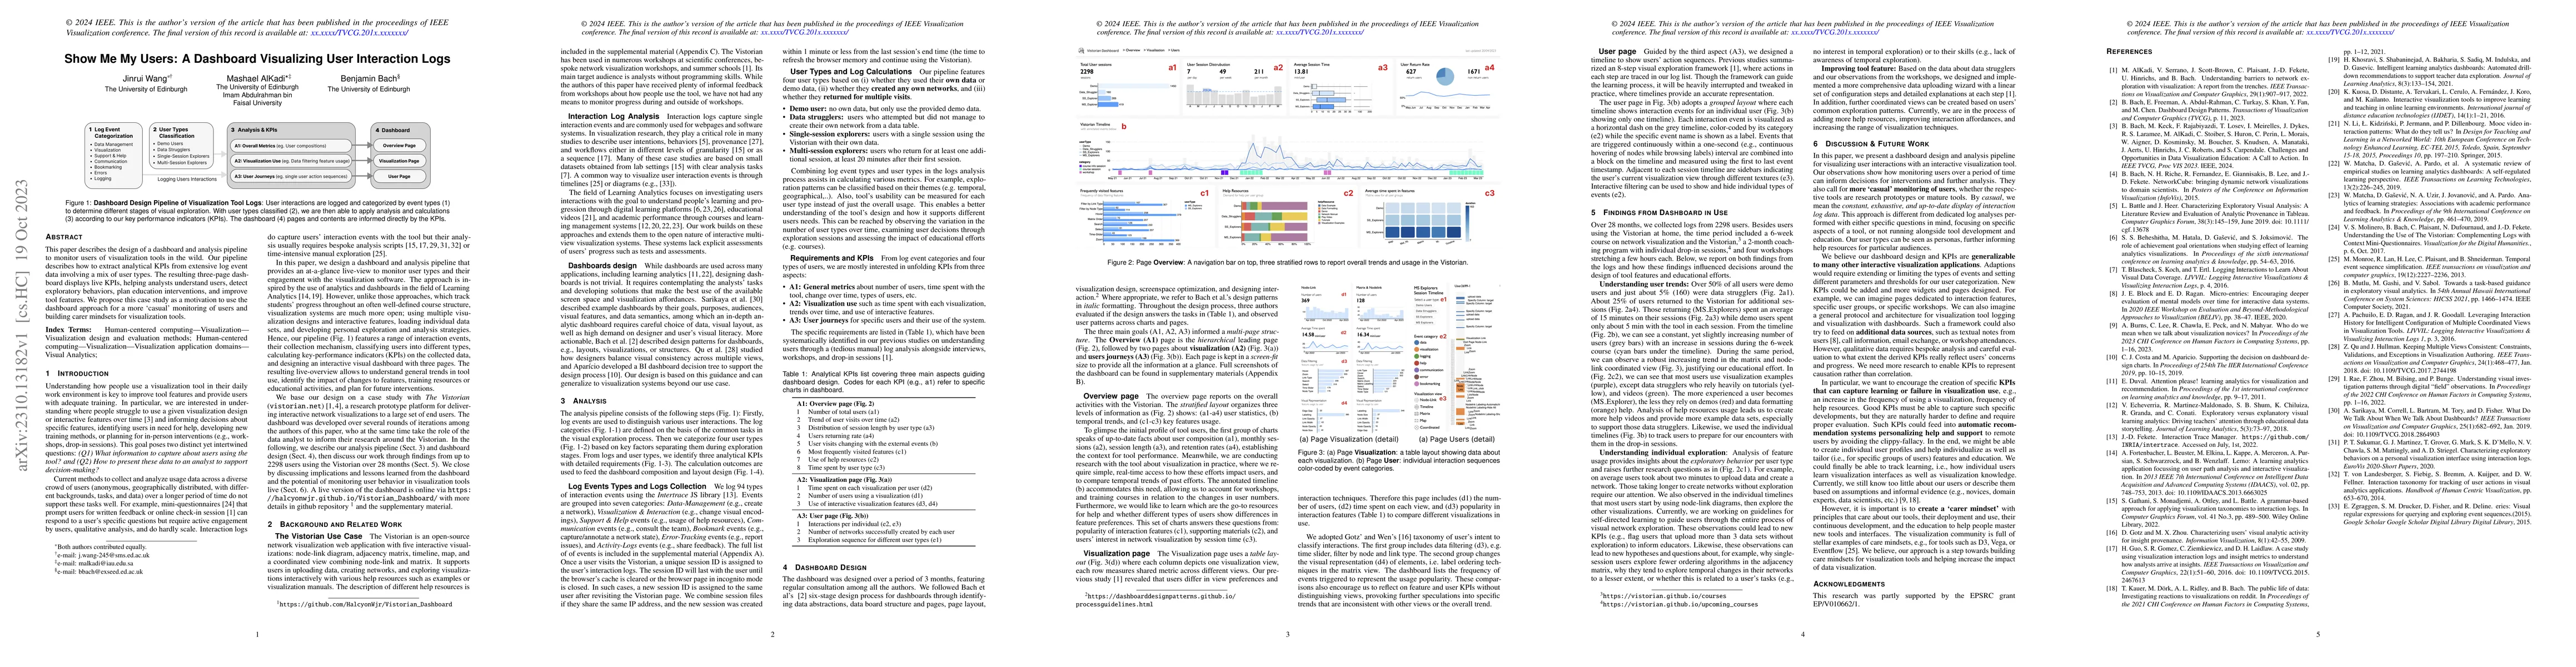
This paper describes the design of a dashboard and analysis pipeline to monitor users of visualization tools in the wild. Our pipeline describes how to extract analytical KPIs from extensive log event data involving a mix of user types. The resulting three-page dashboard displays live KPIs, helping analysts understand users, detect exploratory behaviors, plan education interventions, and improve tool features. We propose this case study as a motivation to use the dashboard approach for a more `casual' monitoring of users and building carer mindsets for visualization tools.
AI Key Findings
Get AI-generated insights about this paper's methodology, results, significance, and more — seven facets brought into focus.
Impact
Paper Details
Authors
PDF Preview
Key Terms
Citation Network
Current paper (gray), citations (green), references (blue)
Display is limited for performance on very large graphs.
Discussion 0