Academic Profile
Statistics
Similar Authors
Papers on arXiv
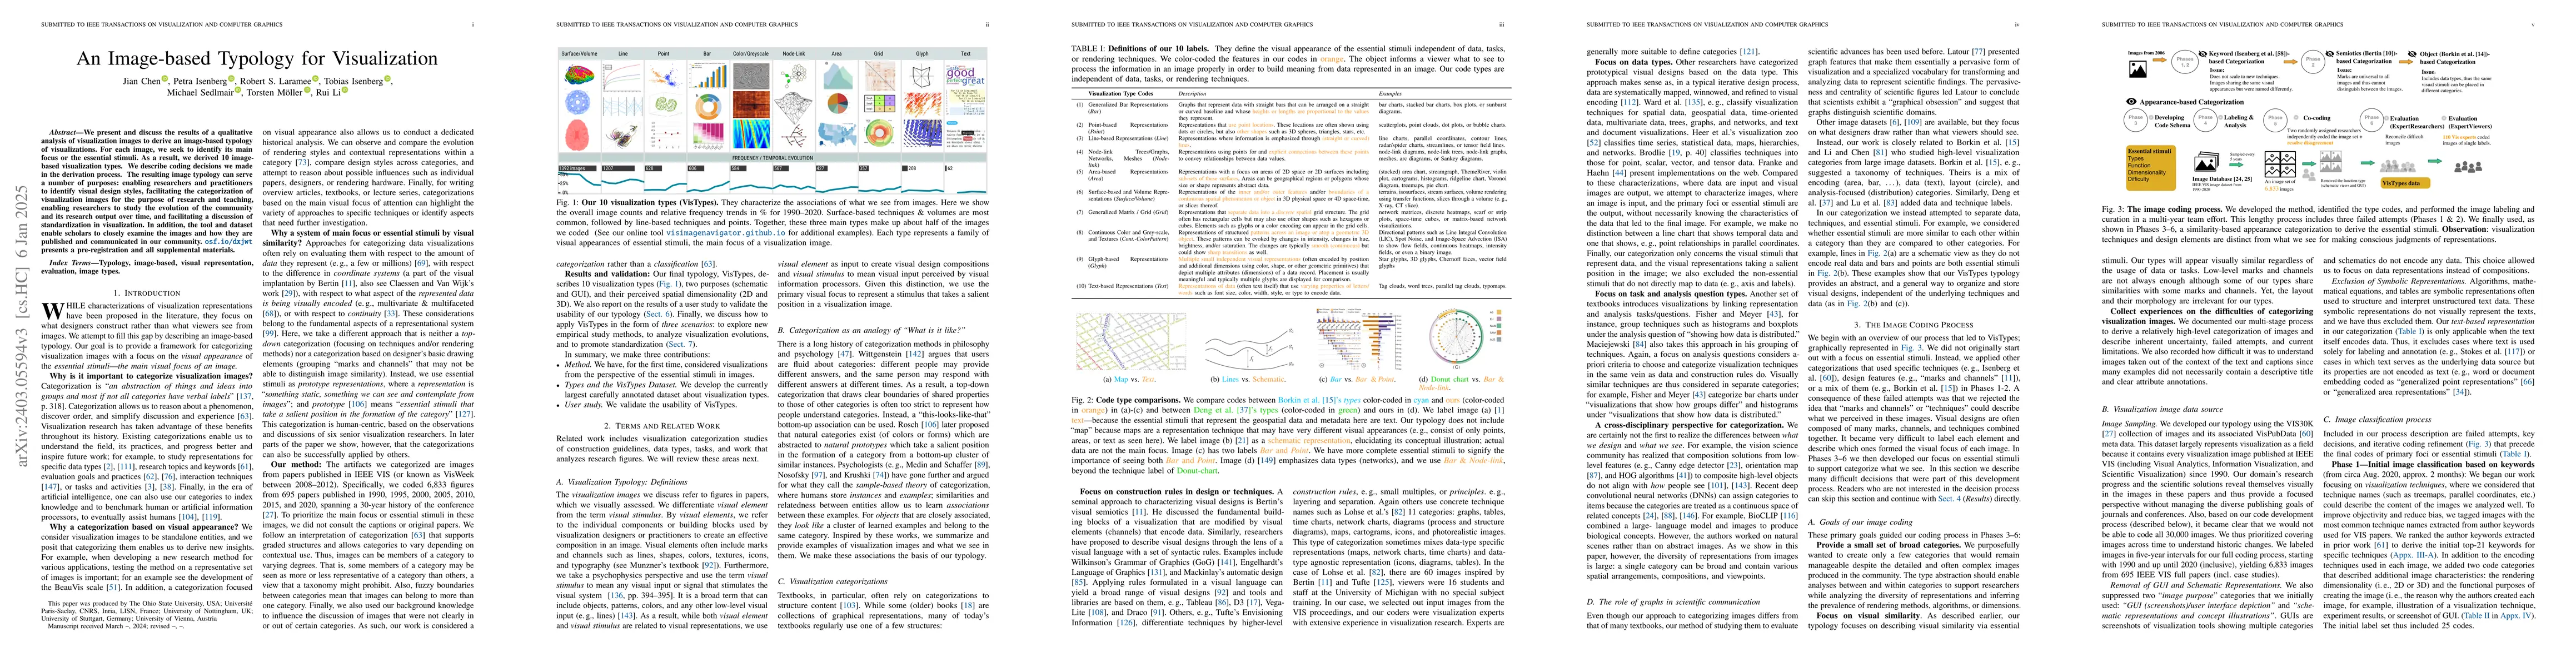
We present and discuss the results of a qualitative analysis of visual representations from images. We labeled each image's essential stimuli, the removal of which would render a visualization unint...
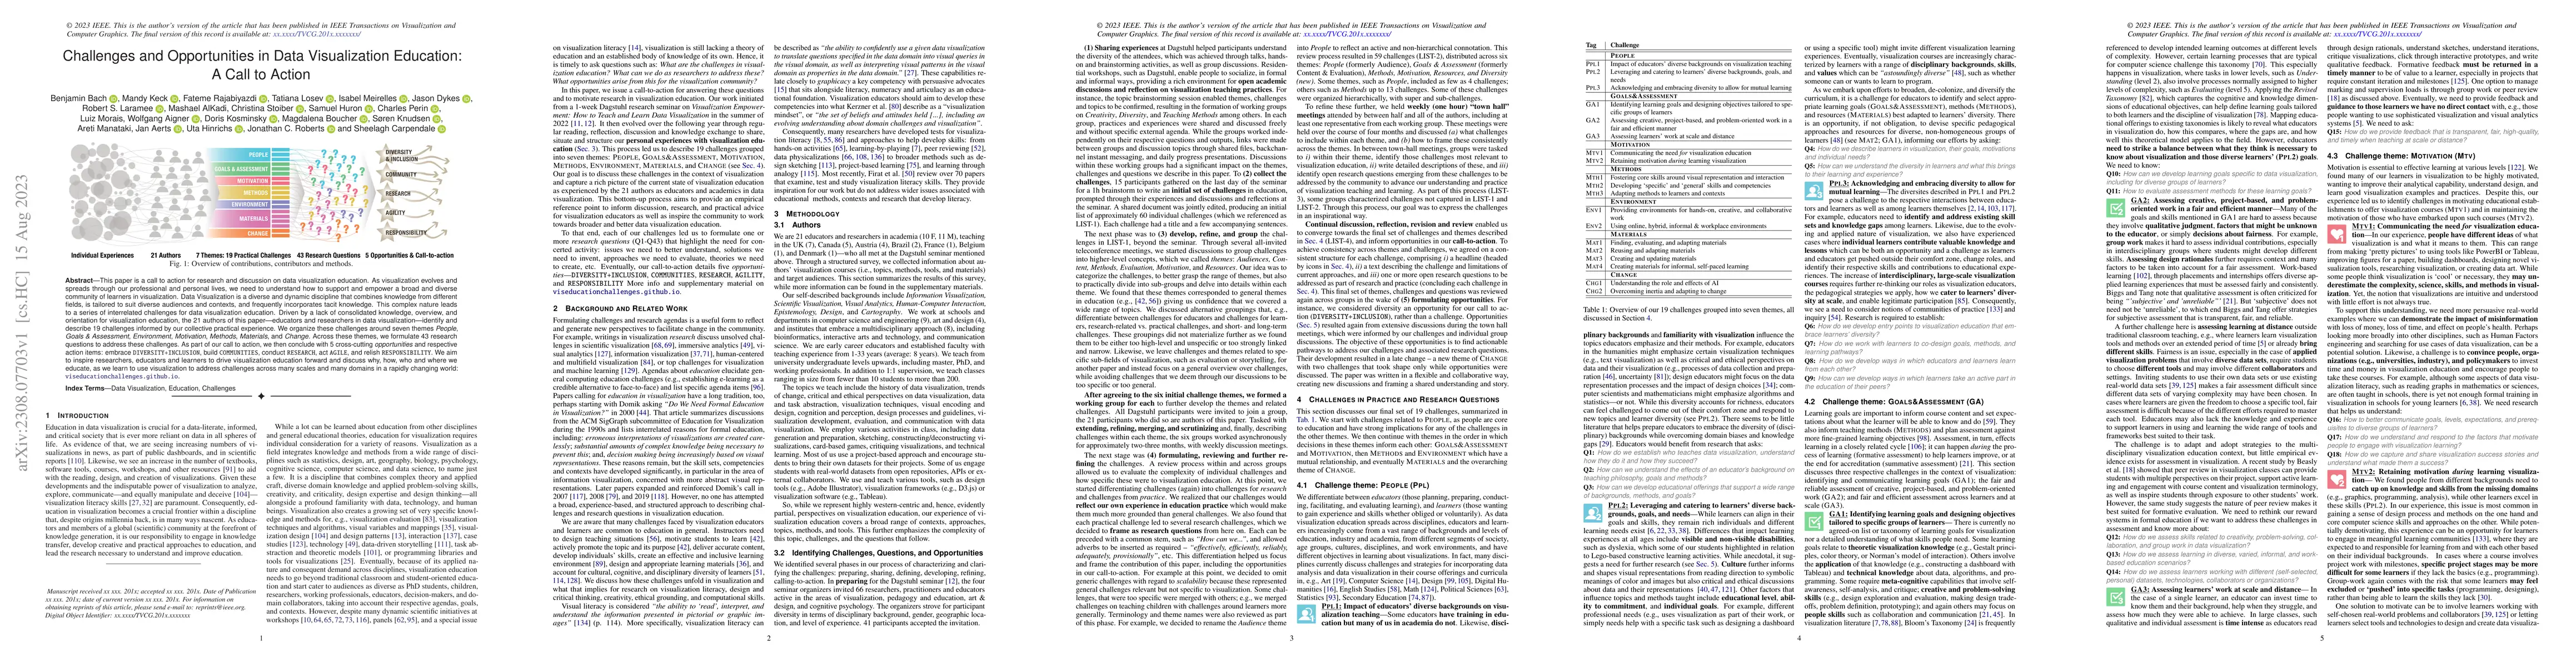
This paper is a call to action for research and discussion on data visualization education. As visualization evolves and spreads through our professional and personal lives, we need to understand ho...
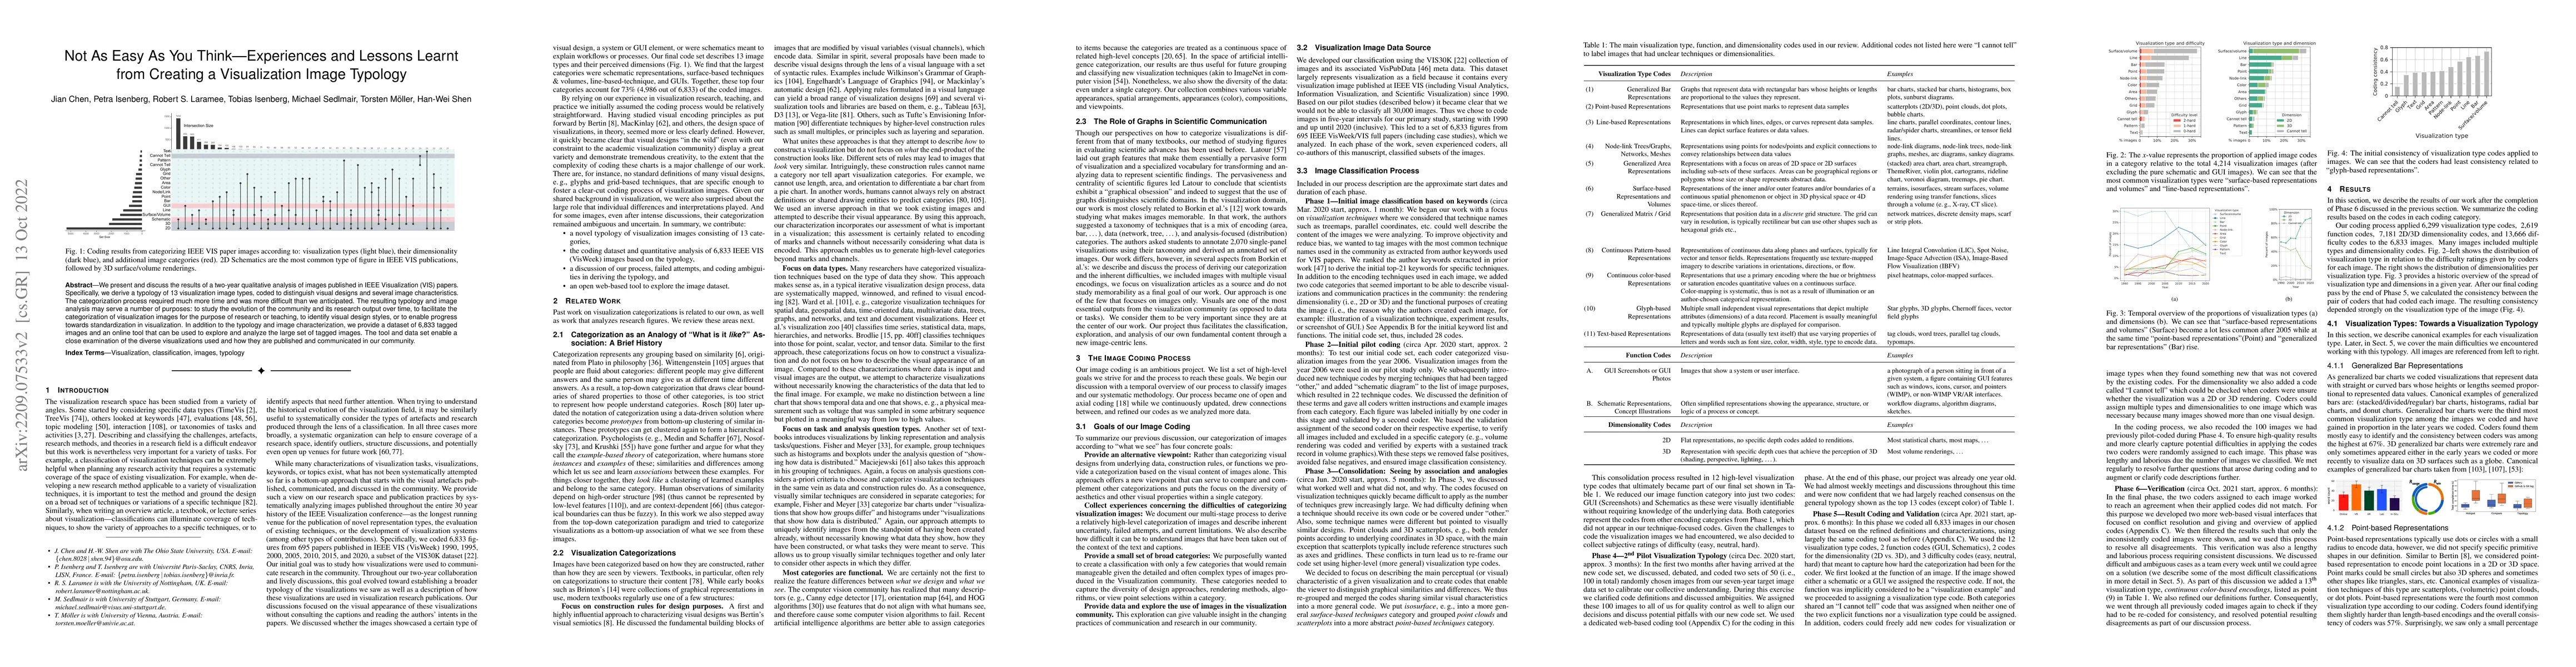
We present and discuss the results of a two-year qualitative analysis of images published in IEEE Visualization (VIS) papers. Specifically, we derive a typology of 13 visualization image types, code...
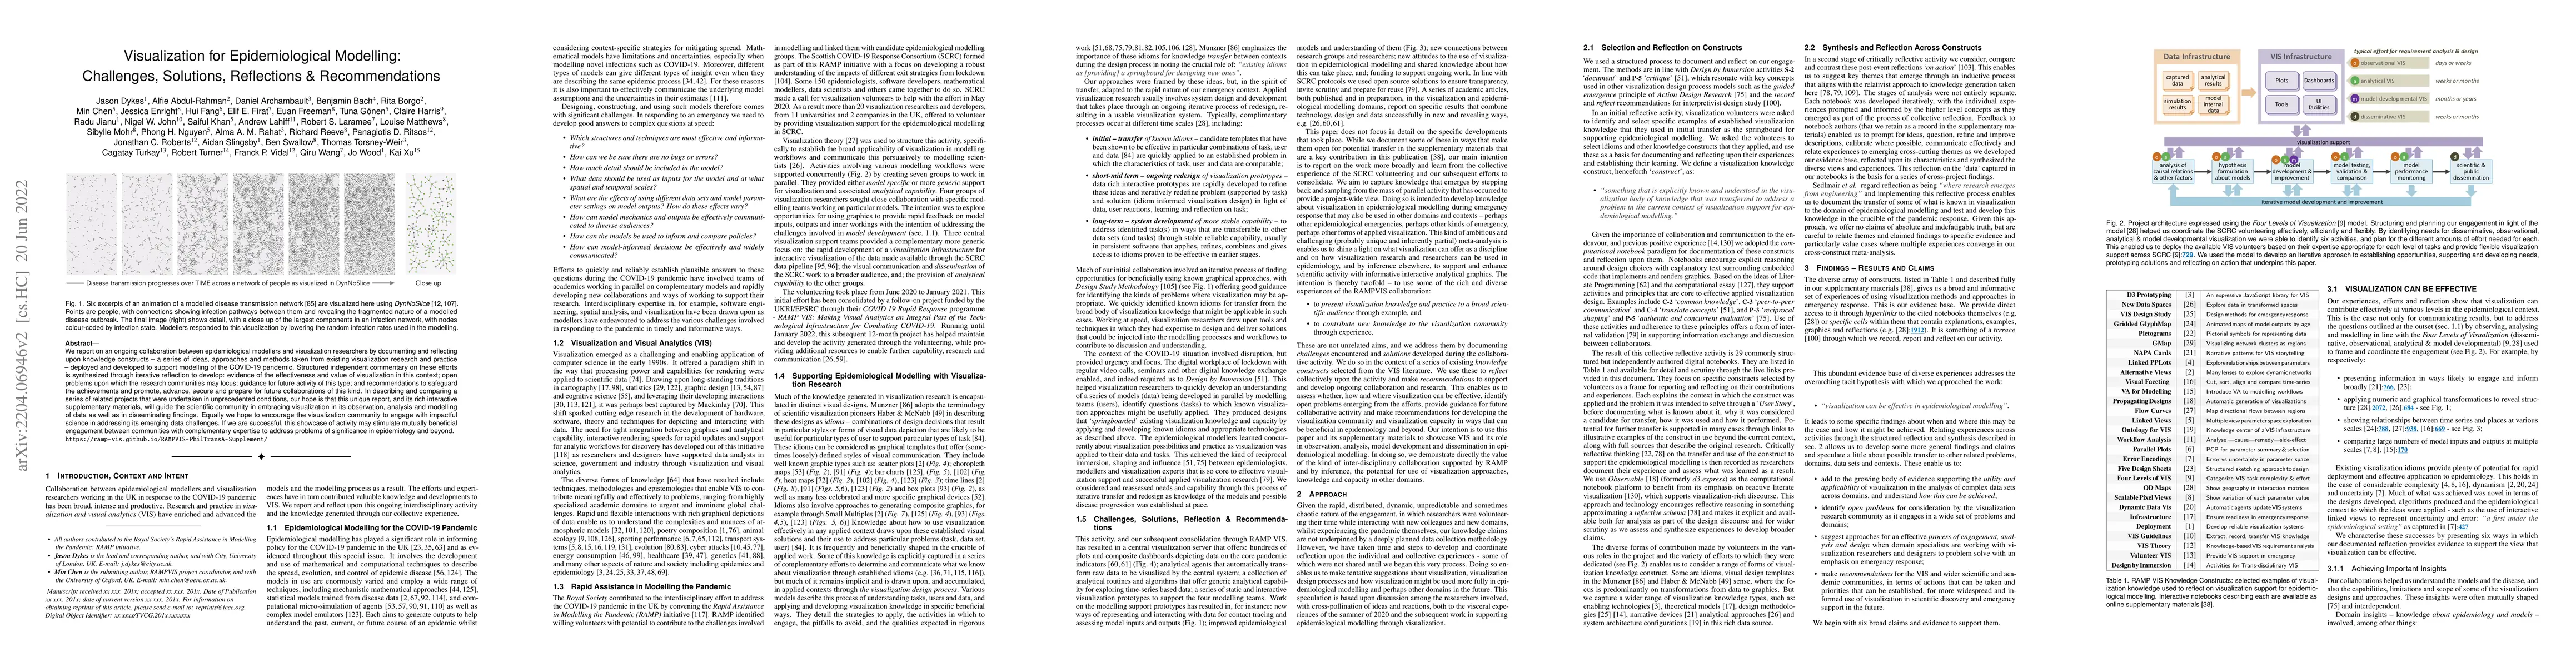
We report on an ongoing collaboration between epidemiological modellers and visualization researchers by documenting and reflecting upon knowledge constructs -- a series of ideas, approaches and met...
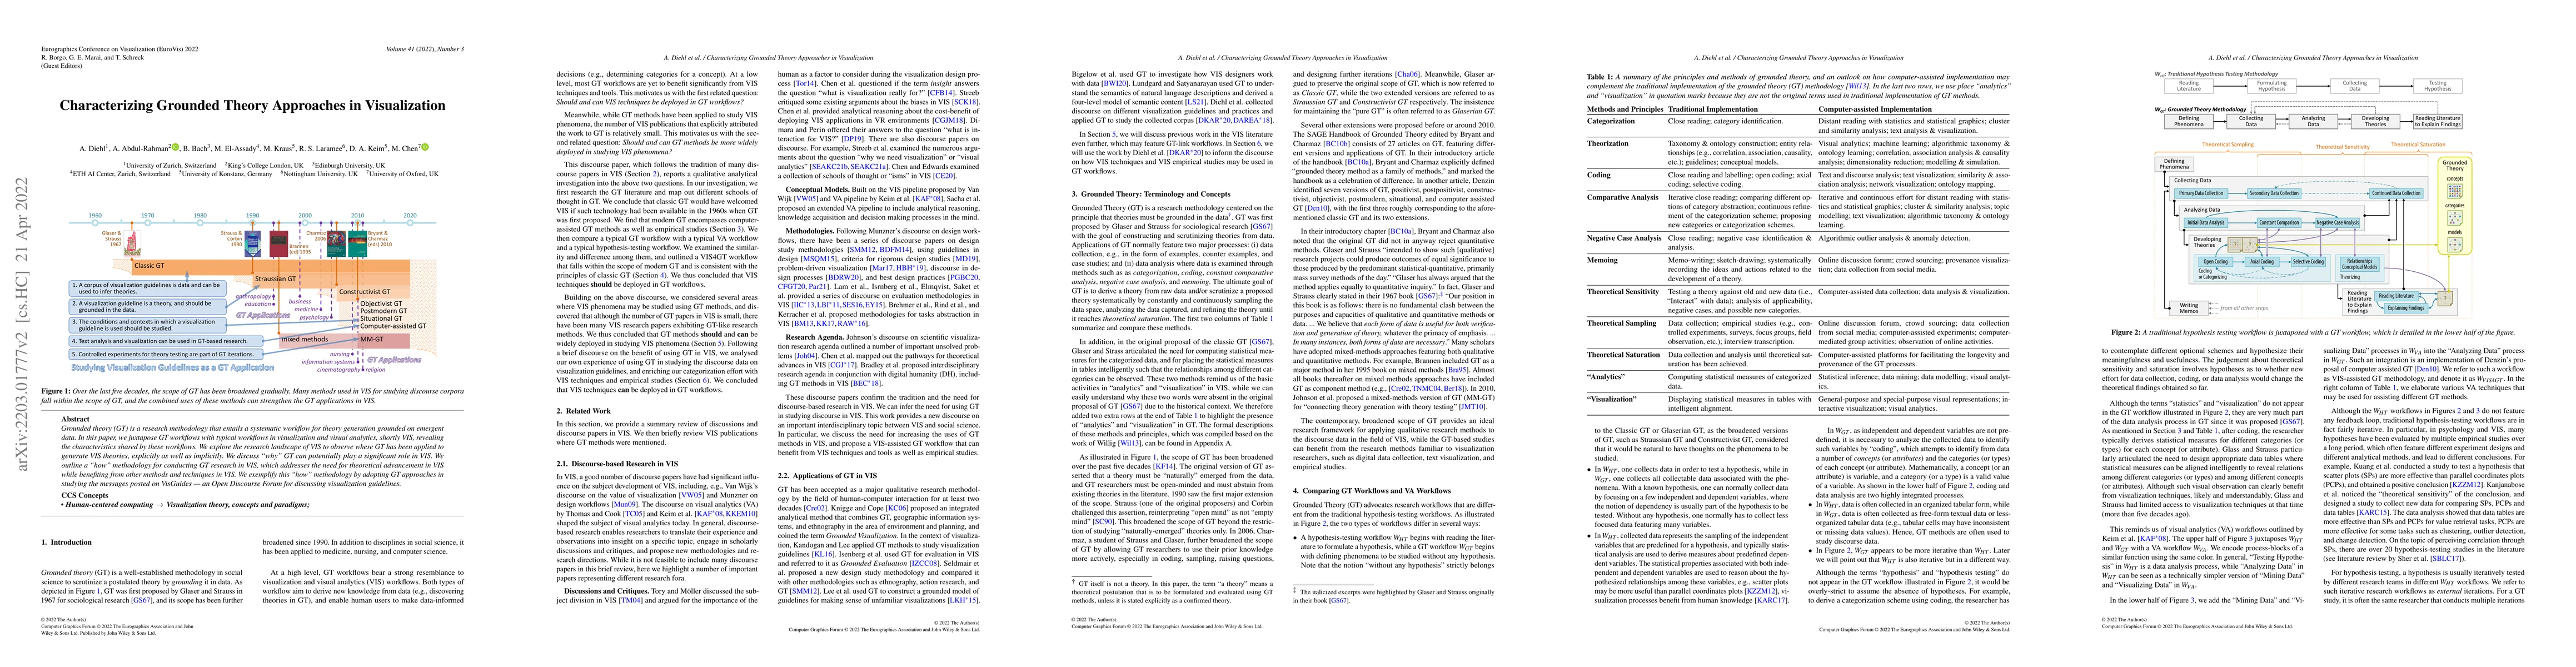
Grounded theory (GT) is a research methodology that entails a systematic workflow for theory generation grounded on emergent data. In this paper, we juxtapose GT workflows with typical workflows in ...
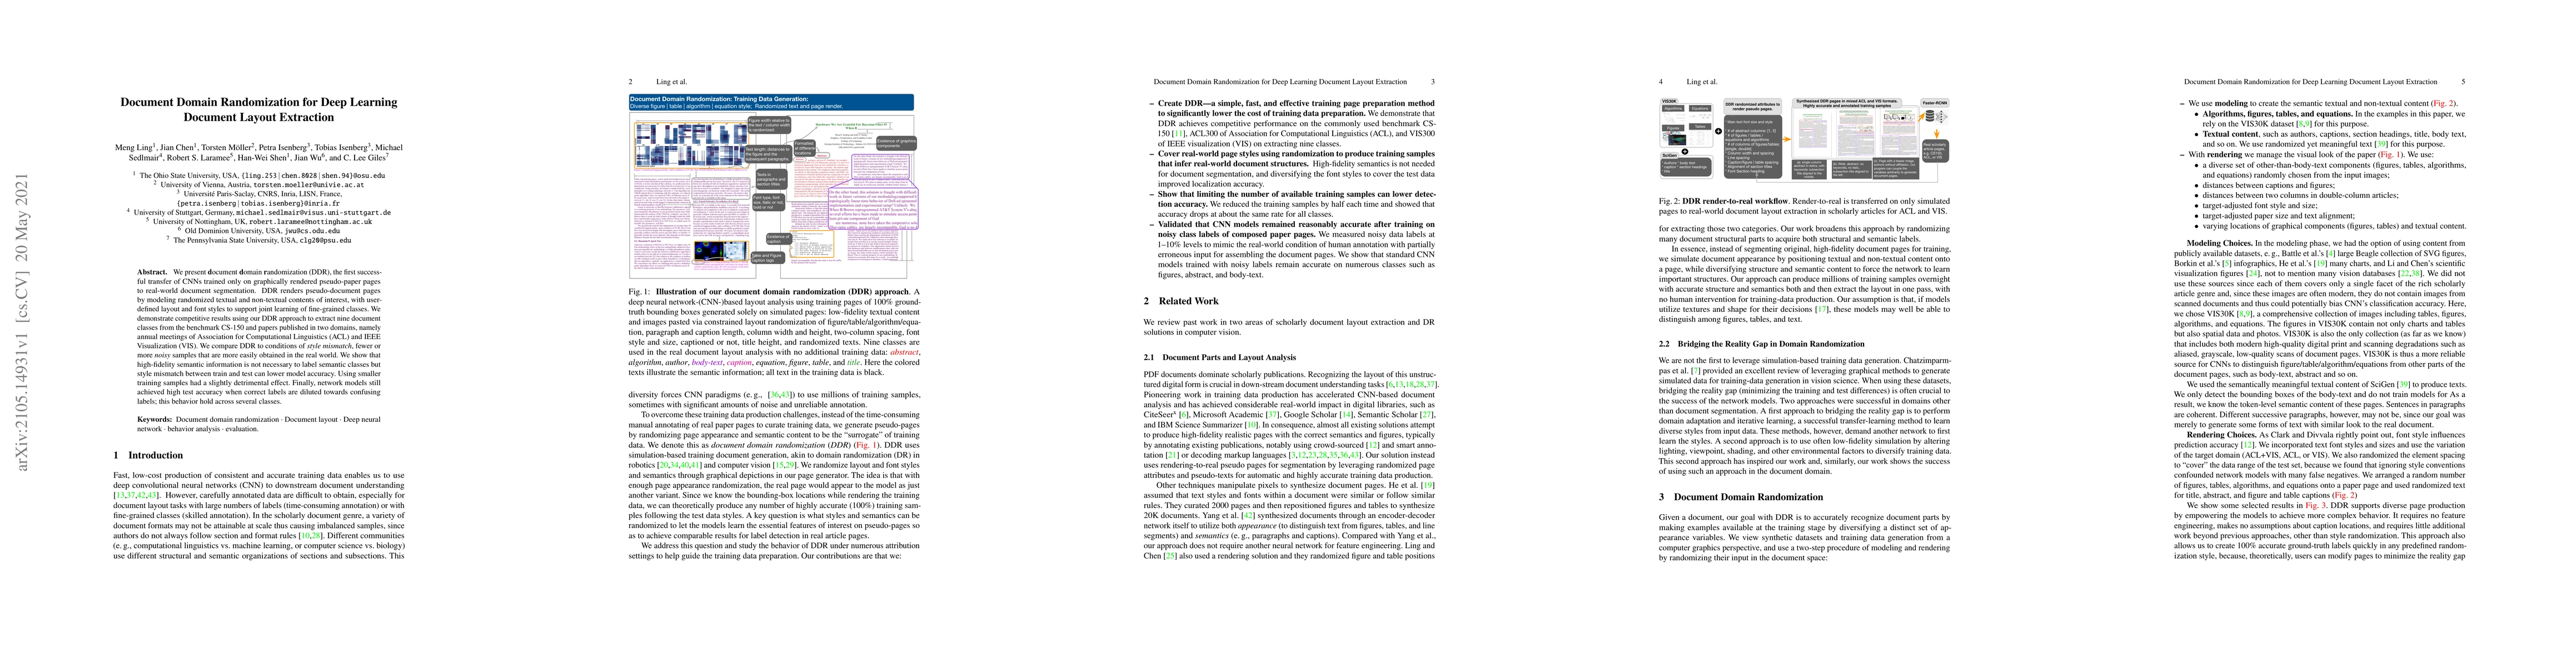
We present document domain randomization (DDR), the first successful transfer of convolutional neural networks (CNNs) trained only on graphically rendered pseudo-paper pages to real-world document s...
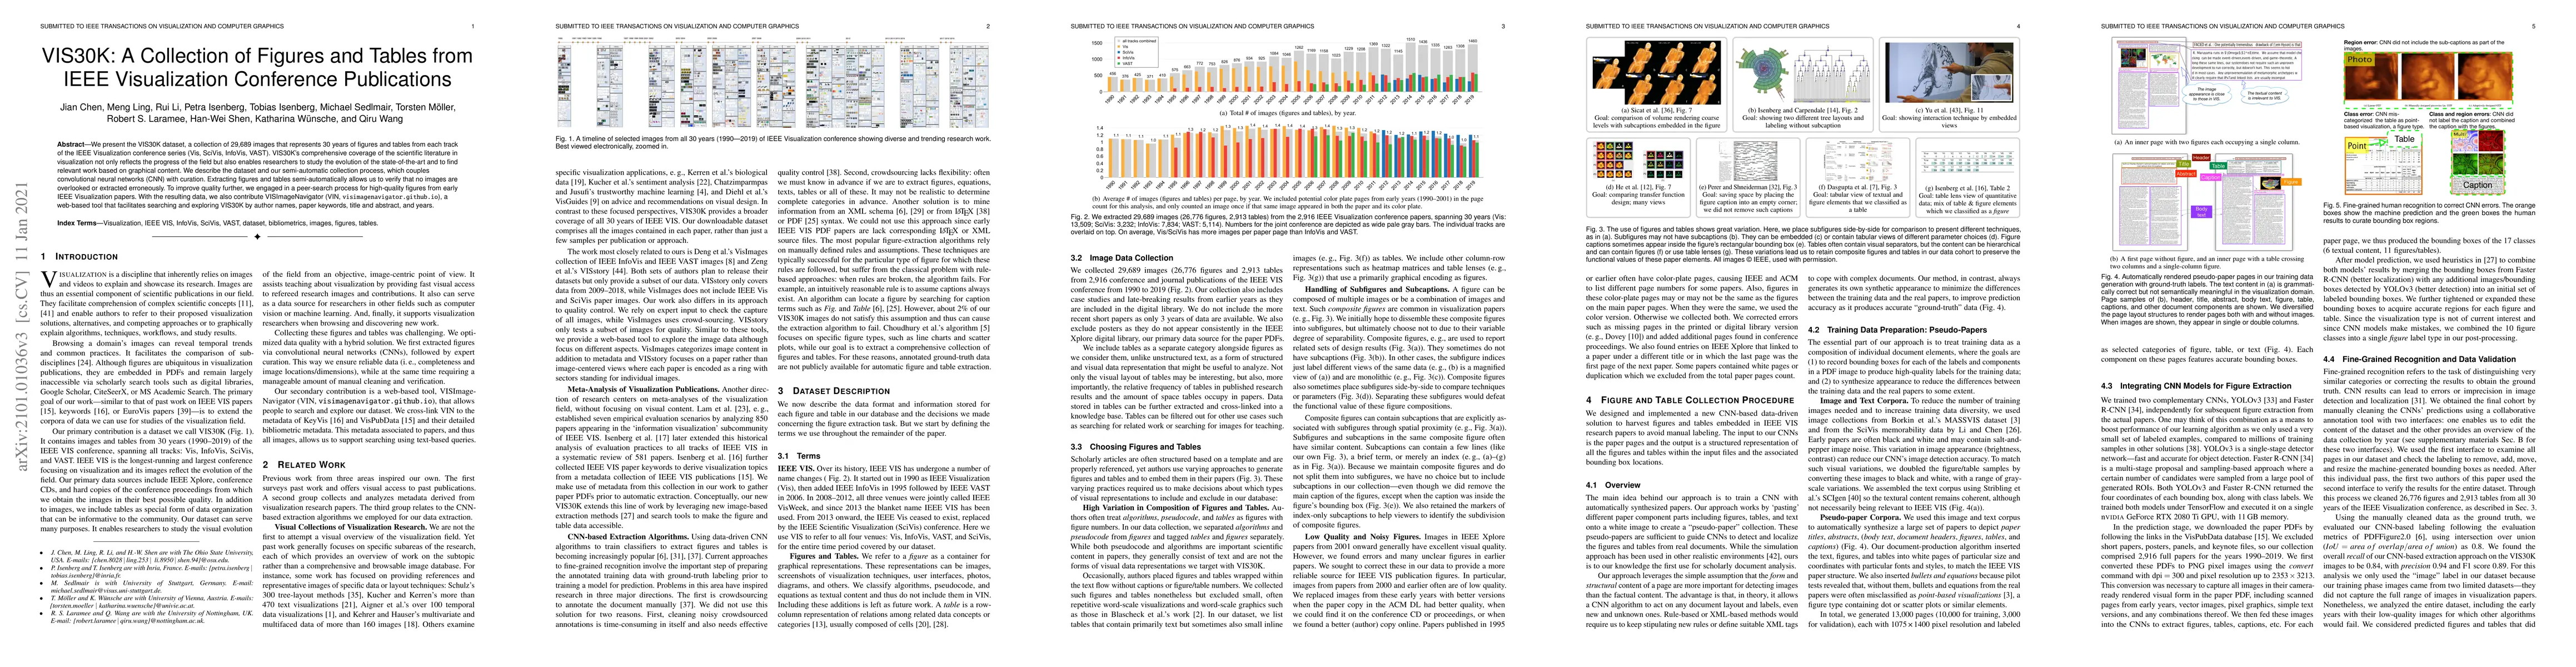
We present the VIS30K dataset, a collection of 29,689 images that represents 30 years of figures and tables from each track of the IEEE Visualization conference series (Vis, SciVis, InfoVis, VAST). ...
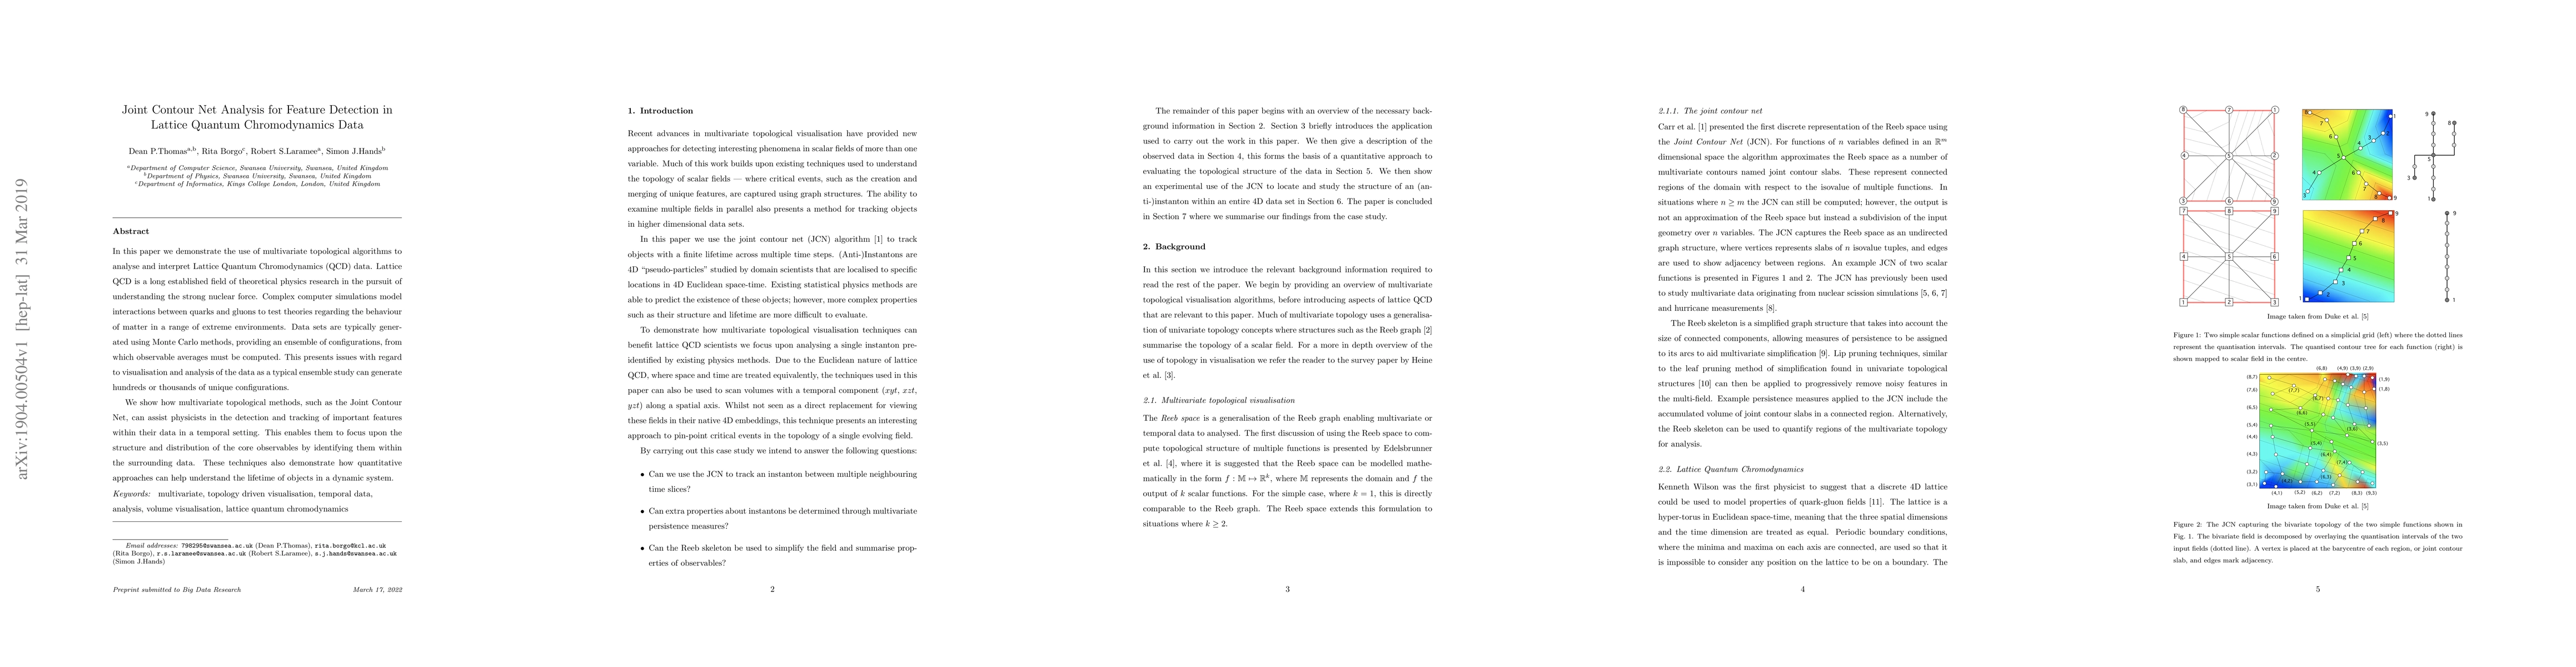
In this paper we demonstrate the use of multivariate topological algorithms to analyse and interpret Lattice Quantum Chromodynamics (QCD) data. Lattice QCD is a long established field of theoretical...
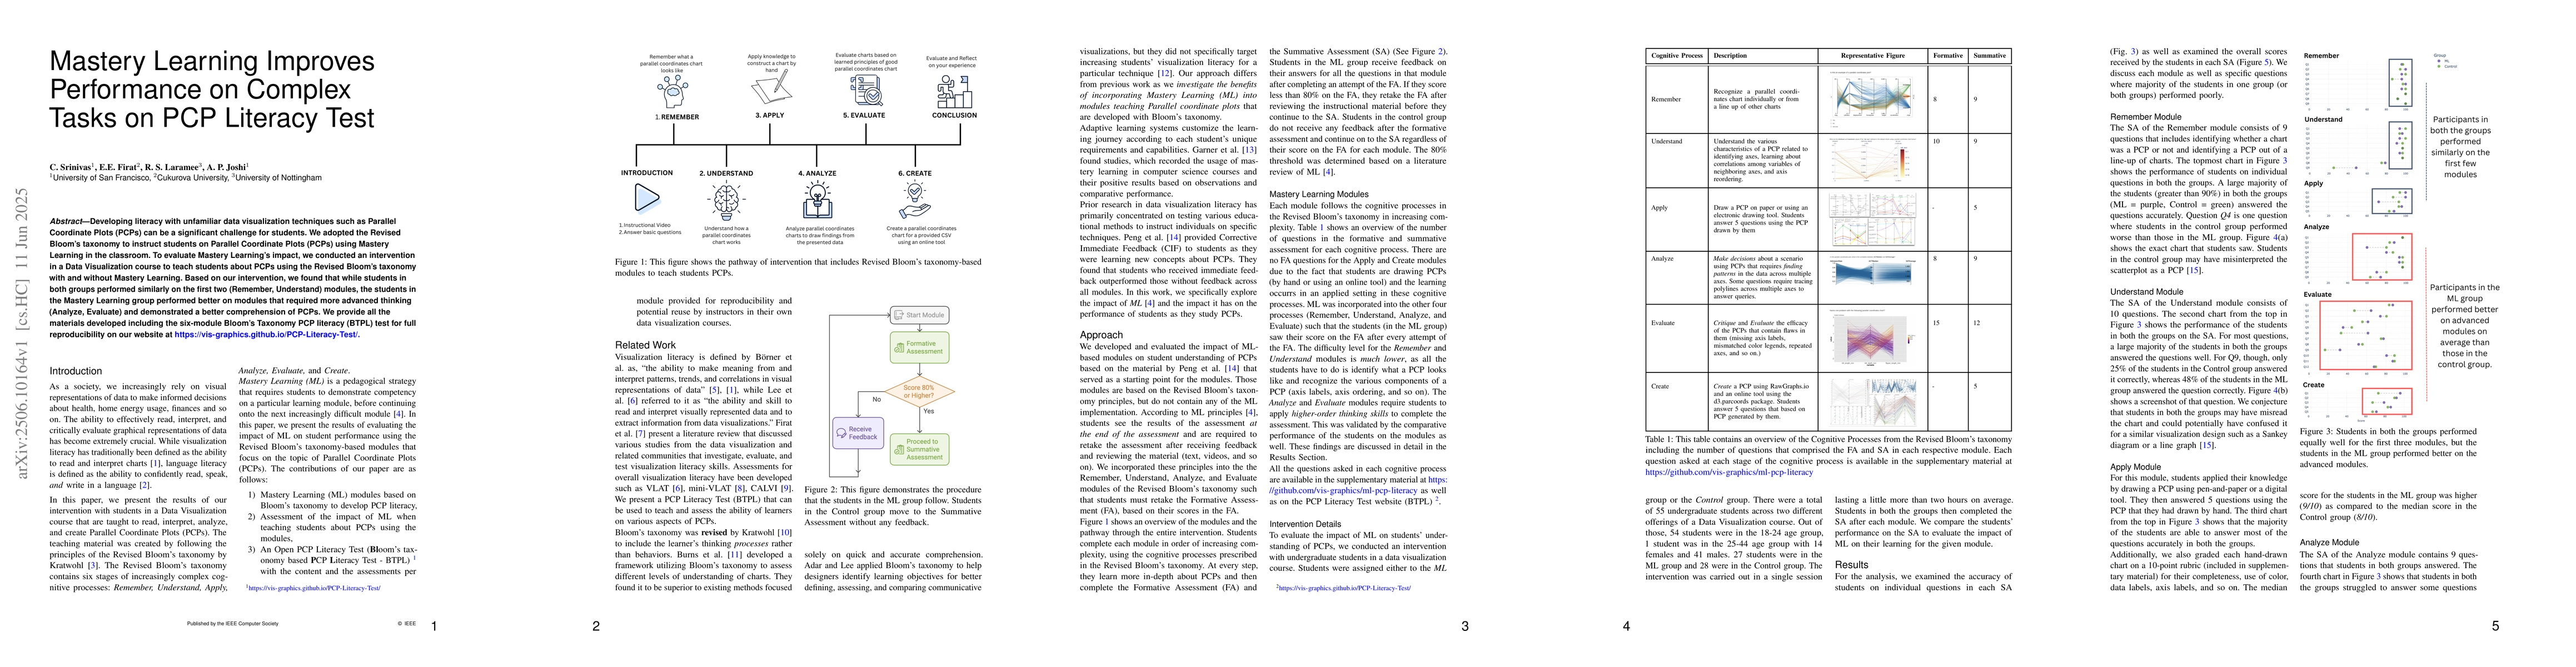
Developing literacy with unfamiliar data visualization techniques such as Parallel Coordinate Plots (PCPs) can be a significant challenge for students. We adopted the Revised Bloom's taxonomy to instr...
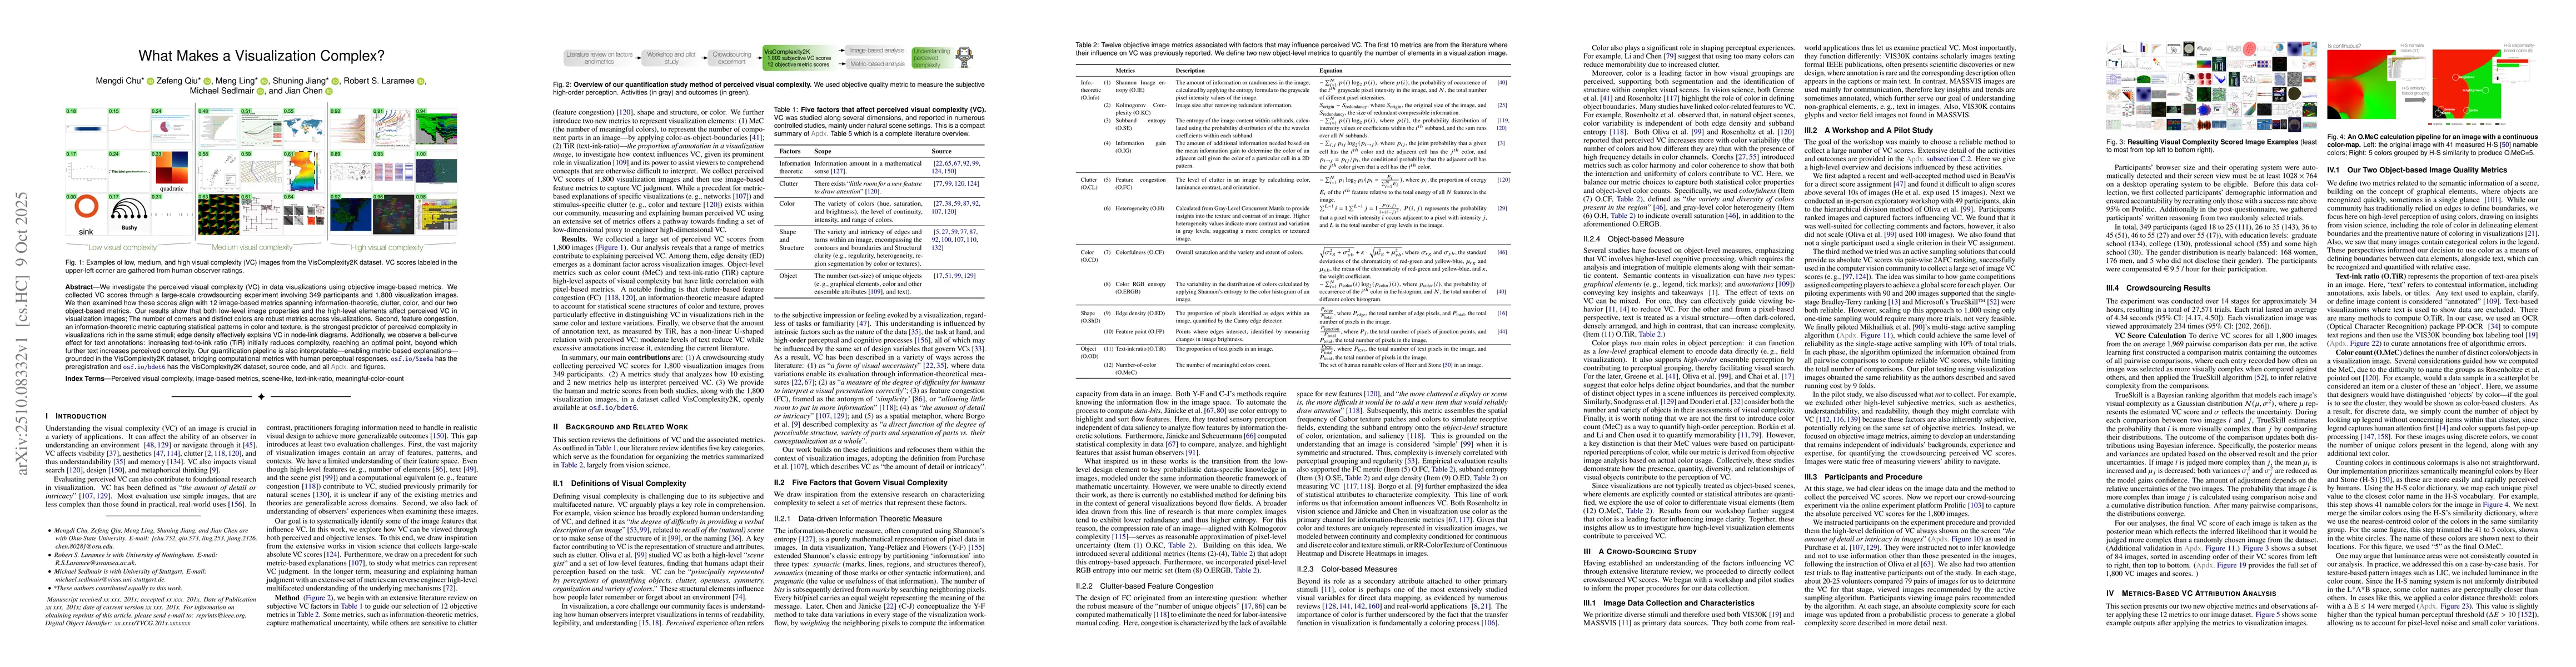
We investigate the perceived visual complexity (VC) in data visualizations using objective image-based metrics. We collected VC scores through a large-scale crowdsourcing experiment involving 349 part...