The VIS30K dataset comprises 29,689 figures and tables from IEEE Visualization conference publications, spanning 30 years and utilizing a semi-automatic collection process involving CNNs and curation. It also includes VISImageNavigator, a web tool for exploring the dataset based on various metadata.
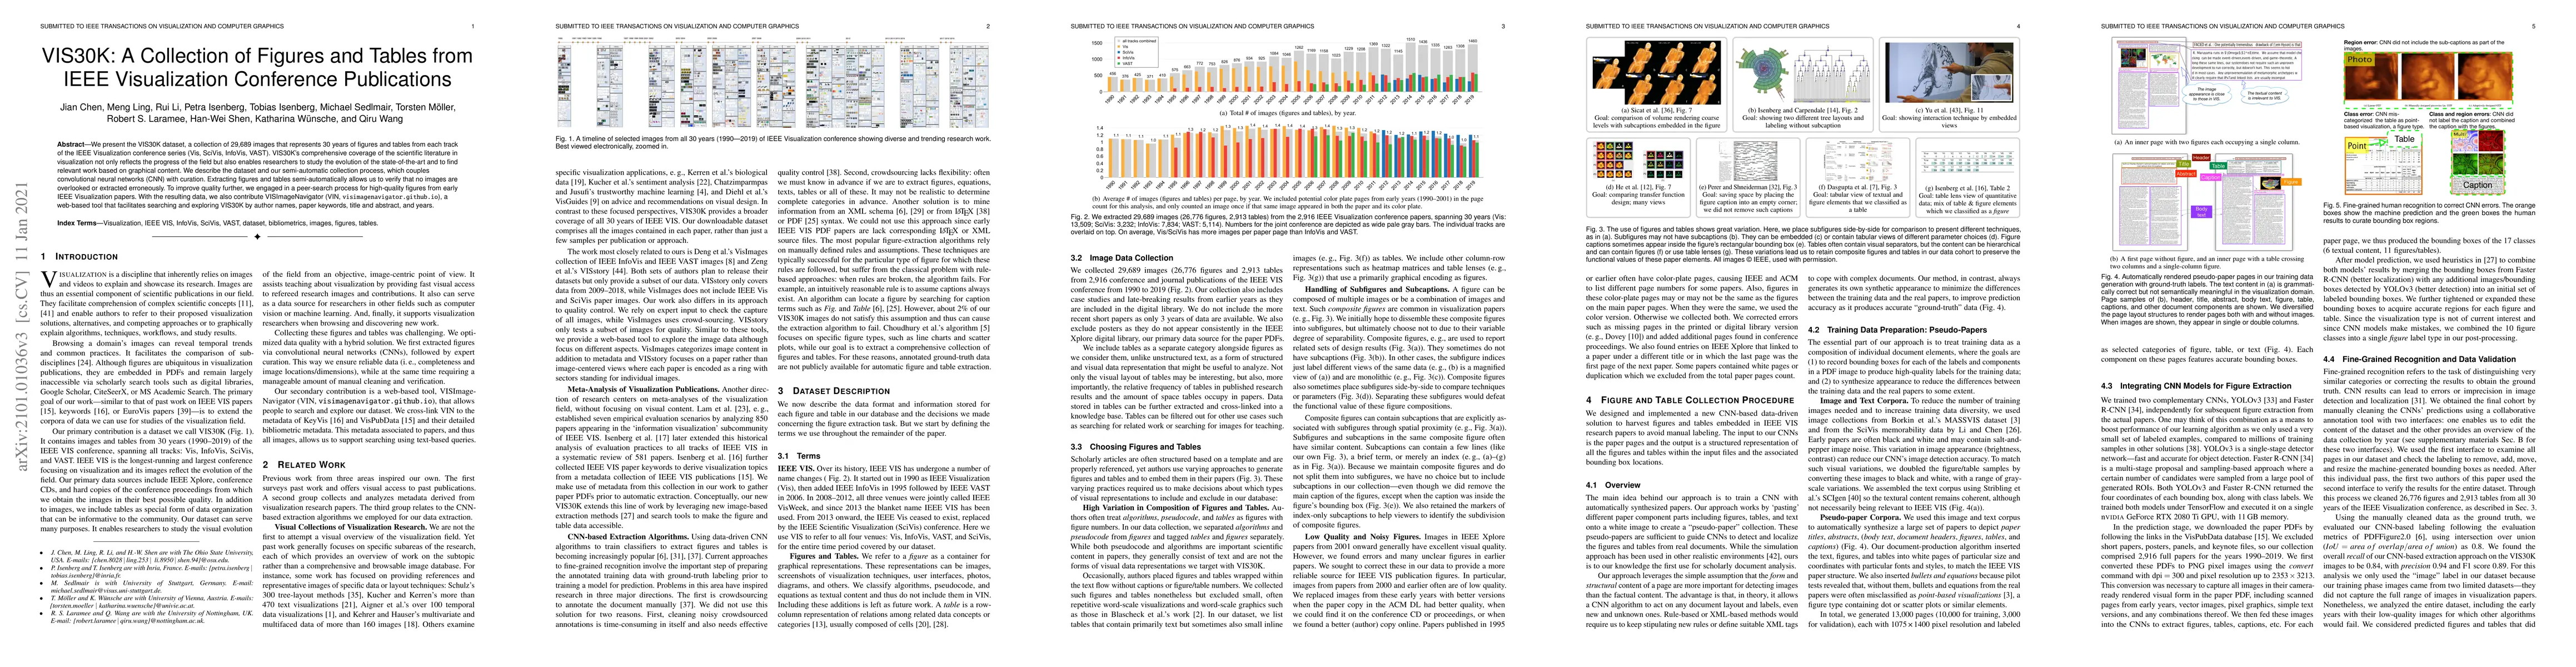
We present the VIS30K dataset, a collection of 29,689 images that represents 30 years of figures and tables from each track of the IEEE Visualization conference series (Vis, SciVis, InfoVis, VAST). VIS30K's comprehensive coverage of the scientific literature in visualization not only reflects the progress of the field but also enables researchers to study the evolution of the state-of-the-art and to find relevant work based on graphical content. We describe the dataset and our semi-automatic collection process, which couples convolutional neural networks (CNN) with curation. Extracting figures and tables semi-automatically allows us to verify that no images are overlooked or extracted erroneously. To improve quality further, we engaged in a peer-search process for high-quality figures from early IEEE Visualization papers. With the resulting data, we also contribute VISImageNavigator (VIN, visimagenavigator.github.io), a web-based tool that facilitates searching and exploring VIS30K by author names, paper keywords, title and abstract, and years.
Get AI-generated insights about this paper's methodology, results, and significance.
Current paper (gray), citations (green), references (blue)
Jian Chen, Tobias Isenberg, Michael Sedlmair et al.
Title | Authors | Year | Actions |
---|---|---|---|
IntelliCircos: A Data-driven and AI-powered Authoring Tool for Circos Plots
|
Mingyang Gu, Jiamin Zhu, Qipeng Wang, Fengjie Wang, Xiaolin Wen, Yong Wang, Min Zhu
|
2025
|
View Paper |
ZuantuSet: A Collection of Historical Chinese Visualizations and Illustrations
|
Xiyao Mei, Yu Zhang, Chaofan Yang, Ruizhe Shi, Xiao-Hui Yuan
|
2025
|
View Paper |
VisAnatomy: An SVG Chart Corpus with Fine-Grained Semantic Labels
|
Chen Chen, Hannah K. Bako, Peihong Yu, John Hooker, Jeffrey Joyal, Simon C. Wang, Samuel Kim, Jessica Wu, Aoxue Ding, Lara Sandeep, Alex Chen, Chayanika Sinha, Zhicheng Liu
|
2024
|
View Paper |
Advancing Multimodal Large Language Models in Chart Question Answering with Visualization-Referenced Instruction Tuning
|
Xingchen Zeng, Haichuan Lin, Yilin Ye, Wei Zeng
|
2024
|
View Paper |
Datasets of Visualization for Machine Learning
|
Can Liu, Ruike Jiang, Shaocong Tan, Jiacheng Yu, Chaofan Yang, Hanning Shao, Xiaoru Yuan
|
2024
|
View Paper |
The Language of Infographics: Toward Understanding Conceptual Metaphor Use in Scientific Storytelling
|
Hana Pokojná, Tobias Isenberg, Stefan Bruckner, B. Kozlíková, L. Garrison
|
2024
|
View Paper |
FlowLearn: Evaluating Large Vision-Language Models on Flowchart Understanding
|
Huitong Pan, Qi Zhang, Cornelia Caragea, E. Dragut, Longin Jan Latecki
|
2024
|
View Paper |
V-RECS, a Low-Cost LLM4VIS Recommender with Explanations, Captioning and Suggestions
|
L. Podo, M. Angelini, Paola Velardi
|
2024
|
View Paper |
Deep Pre-Training Transformers for Scientific Paper Representation
|
Jihong Wang, Zhiguang Yang, Zhanglin Cheng
|
2024
|
View Paper |
Generative AI for Visualization: State of the Art and Future Directions
|
Yilin Ye, Jianing Hao, Yihan Hou, Zhan Wang, Shishi Xiao, Yuyu Luo, Wei Zeng
|
2024
|
View Paper |
KG-PRE-view: Democratizing a TVCG Knowledge Graph through Visual Explorations
|
Yamei Tu, Rui Qiu, Han-Wei Shen
|
2024
|
View Paper |
From Detection to Application: Recent Advances in Understanding Scientific Tables and Figures
|
Jiani Huang, Haihua Chen, Fengchang Yu, Wei Lu
|
2024
|
View Paper |
An Image-based Typology for Visualization
|
Jian Chen, Petra Isenberg, R. Laramee, Tobias Isenberg, Michael Sedlmair, Torsten Moeller, Rui Li
|
2024
|
View Paper |
A Comparative Study on Fixed-Order Event Sequence Visualizations: Gantt, Extended Gantt, and Stringline Charts
|
Junxiu Tang, Fumeng Yang, Jiang Wu, Yifang Wang, Jiayi Zhou, Xiwen Cai, Lingyun Yu, Yingcai Wu
|
2024
|
View Paper |
How “Applied” is Fifteen Years of VAST conference?
|
Lei Shi, Lei Xia, Zipeng Liu, Ye Sun, Huijie Guo, Klaus Mueller
|
2023
|
View Paper |
Enabling Multimodal User Interactions for Genomics Visualization Creation
|
Qianwen Wang, Xiao Liu, Man Qing Liang, S. L’Yi, Nils Gehlenborg
|
2023
|
View Paper |
OldVisOnline: Curating a Dataset of Historical Visualizations
|
Yu Zhang, Ruike Jiang, Liwenhan Xie, Yuheng Zhao, Can Liu, Tianhong Ding, Siming Chen, Xiaoru Yuan
|
2023
|
View Paper |
Eleven Years of Gender Data Visualization: A Step Towards More Inclusive Gender Representation
|
Florent Cabric, M. Bjarnadóttir, Meng-Ying Ling, Guðbjörg Linda Rafnsdóttir, Petra Isenberg
|
2023
|
View Paper |
Over the rainbow: An in-depth examination of the pervasiveness of the rainbow colour scheme
|
I. Gołębiowska, A. Çöltekin
|
2023
|
View Paper |
: A Visual Analytics Approach for Understanding the Dual Frontiers of Science and Technology
|
Yifang Wang, Yifan Qian, Xiaoyu Qi, Nan Cao, Dashun Wang
|
2023
|
View Paper |
InvVis: Large-Scale Data Embedding for Invertible Visualization
|
Huayuan Ye, Chenhui Li, Yang Li, Changbo Wang
|
2023
|
View Paper |
Enhancing biomedical search interfaces with images
|
Juan Trelles Trabucco, C. Arighi, H. Shatkay, G. Marai
|
2023
|
View Paper |
Toward a Scalable Census of Dashboard Designs in the Wild: A Case Study with Tableau Public
|
Joanna Purich, Arjun Srinivasan, M. Correll, L. Battle, V. Setlur, Anamaria Crisan
|
2023
|
View Paper |
UniChart: A Universal Vision-language Pretrained Model for Chart Comprehension and Reasoning
|
Ahmed Masry, P. Kavehzadeh, Do Xuan Long, Enamul Hoque, Shafiq R. Joty
|
2023
|
View Paper |
Towards accessible chart visualizations for the non-visuals: Research, applications and gaps
|
Mandhatya Singh, Muhammad Suhaib Kanroo, Hadia Showkat Kawoosa, Puneet Goyal
|
2023
|
View Paper |
What is the message? Perspectives on Visual Data Communication
|
Laura Koesten, Kathleen Gregory, Regina Schuster, Christian Knoll, Sarah Davies, T. Möller
|
2023
|
View Paper |
How we see time – the evolution and current state of visualizations of temporal data
|
Verena Klasen, E. Bogucka, L. Meng, J. Krisp
|
2023
|
View Paper |
Visualization Resources: A Survey
|
Xiaoxiao Liu, Mohammad Alharbi, Jing Chen, A. Diehl, Dylan Rees, Elif E. Firat, Qiru Wang, R. Laramee
|
2023
|
View Paper |
VISAtlas: An Image-Based Exploration and Query System for Large Visualization Collections via Neural Image Embedding
|
Yilin Ye, Rong Huang, Weizhen Zeng
|
2022
|
View Paper |
What’s wrong with the rainbow? An interdisciplinary review of empirical evidence for and against the rainbow color scheme in visualizations
|
I. Gołębiowska, A. Çöltekin
|
2022
|
View Paper |
GraphDecoder: Recovering Diverse Network Graphs From Visualization Images via Attention-Aware Learning
|
Sicheng Song, Chenhui Li, Dong Li, Juntong Chen, Changbo Wang
|
2022
|
View Paper |
VAID: Indexing View Designs in Visual Analytics System
|
Lu Ying, Aoyu Wu, Haotian Li, Zikun Deng, Ji Lan, Jiang Wu, Yong Wang, Huamin Qu, Dazhen Deng, Yingcai Wu
|
2022
|
View Paper |
MedChemLens: An Interactive Visual Tool to Support Direction Selection in Interdisciplinary Experimental Research of Medicinal Chemistry
|
Chuhan Shi, Fei Nie, Yicheng Hu, Yige Xu, Lei Chen, Xiaojuan Ma, Qiong Luo
|
2022
|
View Paper |
Attention is All They Need: Exploring the Media Archaeology of the Computer Vision Research Paper
|
Sam Goree, G. Appleby, David J. Crandall, Norman Su
|
2022
|
View Paper |
Not As Easy As You Think - Experiences and Lessons Learnt from Trying to Create a Bottom-Up Visualization Image Typology
|
Jian Chen, Petra Isenberg, R. Laramee, Tobias Isenberg, M. Sedlmair, Torsten Moeller, Han-Wei Shen
|
2022
|
View Paper |
Thirty-Two Years of IEEE VIS: Authors, Fields of Study and Citations
|
Hongtao Hao, Yumian Cui, Zhengxiang Wang, Yea-Seul Kim
|
2022
|
View Paper |
Chart Question Answering: State of the Art and Future Directions
|
Enamul Hoque, P. Kavehzadeh, Ahmed Masry
|
2022
|
View Paper |
Accessibility for Color Vision Deficiencies: Challenges and Findings of a Large Scale Study on Paper Figures
|
Katrin Angerbauer, Nils Rodrigues, René Cutura, Seyda Öney, Nelusa Pathmanathan, C. Morariu, D. Weiskopf, M. Sedlmair
|
2022
|
View Paper |
Revisiting the Design Patterns of Composite Visualizations
|
Dazhen Deng, Weiwei Cui, Xiyu Meng, Mengye Xu, Yu Liao, Haidong Zhang, Yingcai Wu
|
2022
|
View Paper |
In Defence of Visual Analytics Systems: Replies to Critics
|
Aoyu Wu, Dazhen Deng, Furui Cheng, Yingcai Wu, Shixia Liu, Huamin Qu
|
2022
|
View Paper |
Modeling layout design for multiple-view visualization via Bayesian inference
|
Lingdan Shao, Zhe Chu, Xi Chen, Yanna Lin, Wei Zeng
|
2021
|
View Paper |
KG4Vis: A Knowledge Graph-Based Approach for Visualization Recommendation
|
Haotian Li, Yong Wang, Songheng Zhang, Yangqiu Song, Huamin Qu
|
2021
|
View Paper |
Visualization Resources: A Starting Point
|
Xiaoxiao Liu, Mohammad Alharbi, Joe Best, Jian Chen, A. Diehl, Elif E. Firat, Dylan Rees, Qiru Wang, R. Laramee
|
2021
|
View Paper |
Document Domain Randomization for Deep Learning Document Layout Extraction
|
Meng Ling, Jian Chen, Torsten Moller, Petra Isenberg, Tobias Isenberg, M. Sedlmair, R. Laramee, Han-Wei Shen, Jian Wu, C. Lee Giles
|
2021
|
View Paper |
VisImages: A Fine-Grained Expert-Annotated Visualization Dataset
|
Dazhen Deng, Yihong Wu, Xinhuan Shu, Jiang Wu, Siwei Fu, Weiwei Cui, Yingnian Wu
|
2020
|
View Paper |
Activity report
|
Journal Manager Jffn
|
2019
|
View Paper |
A Systematic Review of Visualization Recommendation Systems: Goals, Strategies, Interfaces, and Evaluations
|
Zehua Zeng, Leilani Battle
|
2024
|
View Paper |
VisImages: A Corpus of Visualizations in the Images of Visualization Publications
|
Dazhen Deng, Yihong Wu, Xinhuan Shu, Jiang Wu, Mengye Xu, Siwei Fu, Weiwei Cui, Yingcai Wu
|
2021
|
View Paper |
Comments (0)