ArxivLens
T
Researcher

Torsten Möller

30 papers on arXiv

30 arXiv Papers
20 Total Publications
Profile

Academic Profile

Name T. Möller
Total Papers 20
Scholar Profile View on Semantic Scholar
Metrics

Statistics

30 arXiv Papers
20 Total Publications
Publications

Papers on arXiv

Thumbnail for Toward a deeper understanding of Visualization through keyword analysis
arXiv
Toward a deeper understanding of Visualization through keyword analysis

We present the results of a comprehensive analysis of visualization paper keywords supplied for 4366 papers submitted to five main visualization conferences. We describe main keywords, topic areas, ...

Thumbnail for Tensions between Preference and Performance: Designing for Visual
  Exploration of Multi-frequency Medical Network Data
arXiv
Tensions between Preference and Performance: Designing for Visual Exploration of Multi-frequency Medical Network Data

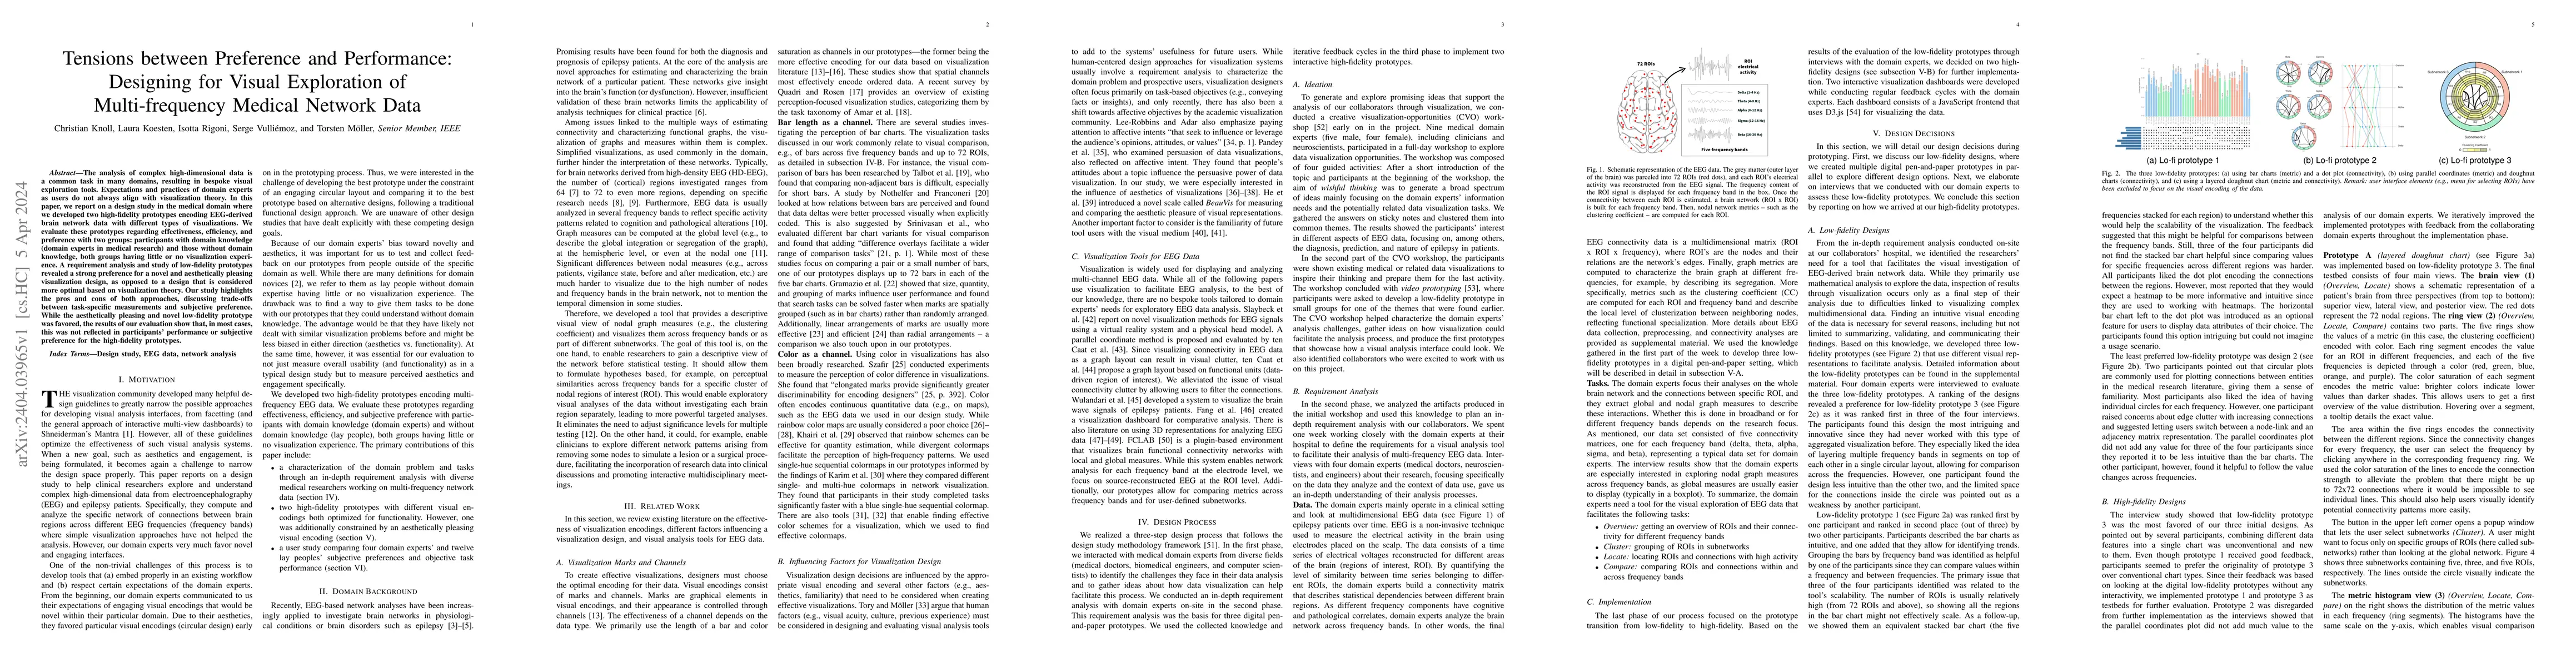
The analysis of complex high-dimensional data is a common task in many domains, resulting in bespoke visual exploration tools. Expectations and practices of domain experts as users do not always ali...

Thumbnail for Information That Matters: Exploring Information Needs of People Affected
  by Algorithmic Decisions
arXiv
Information That Matters: Exploring Information Needs of People Affected by Algorithmic Decisions

Explanations of AI systems rarely address the information needs of people affected by algorithmic decision-making (ADM). This gap between conveyed information and information that matters to affecte...

Thumbnail for Data journeys in popular science: Producing climate change and COVID-19
  data visualizations at Scientific American
arXiv
Data journeys in popular science: Producing climate change and COVID-19 data visualizations at Scientific American

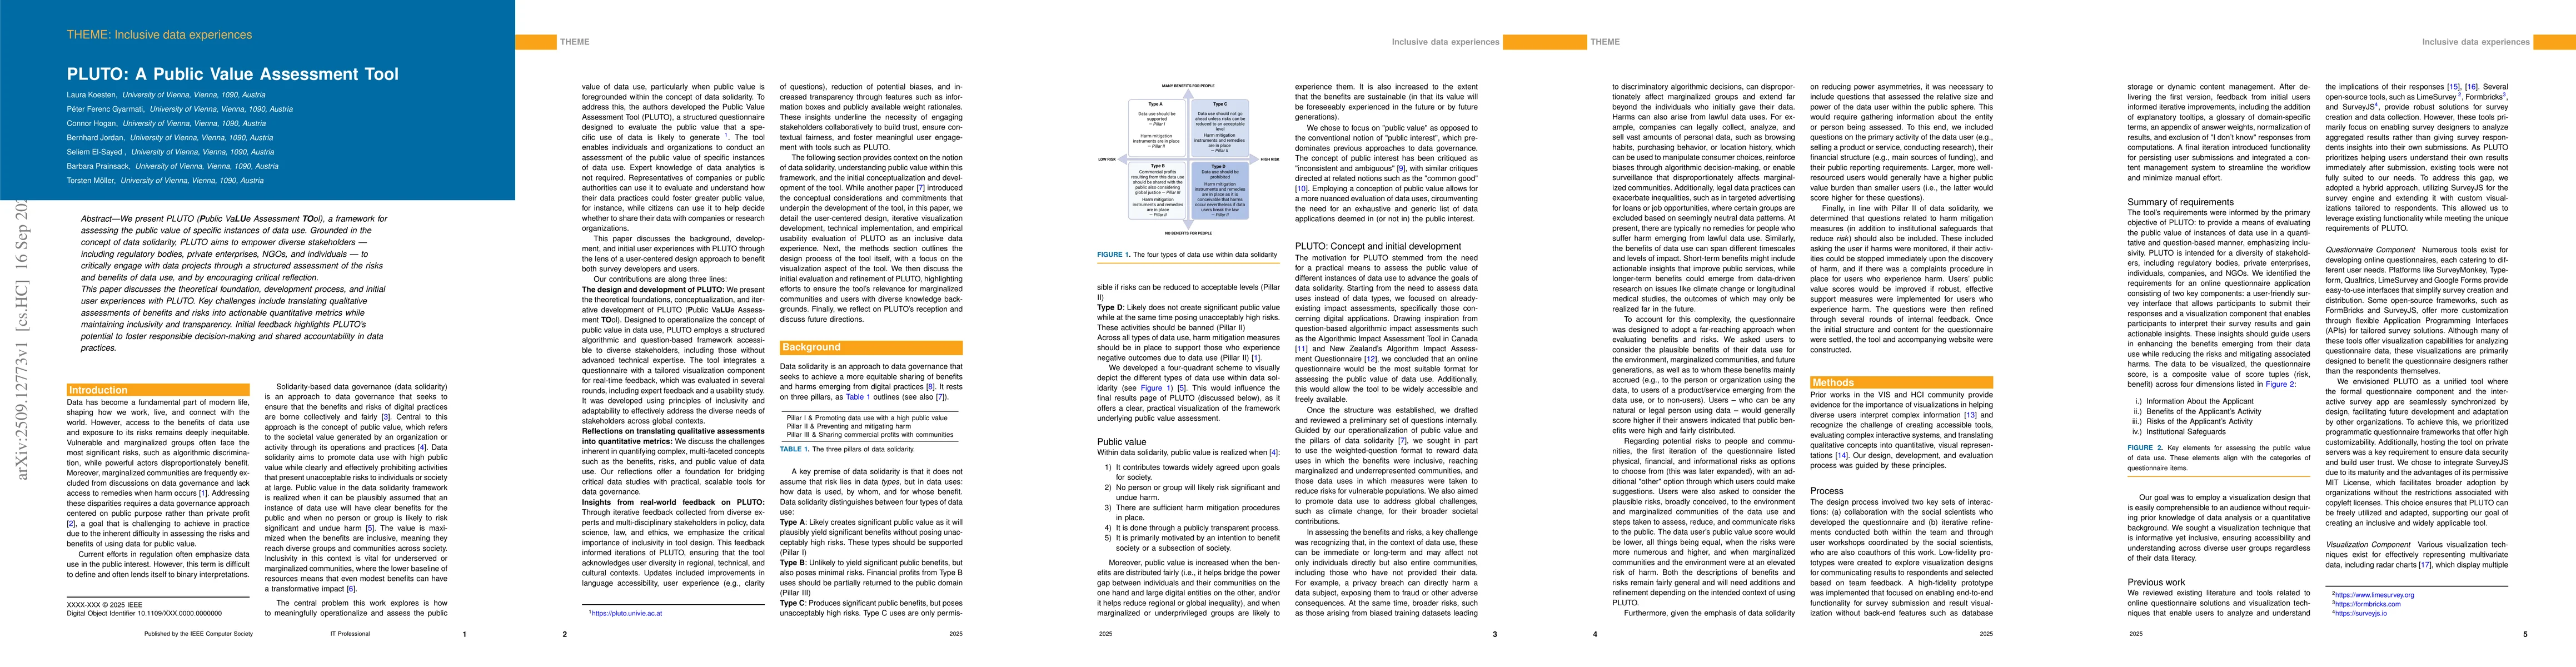
Vast amounts of (open) data are increasingly used to make arguments about crisis topics such as climate change and global pandemics. Data visualizations are central to bringing these viewpoints to b...

Thumbnail for Subjective visualization experiences: impact of visual design and
  experimental design
arXiv
Subjective visualization experiences: impact of visual design and experimental design

In contrast to objectively measurable aspects (such as accuracy, reading speed, or memorability), the subjective experience of visualizations has only recently gained importance, and we have less ex...

Thumbnail for The Gulf of Interpretation: From Chart to Message and Back Again
arXiv
The Gulf of Interpretation: From Chart to Message and Back Again

Charts are used to communicate data visually, but designing an effective chart that a broad set of people can understand is challenging. Usually, we do not know whether a chart's intended message al...

Thumbnail for Who is the Audience? Designing Casual Data Visualizations for the
  'General Public'
arXiv
Who is the Audience? Designing Casual Data Visualizations for the 'General Public'

Casual data visualizations play a vital role in communicating data to lay audiences. Despite this, little is known about how data visualization practitioners make design decisions based on their env...

Thumbnail for Applying Interdisciplinary Frameworks to Understand Algorithmic
  Decision-Making
arXiv
Applying Interdisciplinary Frameworks to Understand Algorithmic Decision-Making

We argue that explanations for "algorithmic decision-making" (ADM) systems can profit by adopting practices that are already used in the learning sciences. We shortly introduce the importance of exp...

Thumbnail for "The main message is that sustainability would help" -- Reflections on
  takeaway messages of climate change data visualizations
arXiv
"The main message is that sustainability would help" -- Reflections on takeaway messages of climate change data visualizations

How do different audiences make sense of climate change data visualizations and what do they take away as a main message? To investigate this question, we are building on the results of a previous s...

Thumbnail for What is the message? Perspectives on Visual Data Communication
arXiv
What is the message? Perspectives on Visual Data Communication

Data visualizations are used to communicate messages to diverse audiences. It is unclear whether interpretations of these visualizations match the messages their creators aim to convey. In a mixed-m...

Thumbnail for On the Impact of Explanations on Understanding of Algorithmic
  Decision-Making
arXiv
On the Impact of Explanations on Understanding of Algorithmic Decision-Making

Ethical principles for algorithms are gaining importance as more and more stakeholders are affected by "high-risk" algorithmic decision-making (ADM) systems. Understanding how these systems work ena...

Thumbnail for The star formation history of the Sco-Cen association. Coherent star
  formation patterns in space and time
arXiv
The star formation history of the Sco-Cen association. Coherent star formation patterns in space and time

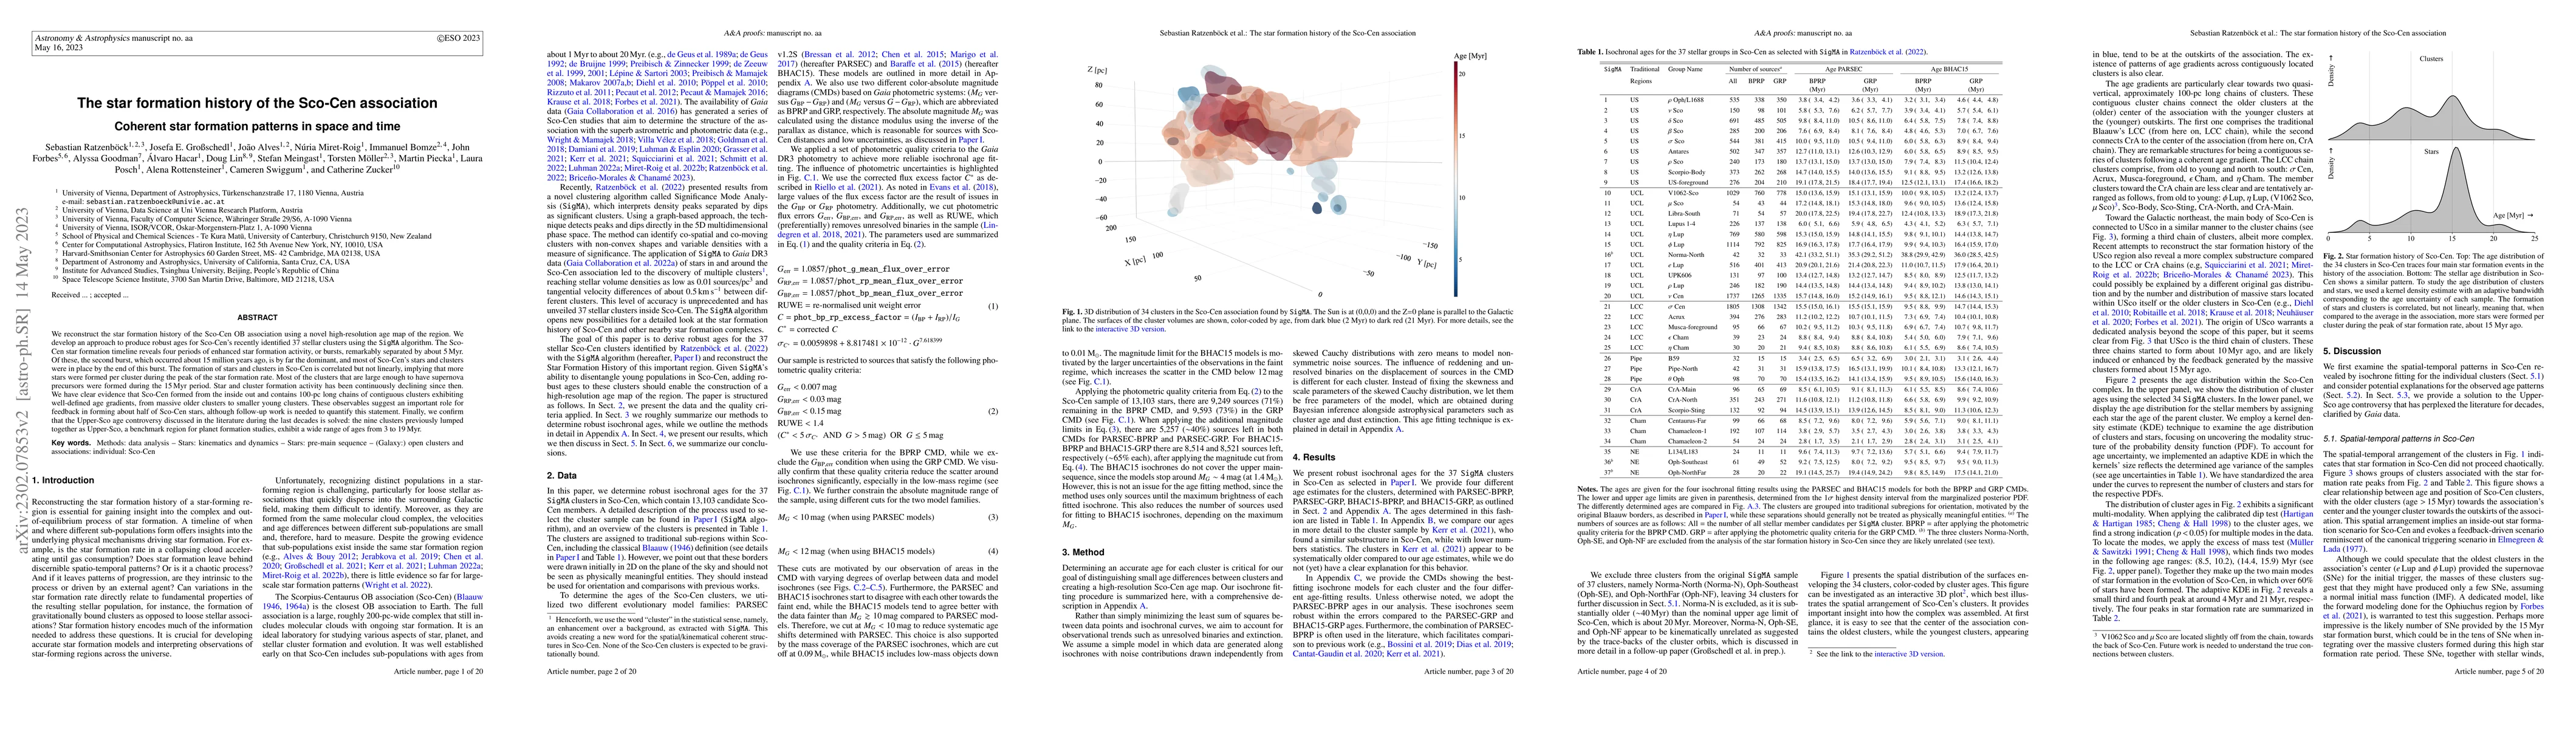
We reconstruct the star formation history of the Sco-Cen OB association using a novel high-resolution age map of the region. We develop an approach to produce robust ages for Sco-Cen's recently iden...

Thumbnail for Significance Mode Analysis (SigMA) for hierarchical structures. An
  application to the Sco-Cen OB association
arXiv
Significance Mode Analysis (SigMA) for hierarchical structures. An application to the Sco-Cen OB association

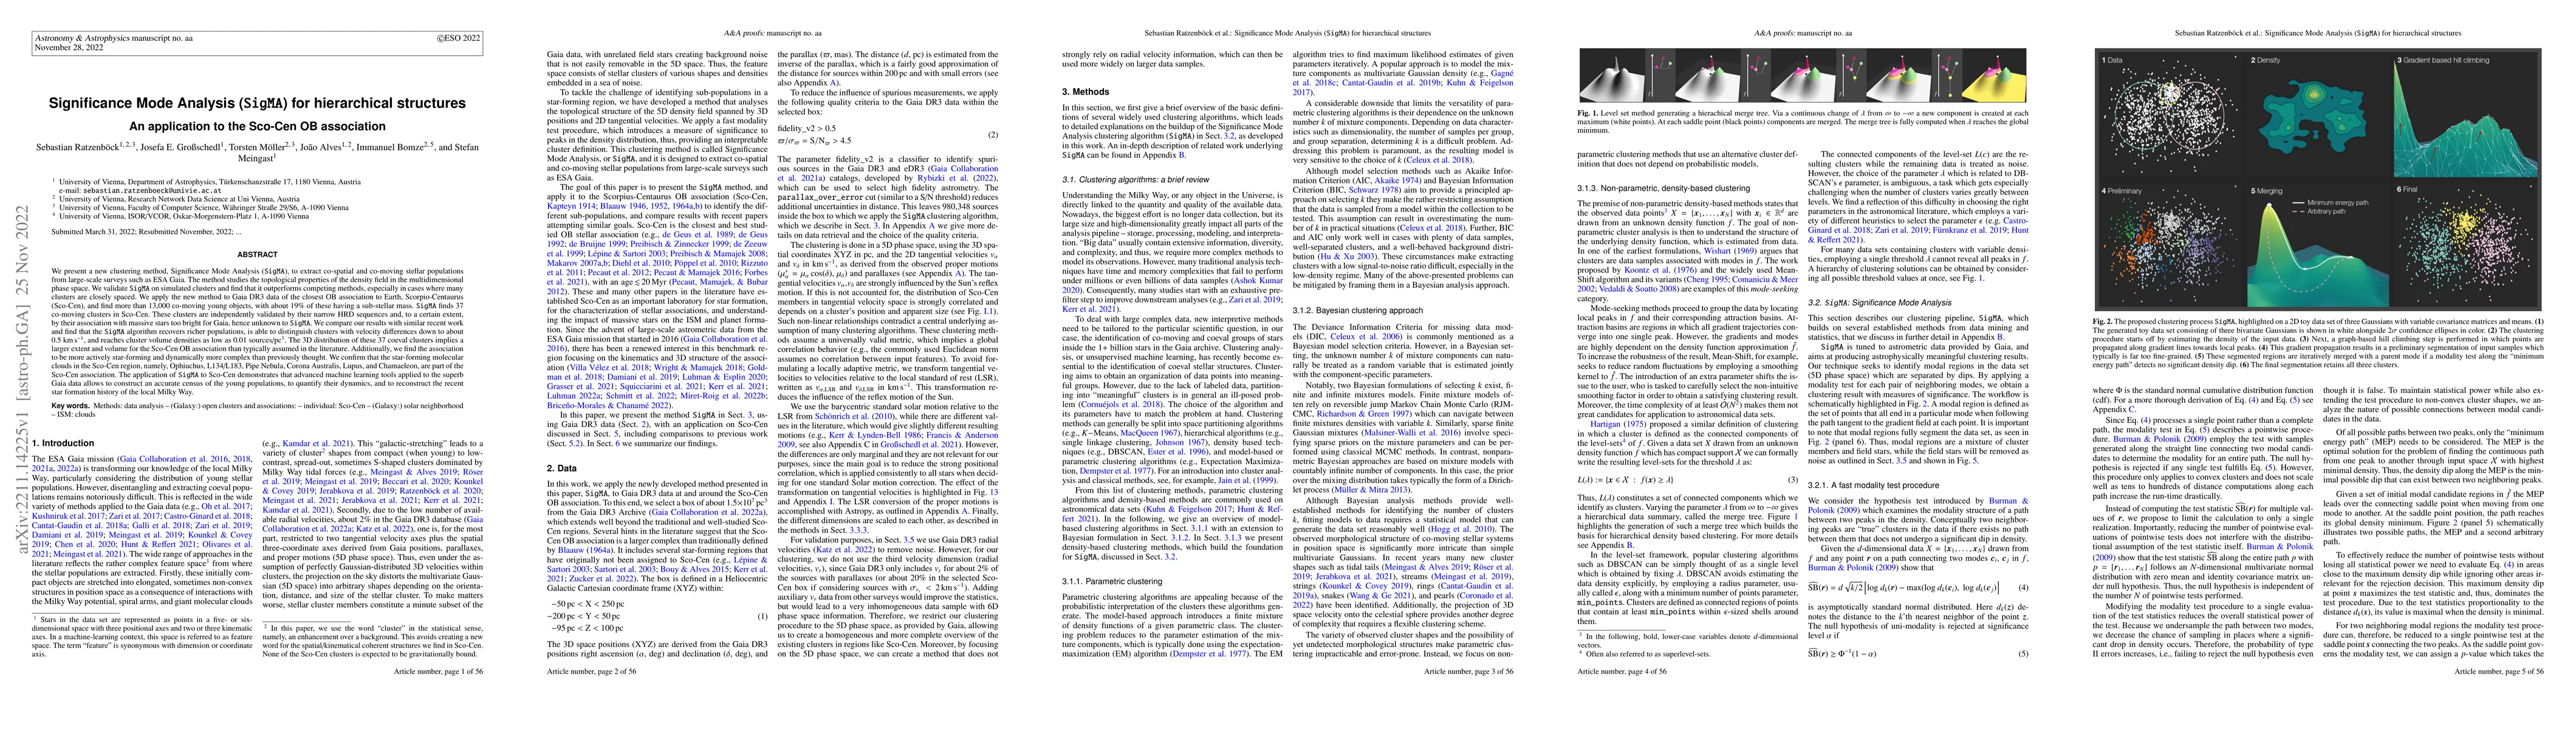
We present a new clustering method, Significance Mode Analysis (SigMA), to extract co-spatial and co-moving stellar populations from large-scale surveys such as ESA Gaia. The method studies the topo...

Thumbnail for "Being Simple on Complex Issues" -- Accounts on Visual Data
  Communication about Climate Change
arXiv
"Being Simple on Complex Issues" -- Accounts on Visual Data Communication about Climate Change

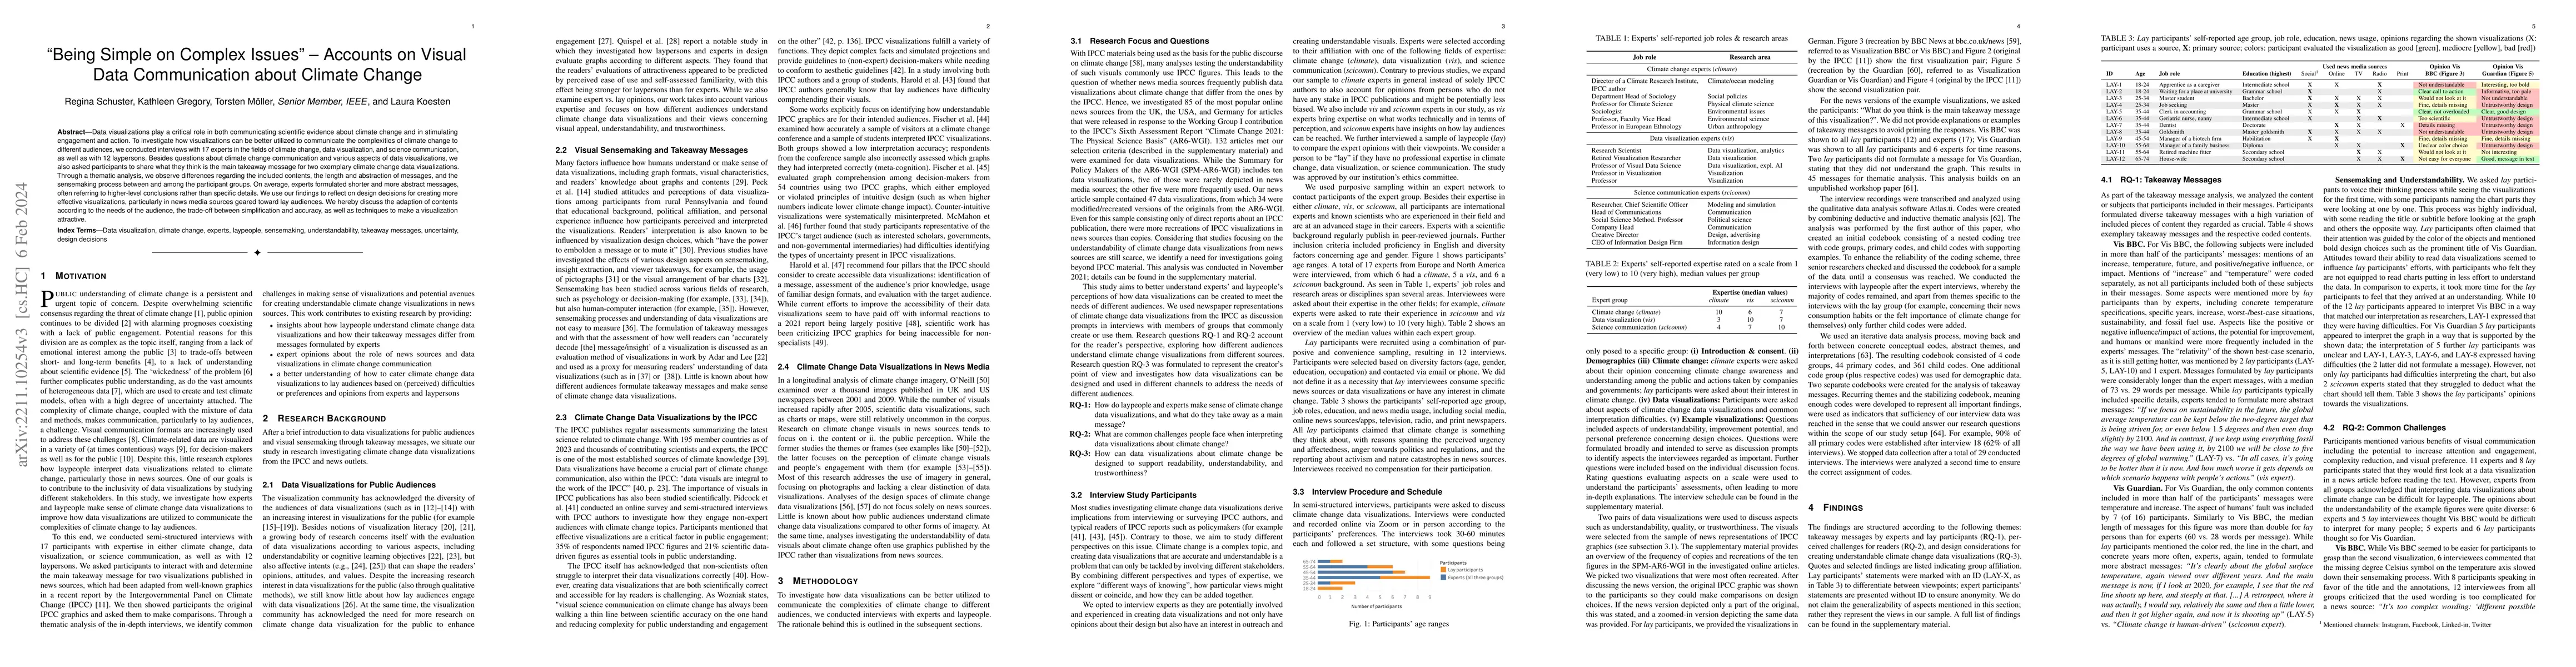
Data visualizations play a critical role in both communicating scientific evidence about climate change and in stimulating engagement and action. To investigate how visualizations can be better util...

Thumbnail for FuNNscope: Visual microscope for interactively exploring the loss
  landscape of fully connected neural networks
arXiv
FuNNscope: Visual microscope for interactively exploring the loss landscape of fully connected neural networks

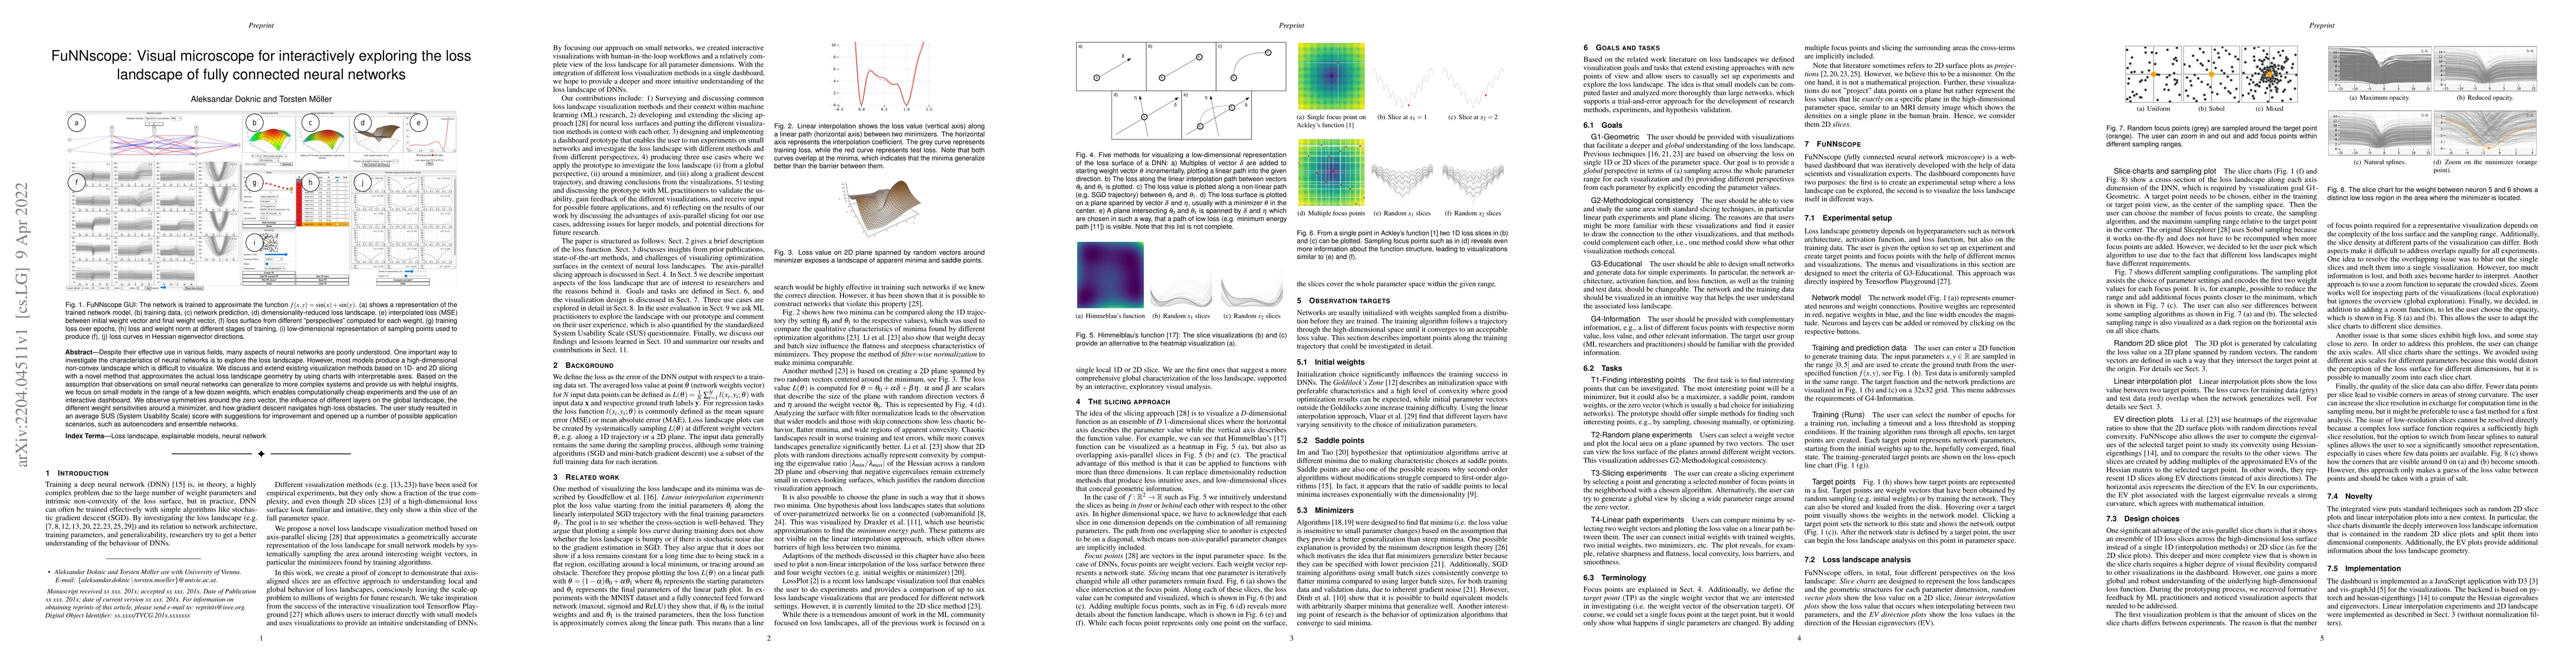
Despite their effective use in various fields, many aspects of neural networks are poorly understood. One important way to investigate the characteristics of neural networks is to explore the loss l...

Thumbnail for Sensitive vPSA -- Exploring Sensitivity in Visual Parameter Space
  Analysis
arXiv
Sensitive vPSA -- Exploring Sensitivity in Visual Parameter Space Analysis

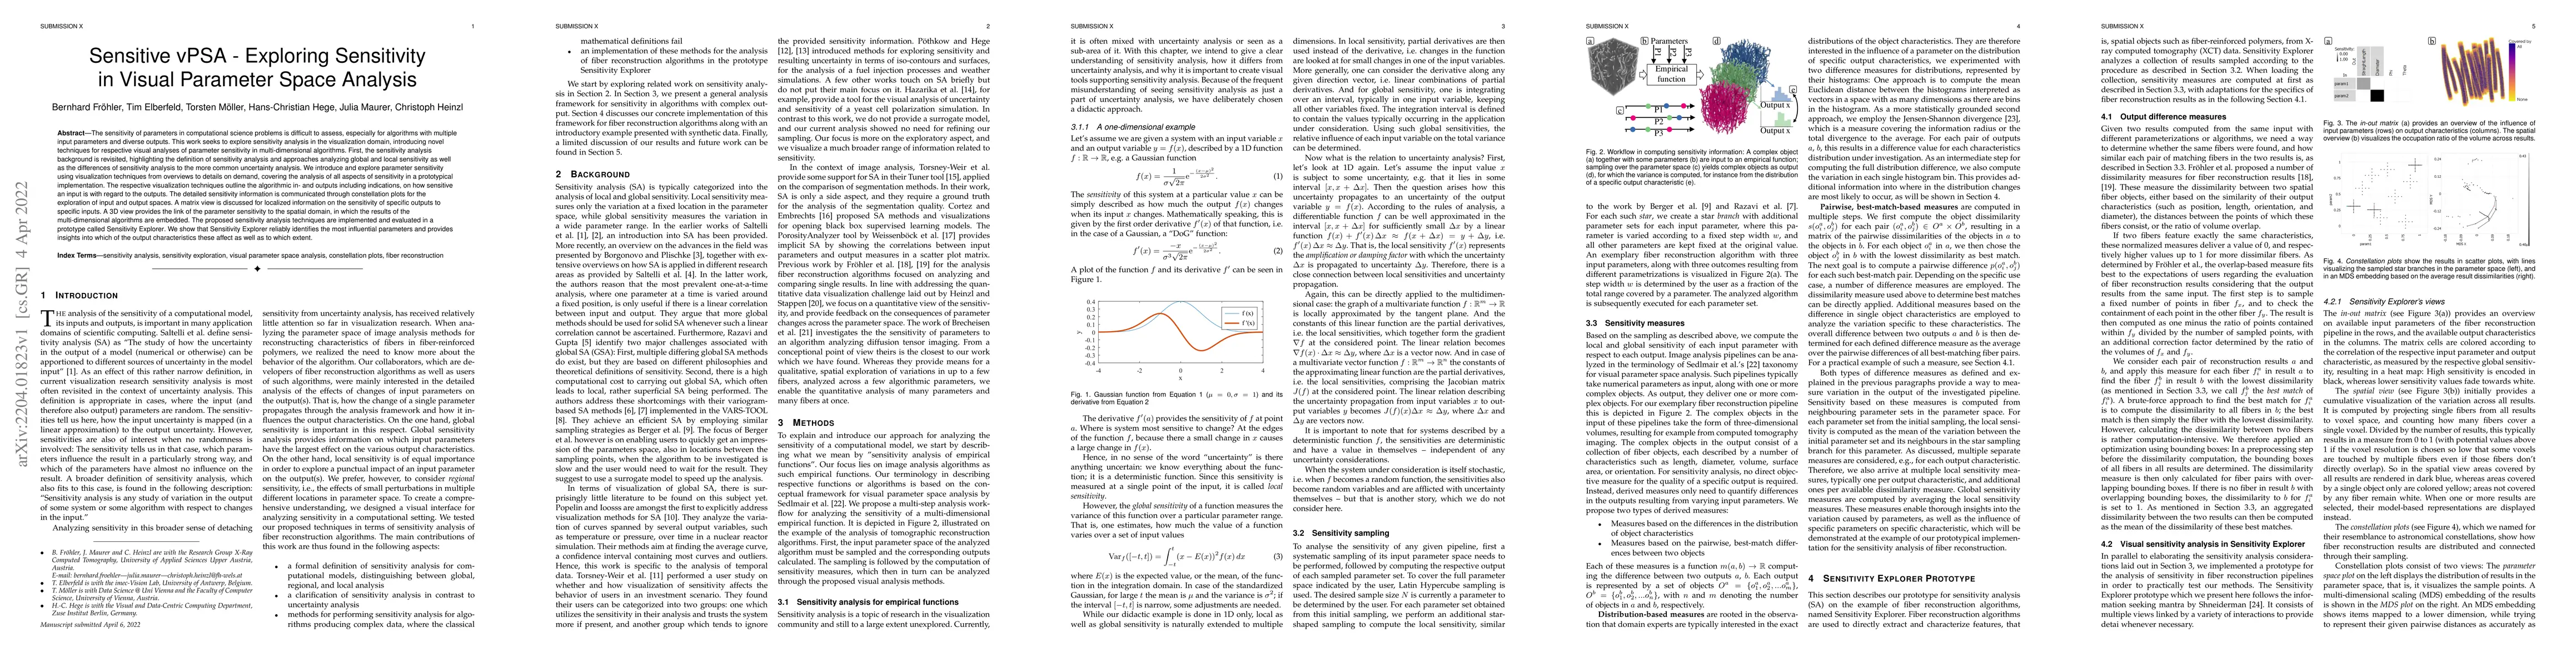
The sensitivity of parameters in computational science problems is difficult to assess, especially for algorithms with multiple input parameters and diverse outputs. This work seeks to explore sensi...

Thumbnail for Histogram binning revisited with a focus on human perception
arXiv
Histogram binning revisited with a focus on human perception

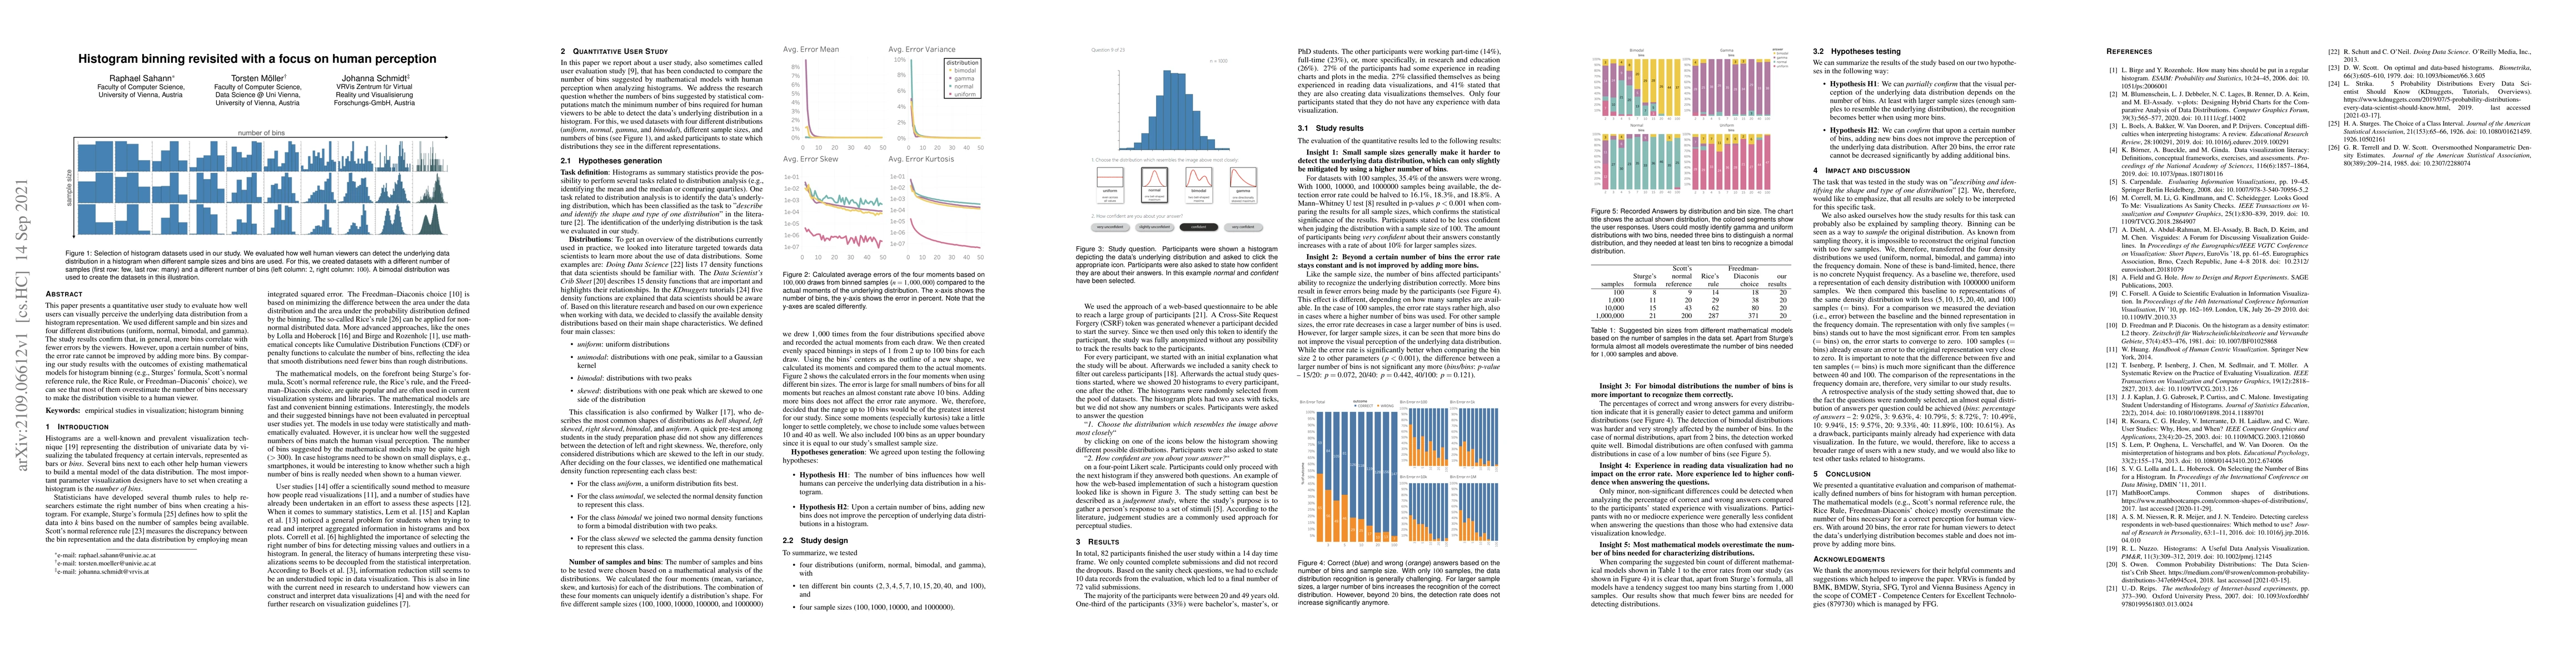
This paper presents a quantitative user study to evaluate how well users can visually perceive the underlying data distribution from a histogram representation. We used different sample and bin size...

Thumbnail for Document Domain Randomization for Deep Learning Document Layout
  Extraction
arXiv
Document Domain Randomization for Deep Learning Document Layout Extraction

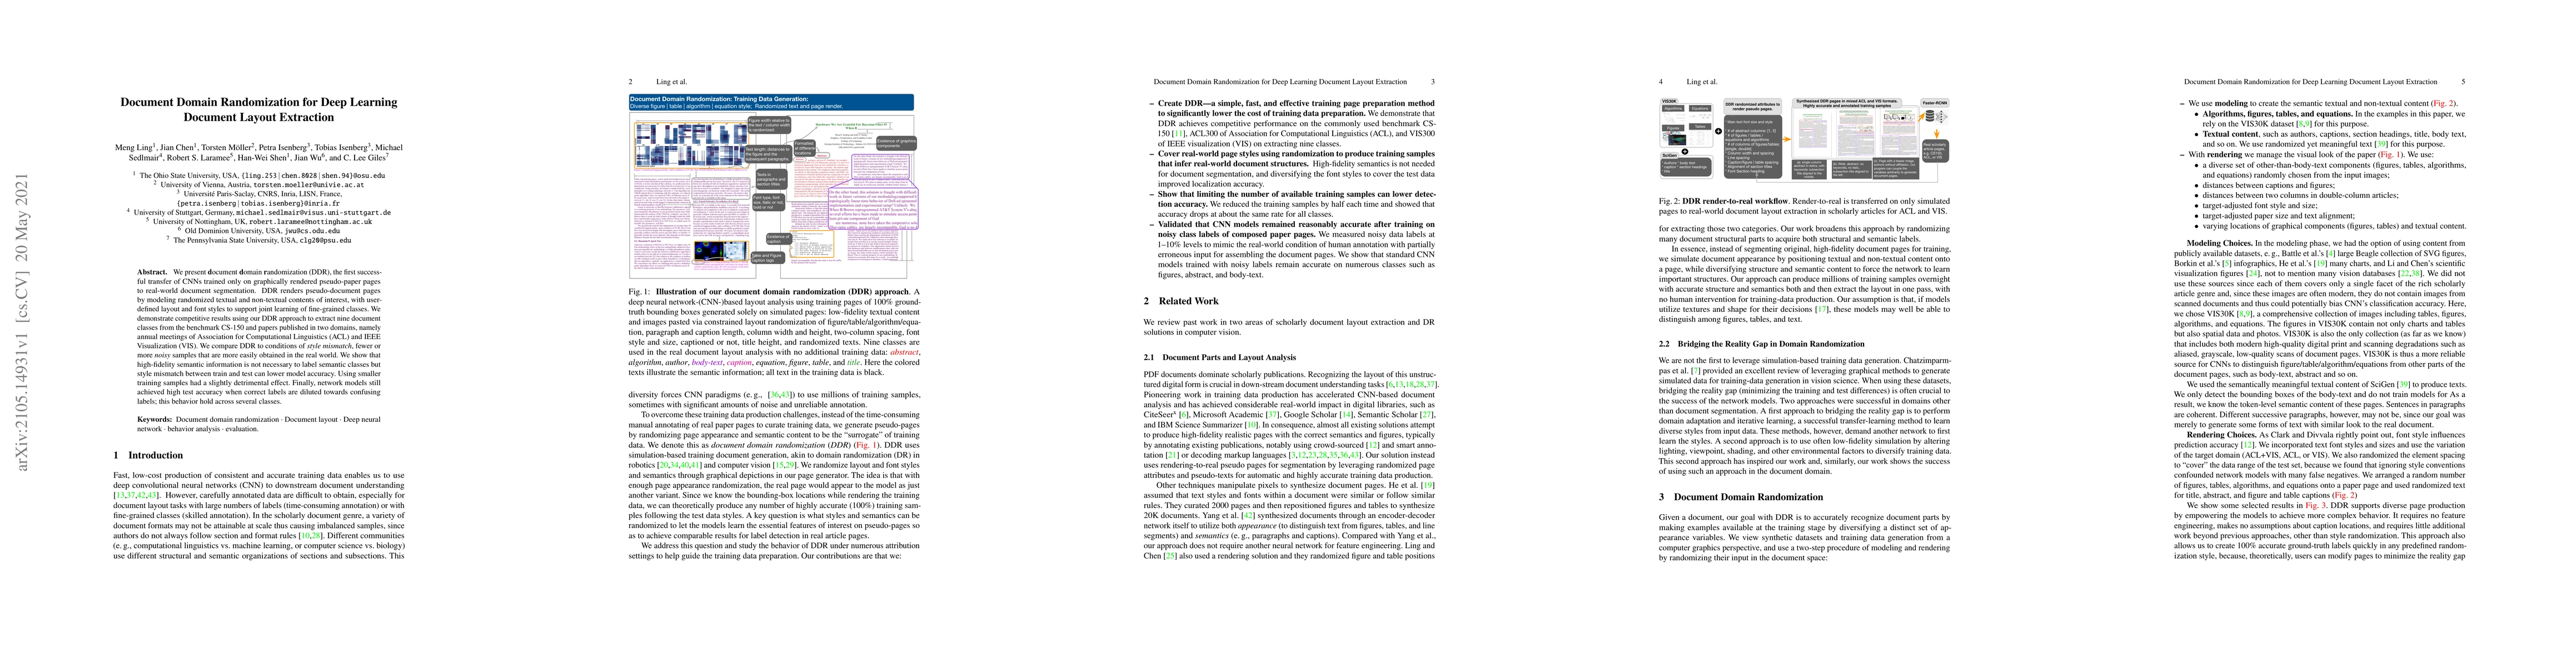
We present document domain randomization (DDR), the first successful transfer of convolutional neural networks (CNNs) trained only on graphically rendered pseudo-paper pages to real-world document s...

Thumbnail for VIS30K: A Collection of Figures and Tables from IEEE Visualization
  Conference Publications
arXiv
VIS30K: A Collection of Figures and Tables from IEEE Visualization Conference Publications

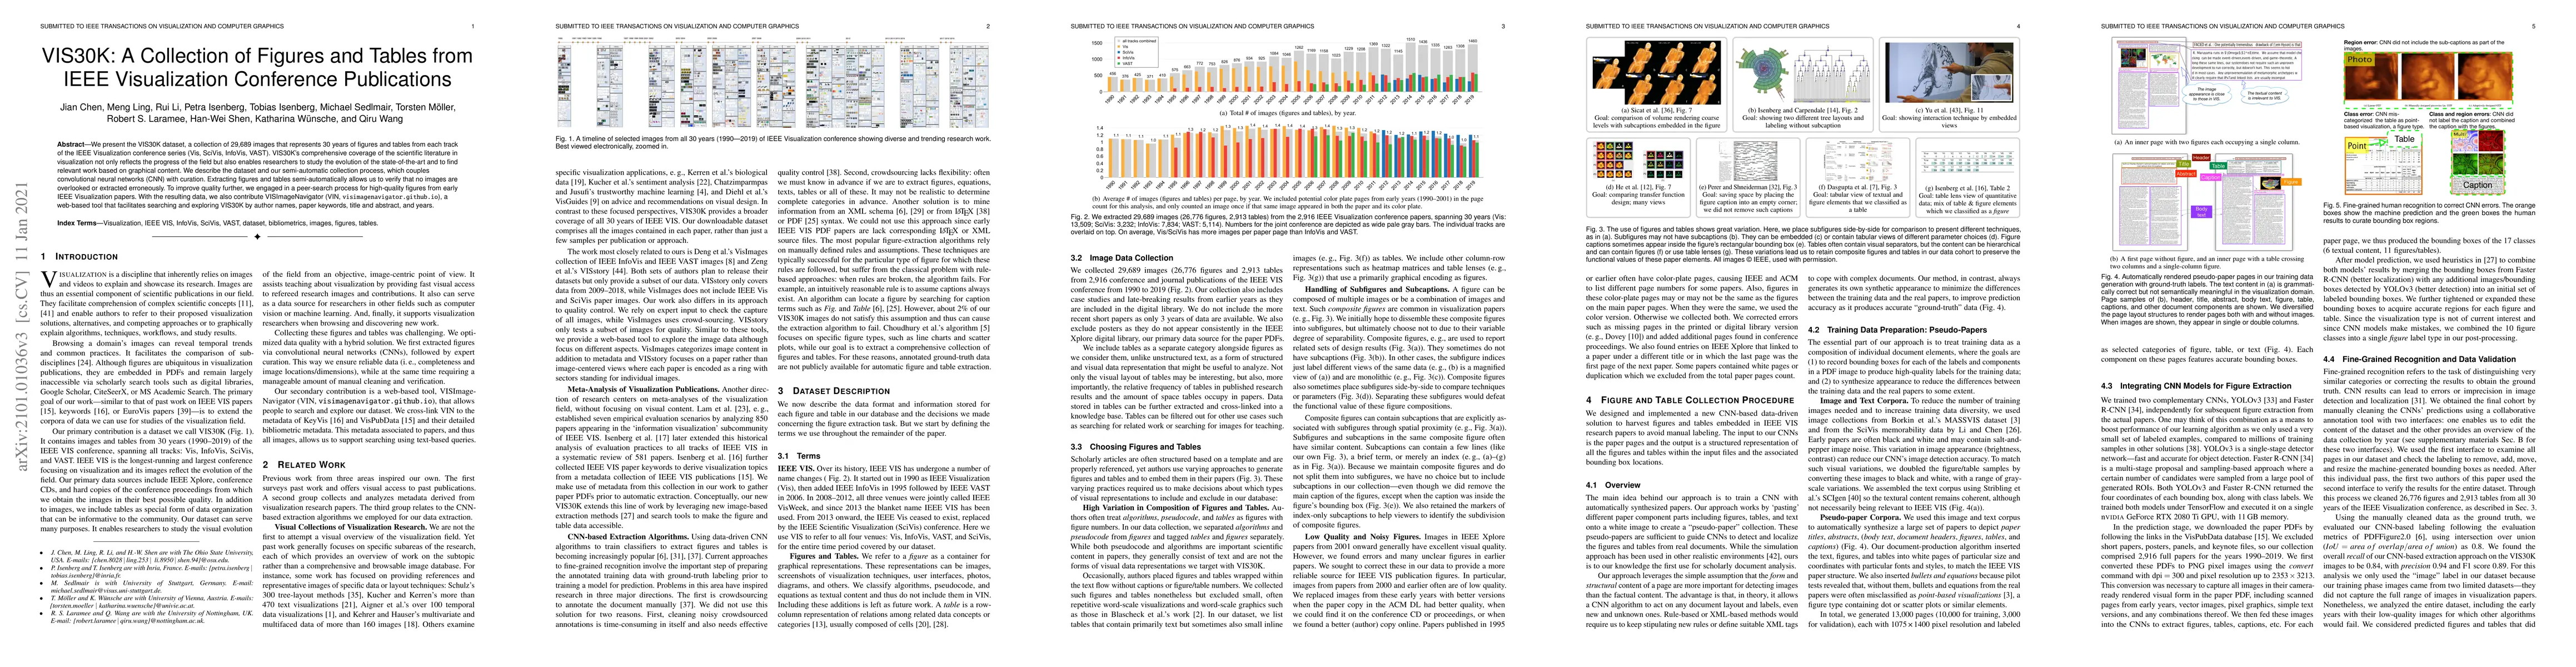
We present the VIS30K dataset, a collection of 29,689 images that represents 30 years of figures and tables from each track of the IEEE Visualization conference series (Vis, SciVis, InfoVis, VAST). ...

Thumbnail for embComp: Visual Interactive Comparison of Vector Embeddings
arXiv
embComp: Visual Interactive Comparison of Vector Embeddings

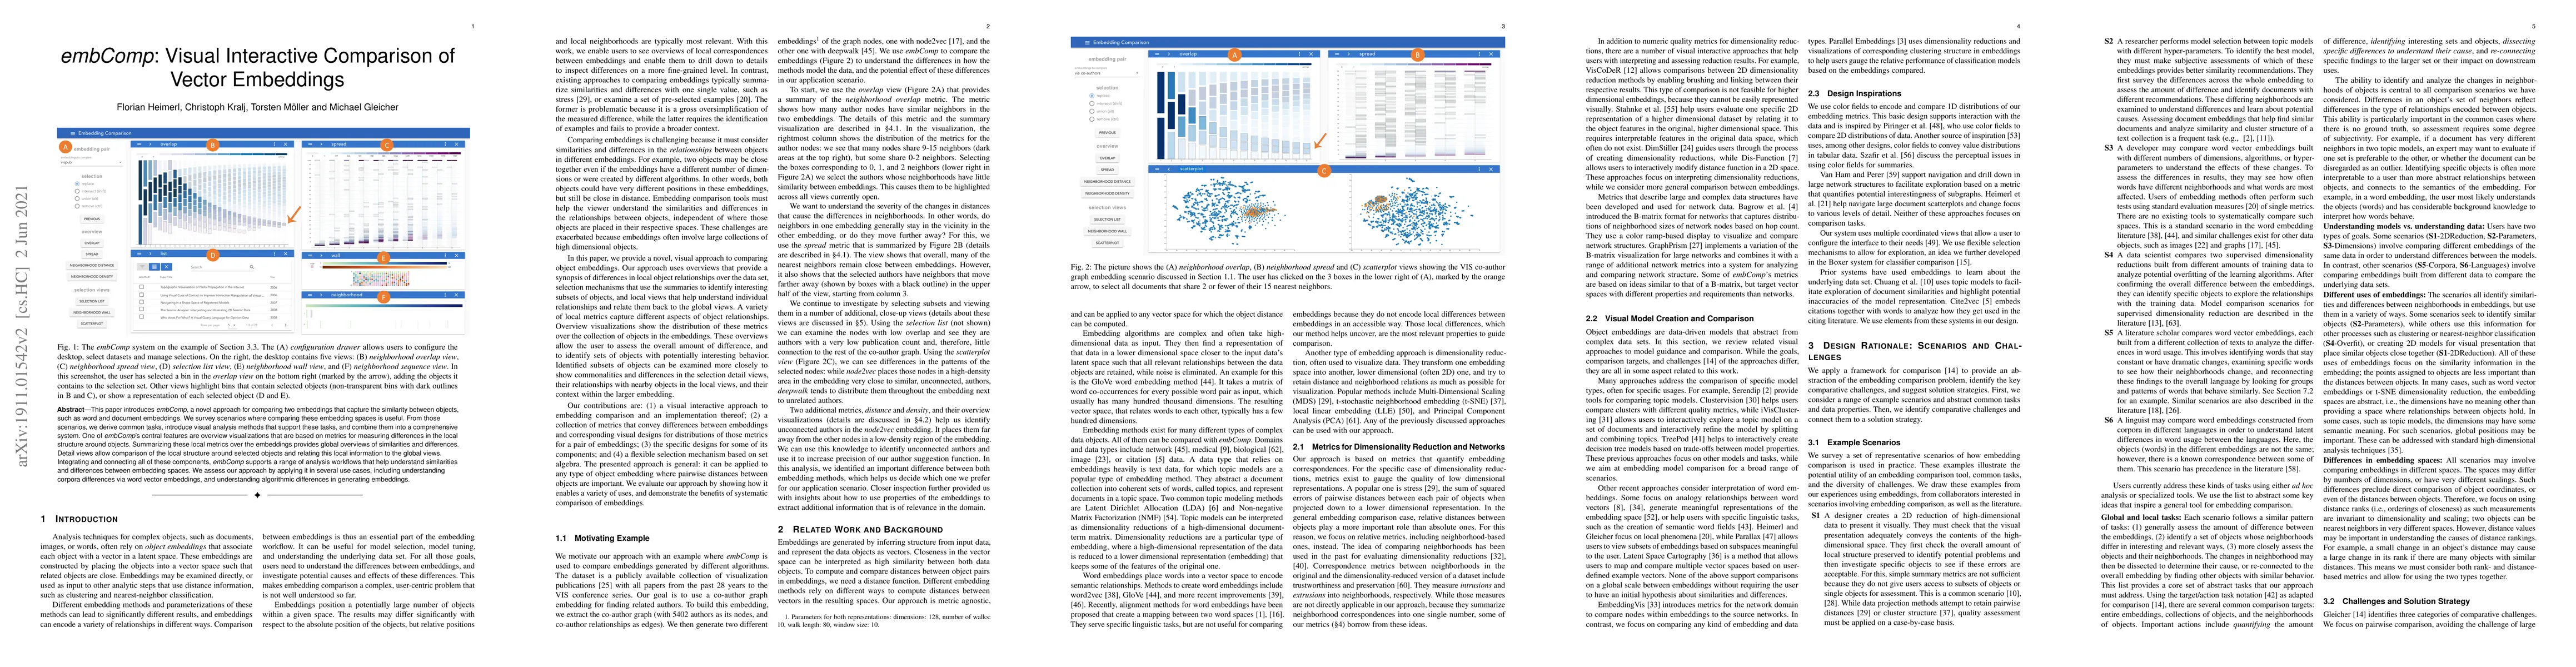
This paper introduces embComp, a novel approach for comparing two embeddings that capture the similarity between objects, such as word and document embeddings. We survey scenarios where comparing th...

Thumbnail for Deliberative XAI: How Explanations Impact Understanding and
  Decision-Making of AI Novices in Collective and Individual Settings
arXiv
Deliberative XAI: How Explanations Impact Understanding and Decision-Making of AI Novices in Collective and Individual Settings

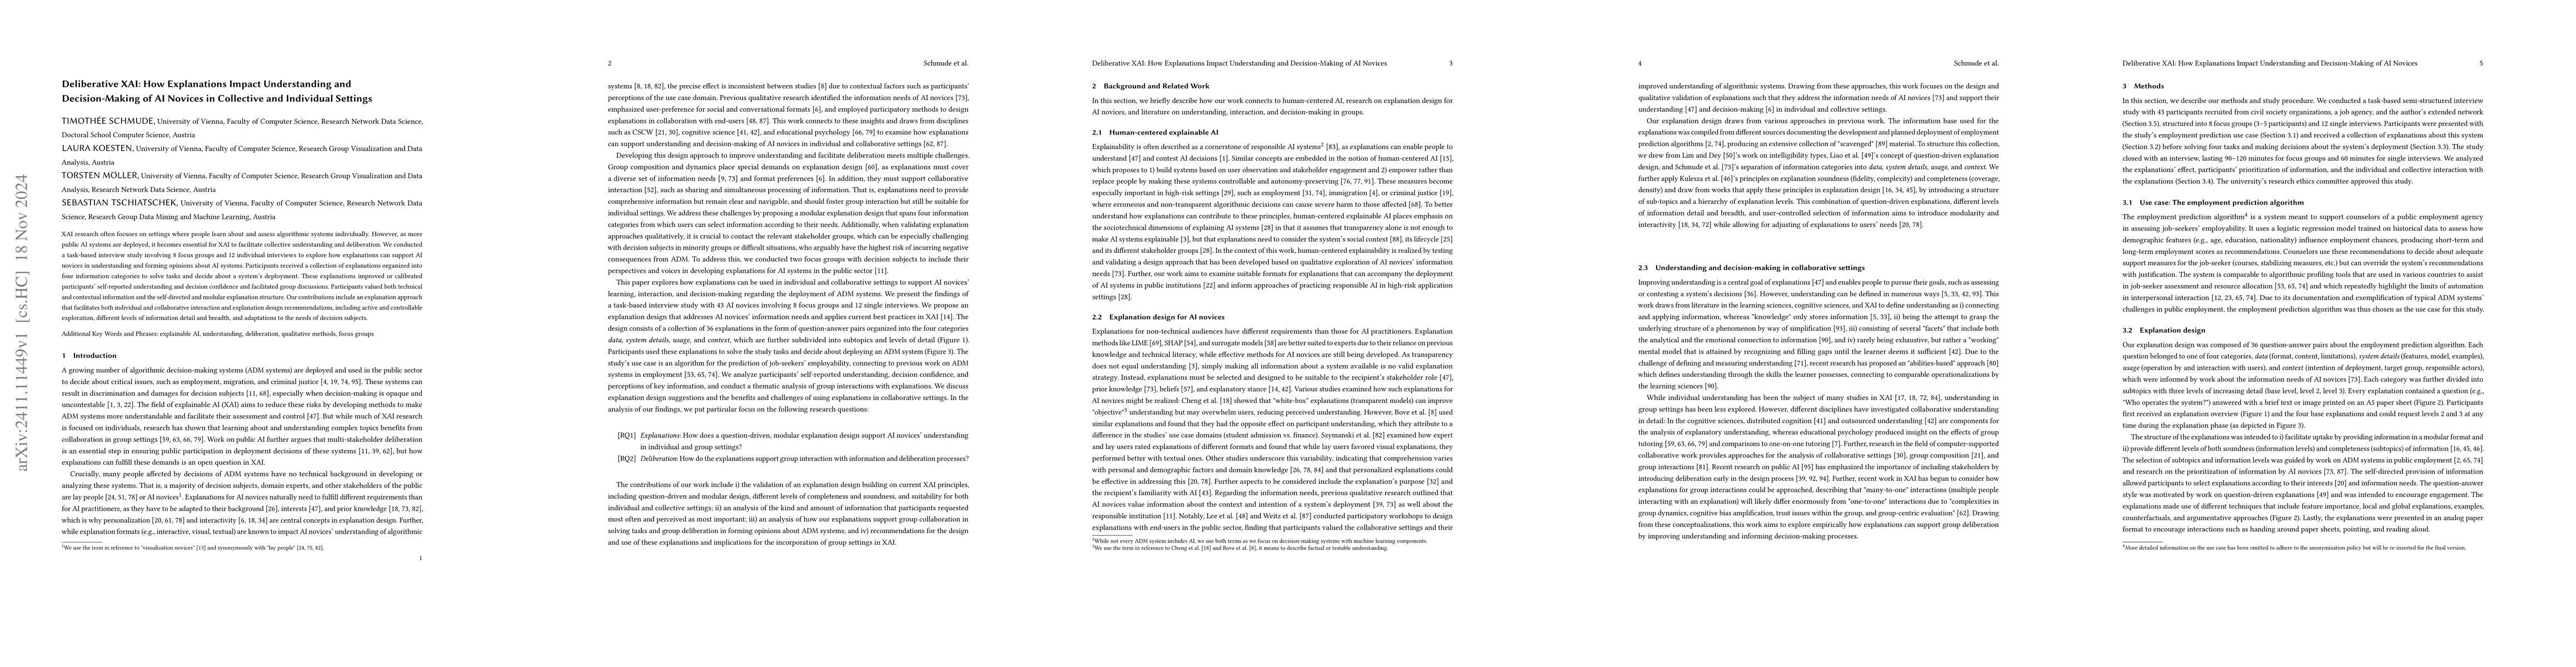
XAI research often focuses on settings where people learn about and assess algorithmic systems individually. However, as more public AI systems are deployed, it becomes essential for XAI to facilitate...

Thumbnail for RSVP for VPSA : A Meta Design Study on Rapid Suggestive Visualization
  Prototyping for Visual Parameter Space Analysis
arXiv
RSVP for VPSA : A Meta Design Study on Rapid Suggestive Visualization Prototyping for Visual Parameter Space Analysis

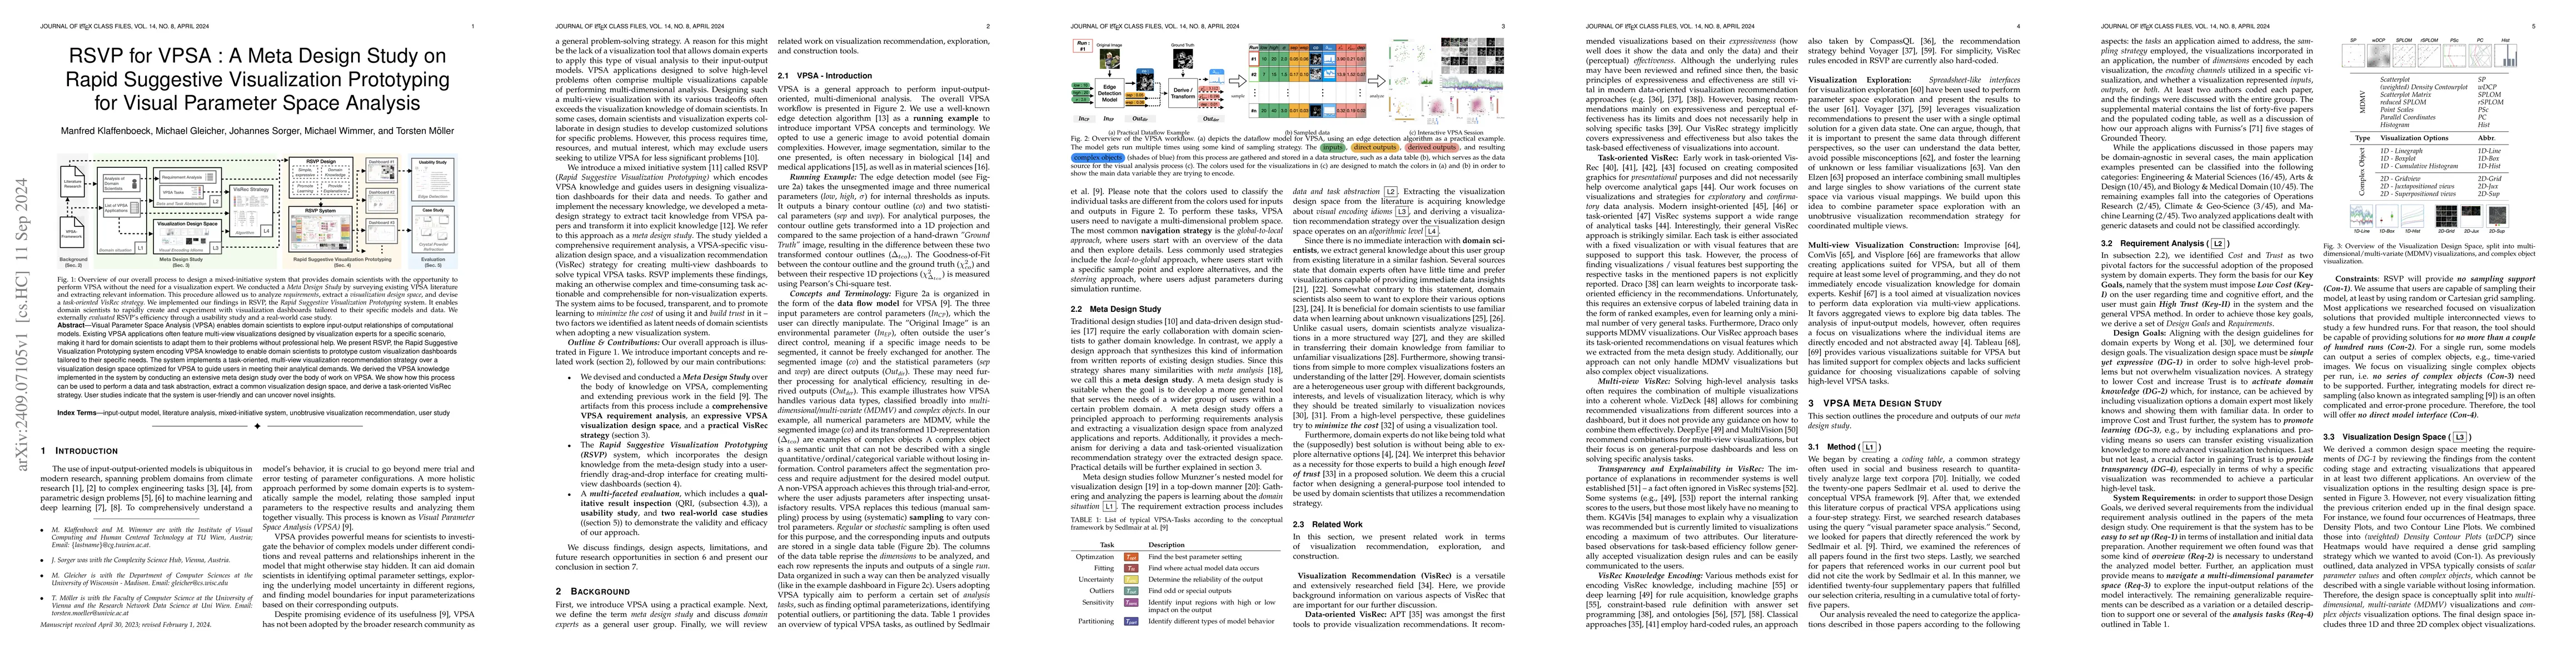
Visual Parameter Space Analysis (VPSA) enables domain scientists to explore input-output relationships of computational models. Existing VPSA applications often feature multi-view visualizations desig...

Thumbnail for MAVIL: Design of a Multidimensional Assessment of Visual Data Literacy
  and its Application in a Representative Survey
arXiv
MAVIL: Design of a Multidimensional Assessment of Visual Data Literacy and its Application in a Representative Survey

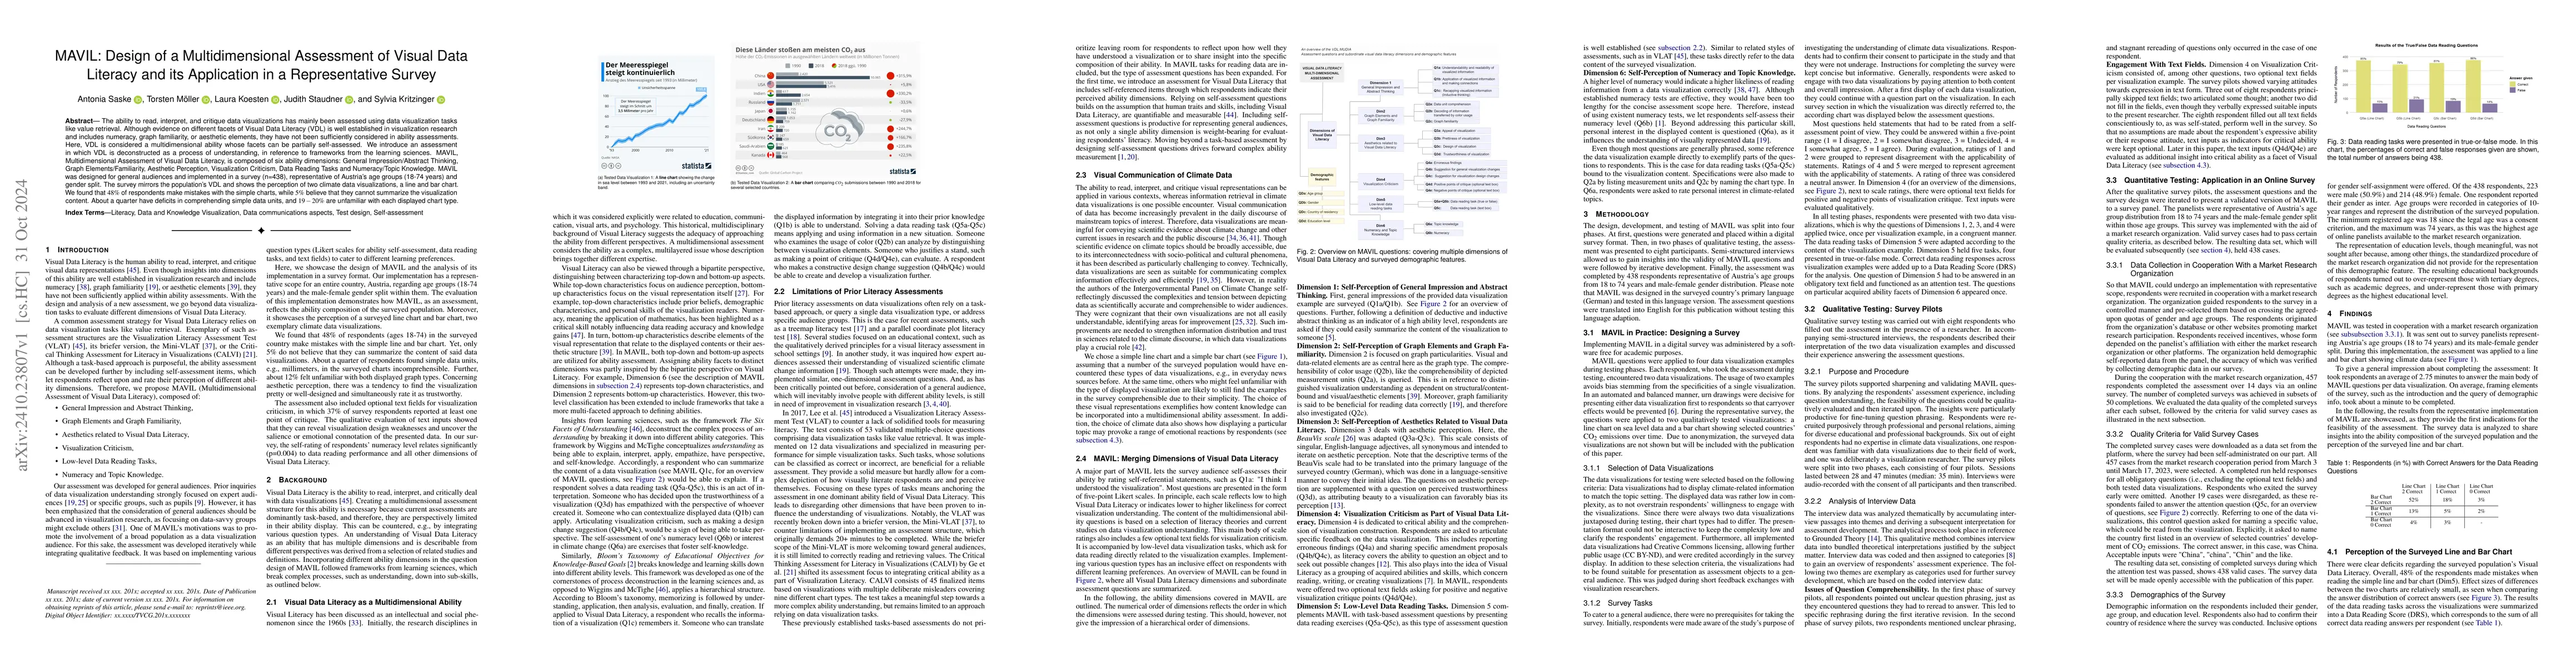
The ability to read, interpret, and critique data visualizations has mainly been assessed using data visualization tasks like value retrieval. Although evidence on different facets of Visual Data Lite...

Thumbnail for MLMC: Interactive multi-label multi-classifier evaluation without
  confusion matrices
arXiv
MLMC: Interactive multi-label multi-classifier evaluation without confusion matrices

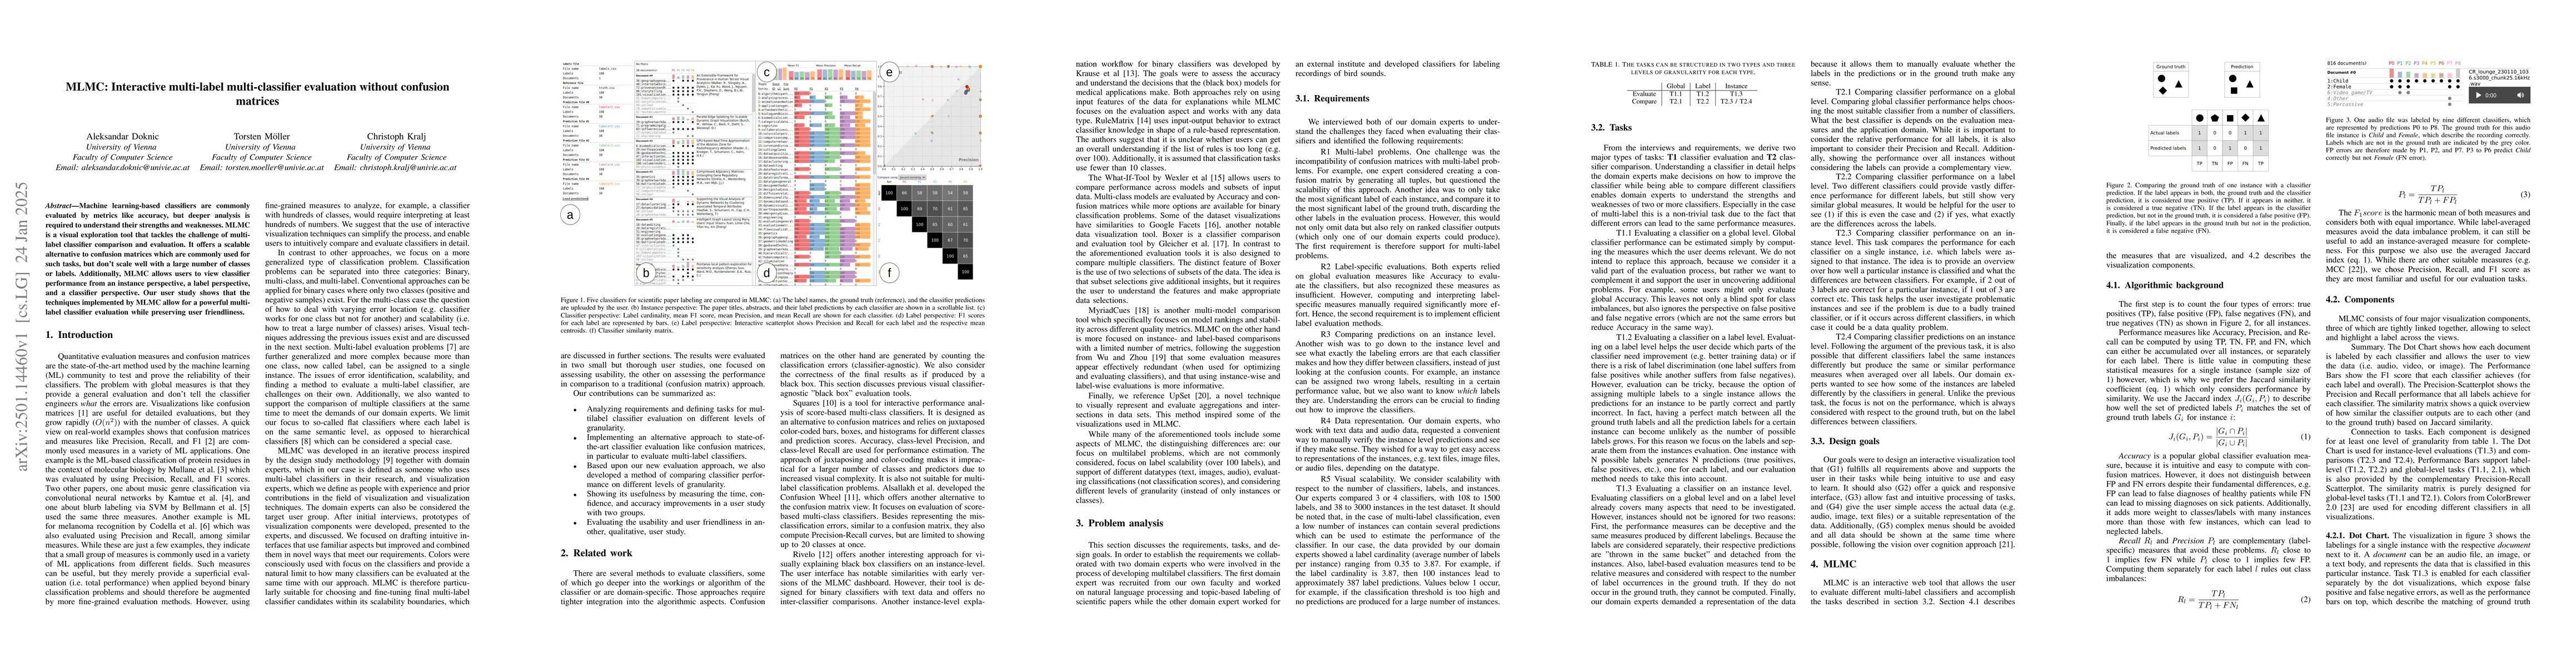
Machine learning-based classifiers are commonly evaluated by metrics like accuracy, but deeper analysis is required to understand their strengths and weaknesses. MLMC is a visual exploration tool that...

Thumbnail for A Composable Agentic System for Automated Visual Data Reporting
arXiv
A Composable Agentic System for Automated Visual Data Reporting

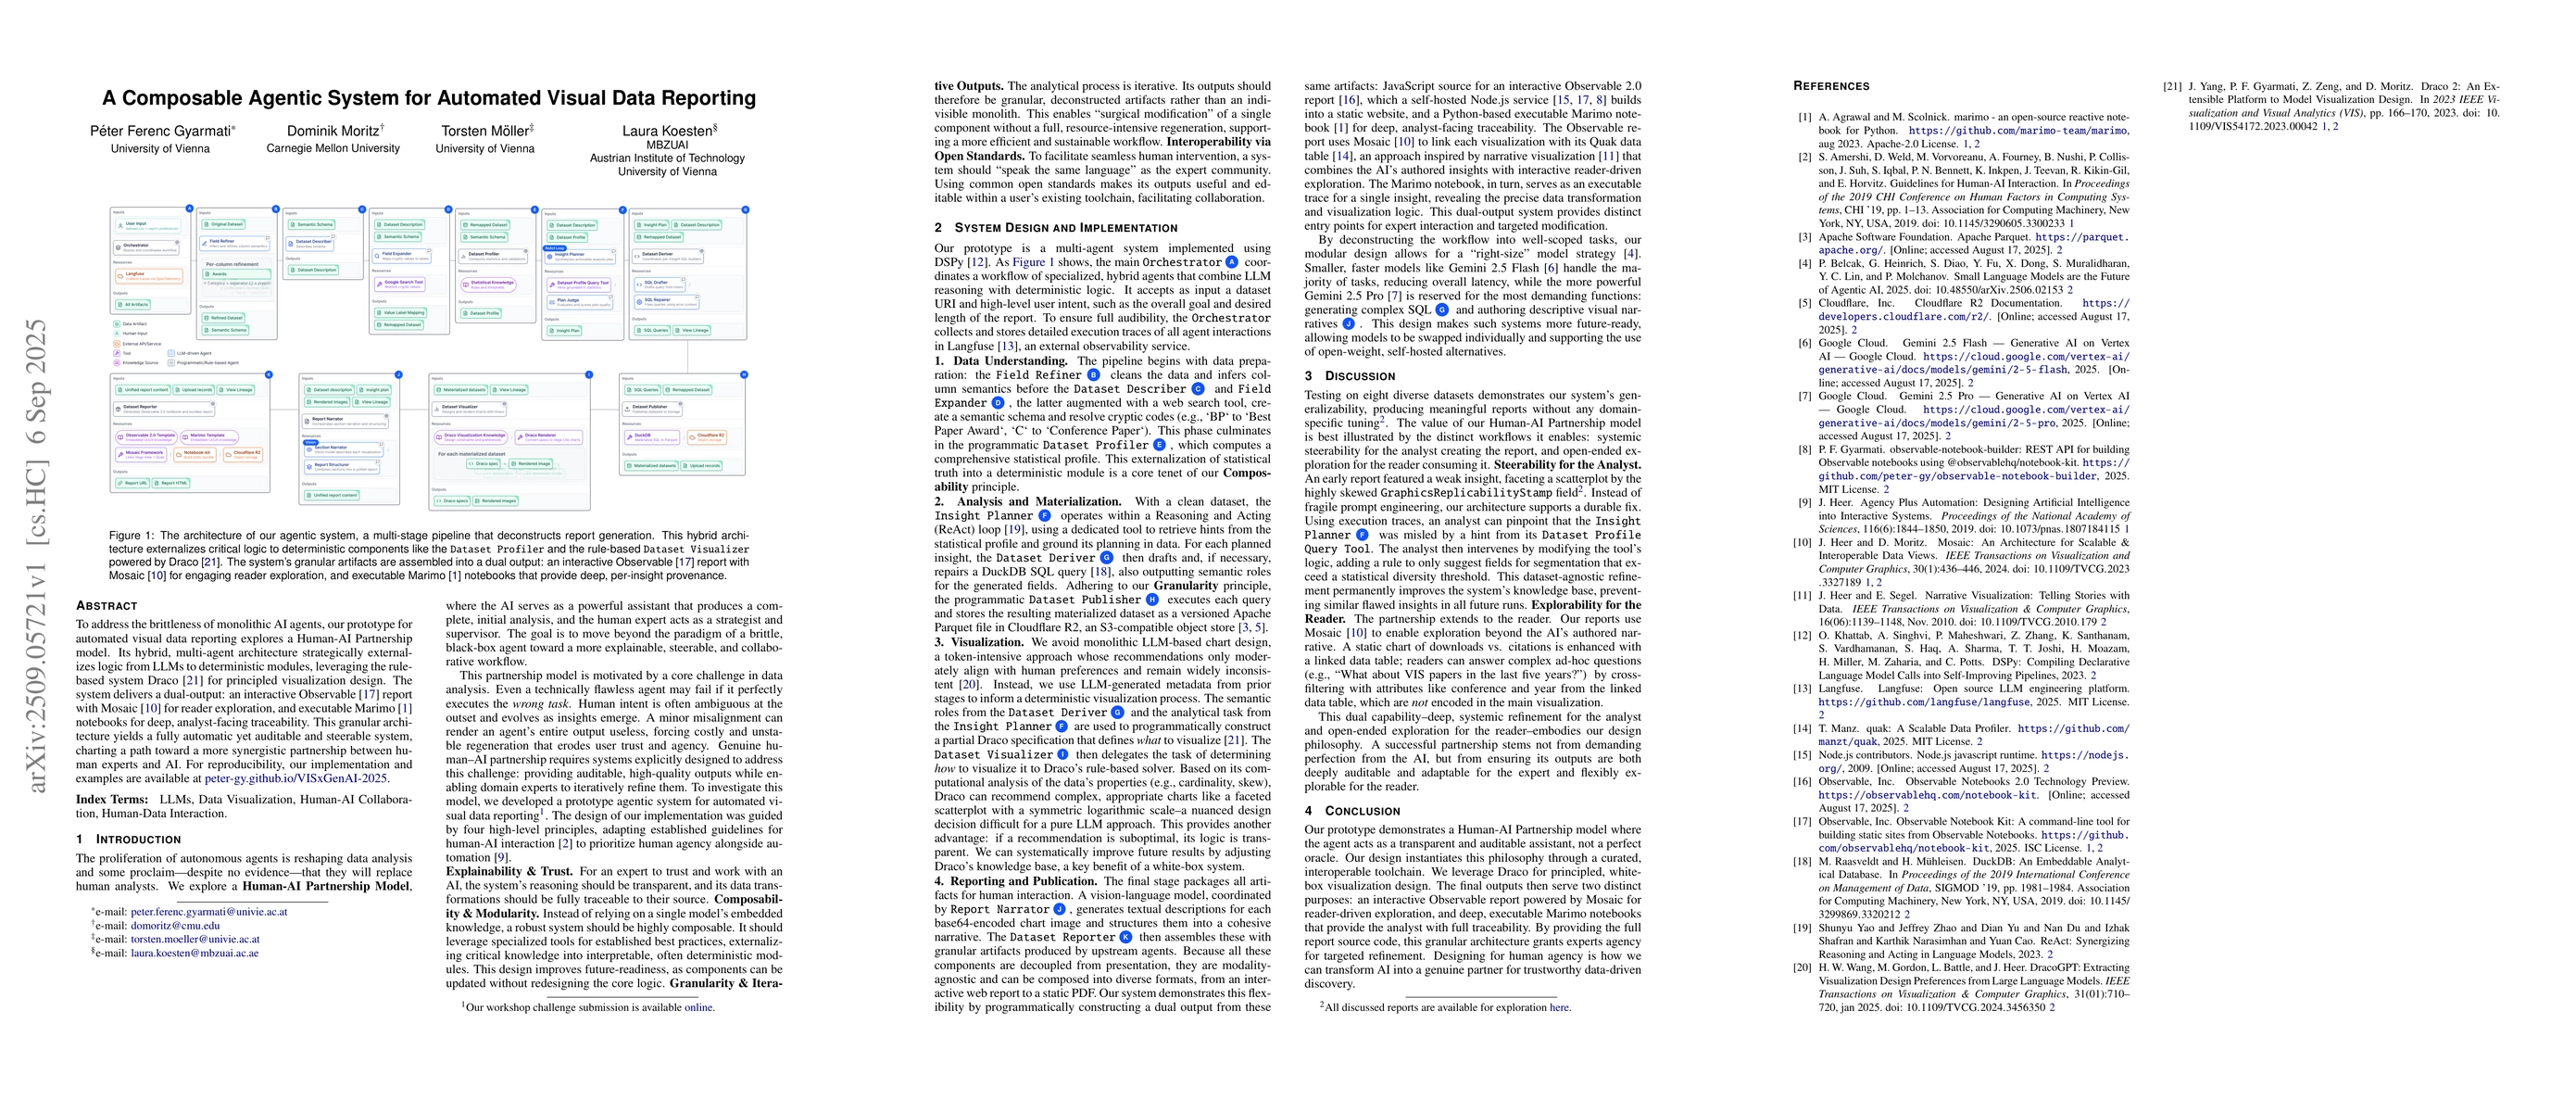
To address the brittleness of monolithic AI agents, our prototype for automated visual data reporting explores a Human-AI Partnership model. Its hybrid, multi-agent architecture strategically external...

Thumbnail for Do Vision-Language Models See Visualizations Like Humans? Alignment in
  Chart Categorization
arXiv
Do Vision-Language Models See Visualizations Like Humans? Alignment in Chart Categorization

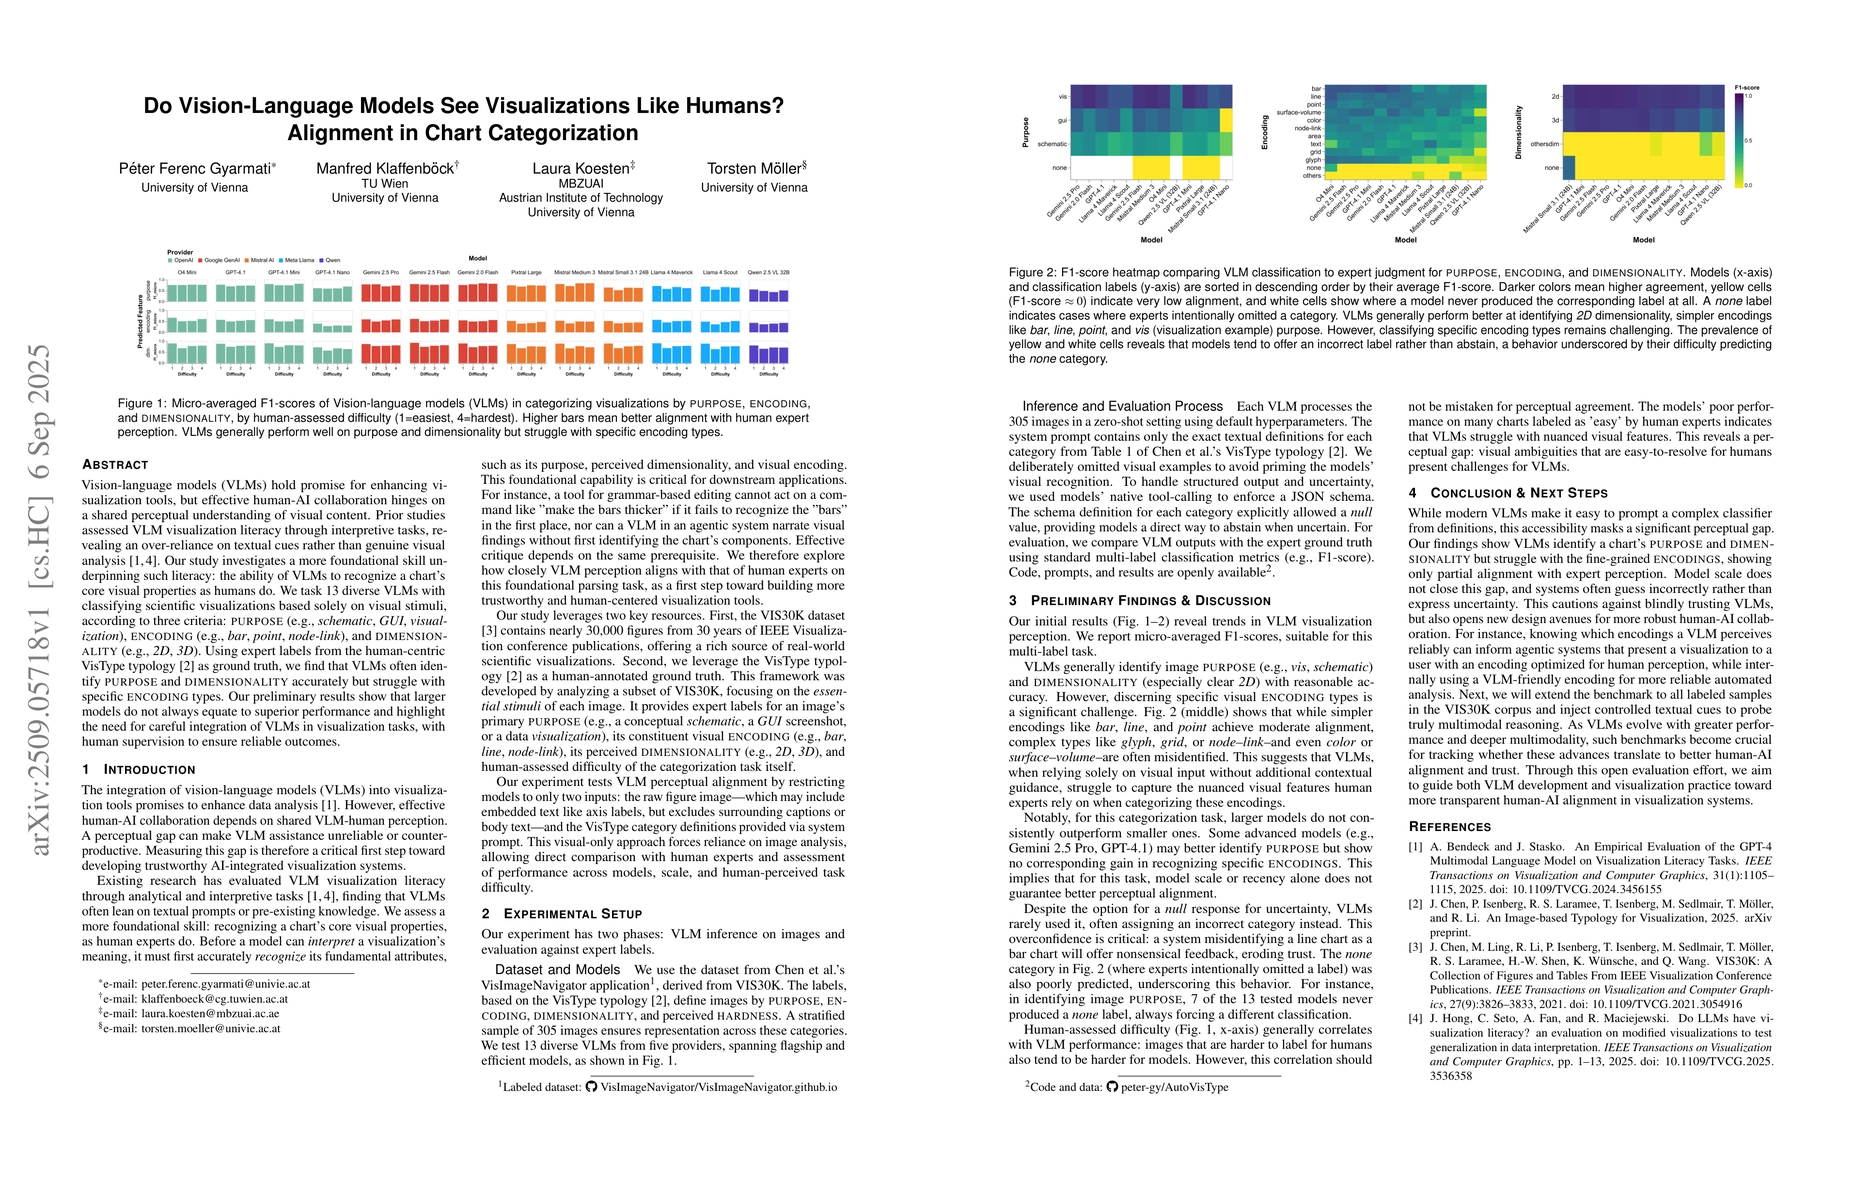
Vision-language models (VLMs) hold promise for enhancing visualization tools, but effective human-AI collaboration hinges on a shared perceptual understanding of visual content. Prior studies assessed...

Thumbnail for Toward the fabric of the Milky Way I. The density of disk streams from a
  local $250^3$ pc$^3$ volume
arXiv
Toward the fabric of the Milky Way I. The density of disk streams from a local $250^3$ pc$^3$ volume

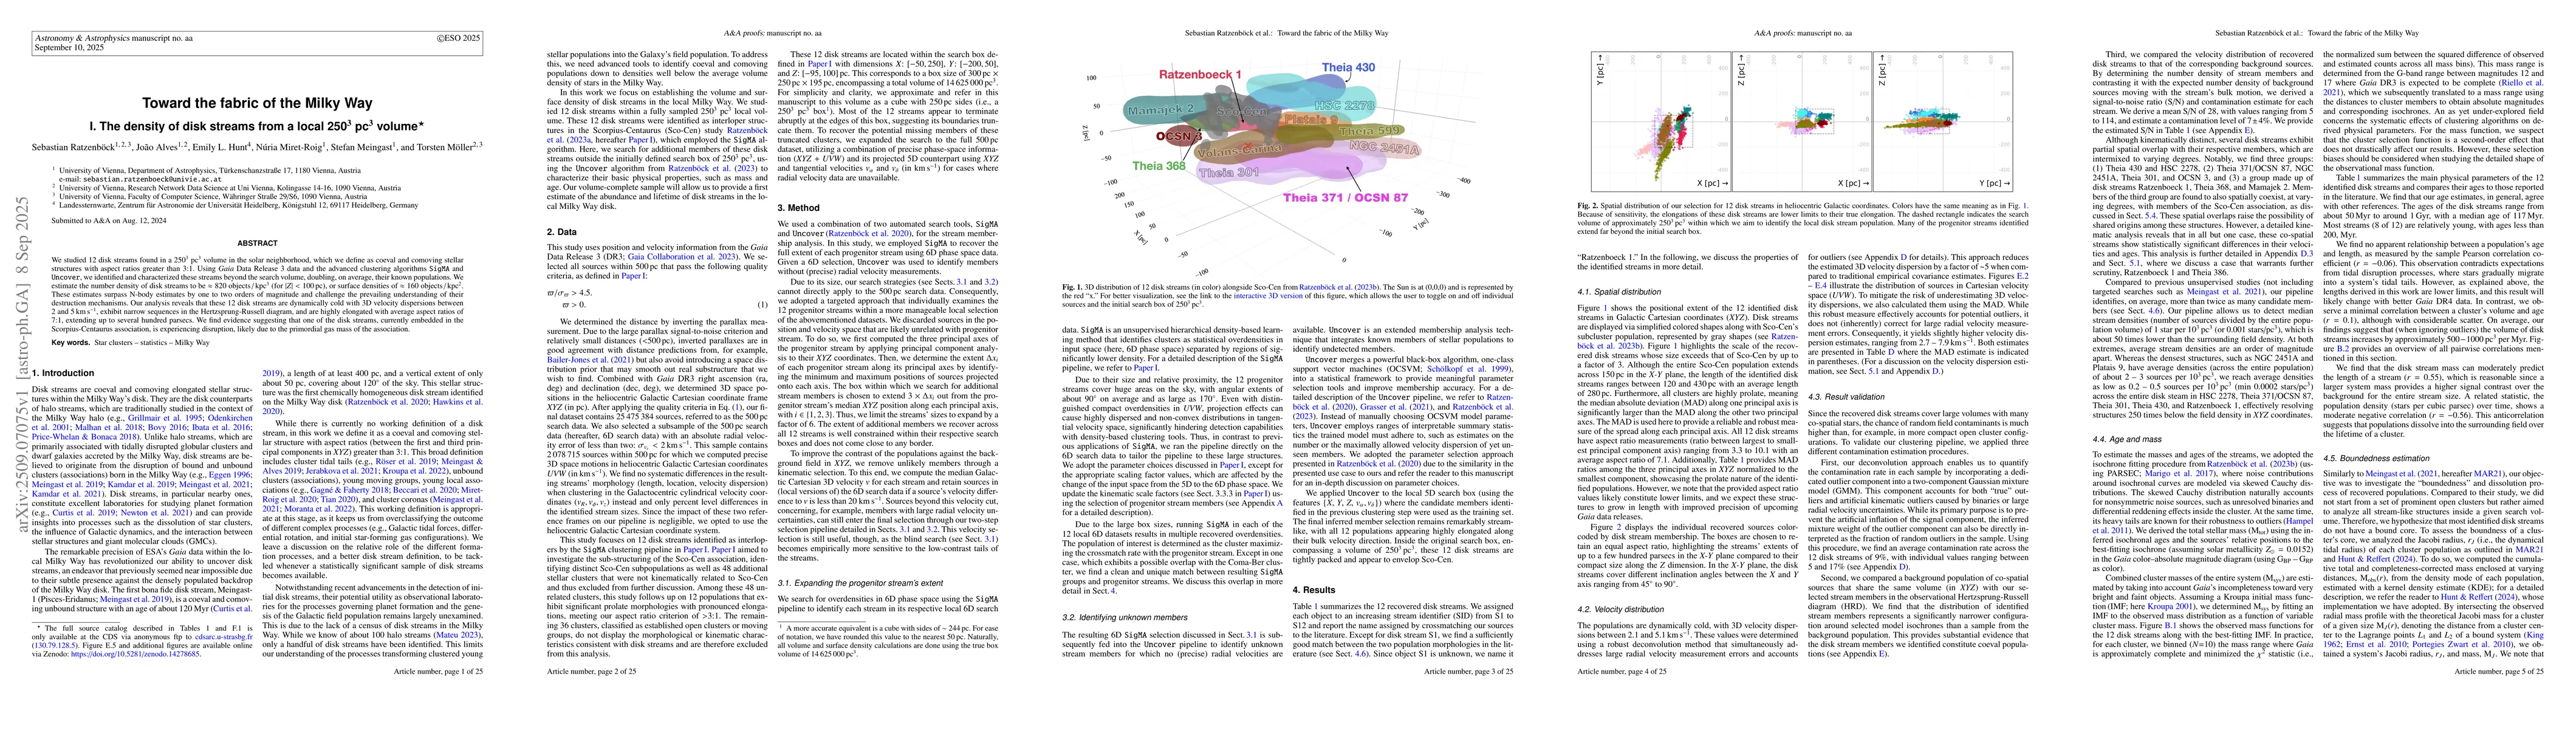
We studied 12 disk streams found in a 250$^3$ pc$^3$ volume in the solar neighborhood, which we define as coeval and comoving stellar structures with aspect ratios greater than 3:1. Using \emph{Gaia} ...

Thumbnail for PLUTO: A Public Value Assessment Tool
arXiv
PLUTO: A Public Value Assessment Tool

We present PLUTO (Public VaLUe Assessment TOol), a framework for assessing the public value of specific instances of data use. Grounded in the concept of data solidarity, PLUTO aims to empower diverse...

Thumbnail for Structured Visualization Design Knowledge for Grounding Generative Reasoning and Situated Feedback
arXiv
Structured Visualization Design Knowledge for Grounding Generative Reasoning and Situated Feedback

Automated visualization design navigates a tension between symbolic systems and generative models. Constraint solvers enforce structural and perceptual validity, but the rules they require are difficu...

Thumbnail for Investigating Performance and Practices with Univariate Distribution Charts
arXiv
Investigating Performance and Practices with Univariate Distribution Charts

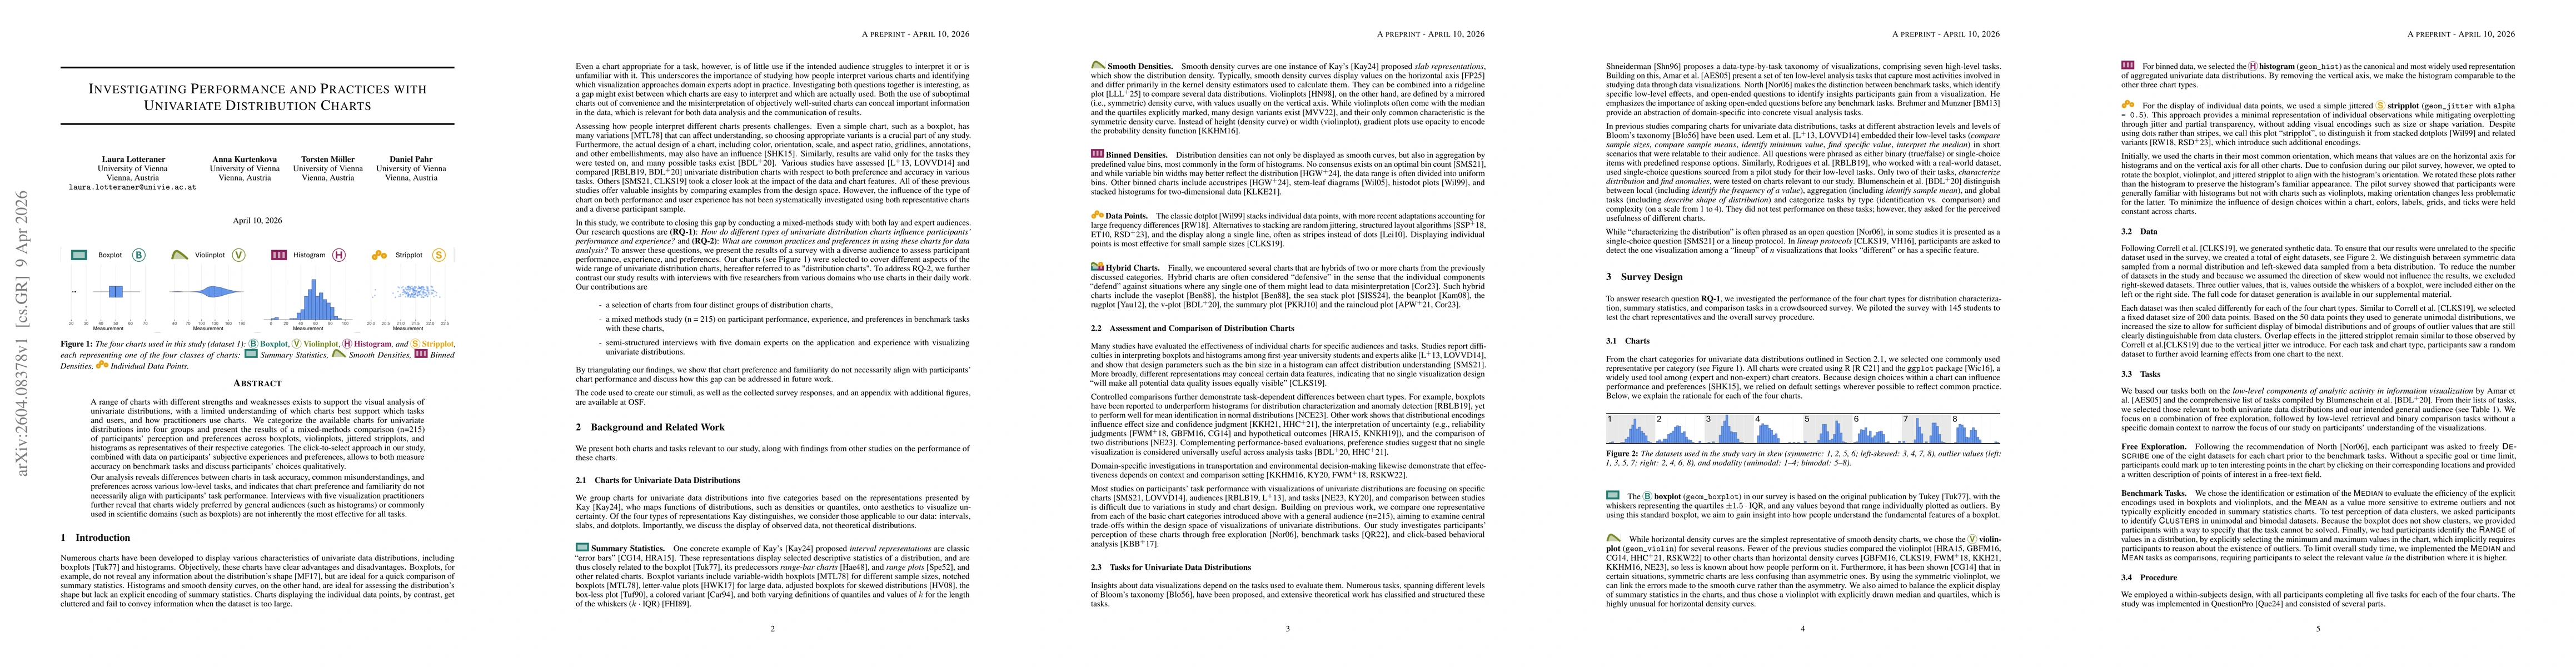
A range of charts with different strengths and weaknesses exists to support the visual analysis of univariate distributions, with a limited understanding of which charts best support which tasks and u...

This website uses cookies to ensure you get the best experience. Learn more