This study explores how data visualization practitioners design for lay audiences, revealing that while they aim for broad reach, they emphasize understanding their readers. However, current evaluation methods are limited, relying more on informal feedback than deep audience insights. The paper calls for more feasible evaluation strategies to better align visualizations with audience needs.
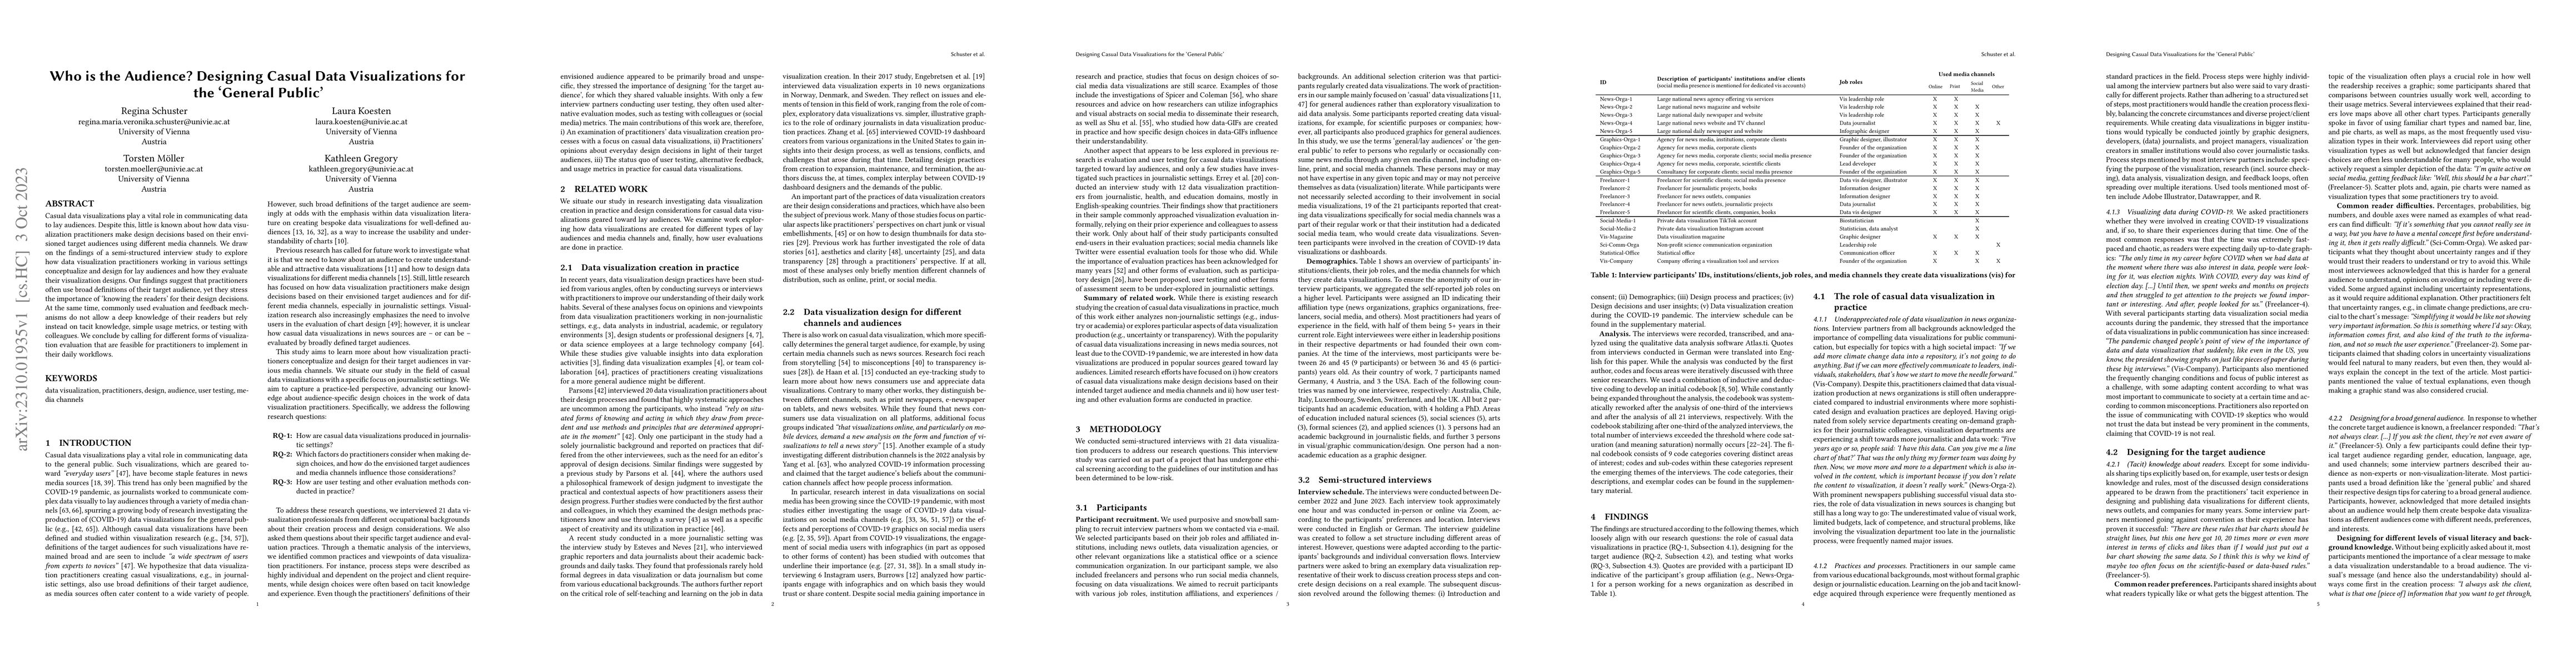
Casual data visualizations play a vital role in communicating data to lay audiences. Despite this, little is known about how data visualization practitioners make design decisions based on their envisioned target audiences using different media channels. We draw on the findings of a semi-structured interview study to explore how data visualization practitioners working in various settings conceptualize and design for lay audiences and how they evaluate their visualization designs. Our findings suggest that practitioners often use broad definitions of their target audience, yet they stress the importance of 'knowing the readers' for their design decisions. At the same time, commonly used evaluation and feedback mechanisms do not allow a deep knowledge of their readers but rely instead on tacit knowledge, simple usage metrics, or testing with colleagues. We conclude by calling for different forms of visualization evaluation that are feasible for practitioners to implement in their daily workflows.
Get AI-generated insights about this paper's methodology, results, and significance.
Current paper (gray), citations (green), references (blue)
Fateme Rajabiyazdi, Mahsa Sinaei Hamed, Pak Kwan et al.
Benjamin Bach, Tobias Kauer, Marian Dörk
Michael Gleicher, Remco Chang, Tatiana von Landesberger et al.
No citations found for this paper.
Title | Authors | Year | Actions |
---|---|---|---|
Who Do We Mean When We Talk About Visualization Novices?
|
Alyxander Burns, C. Lee, Ria Chawla, Evan M. Peck, Narges Mahyar
|
2023
|
View Paper |
What is the message? Perspectives on Visual Data Communication
|
Laura Koesten, Kathleen Gregory, Regina Schuster, Christian Knoll, Sarah Davies, T. Möller
|
2023
|
View Paper |
Evaluating narrative visualization: a survey of practitioners
|
Nina Errey, Jie Liang, T. Leong, Didar Zowghi
|
2023
|
View Paper |
Pretesting of Infographic as a Communication Tool on Pregnant Women During Covid-19 Period
|
Ayu Khoirotul Umaroh, Belinda Meliana Elisabet, Dewi Ayu Puspitasari, Feniati Rahayu Aisyah, Sylviasari Risgiantini, H. Pratomo
|
2023
|
View Paper |
“Being Simple on Complex Issues” – Accounts on Visual Data Communication About Climate Change
|
Regina Schuster, Kathleen Gregory, T. Möller, Laura Koesten
|
2022
|
View Paper |
Effect of visual imagery in COVID-19 social media posts on users’ perception
|
Waleed M. Al-nuwaiser
|
2022
|
View Paper |
Understanding how Designers Find and Use Data Visualization Examples
|
Hannah K. Bako, Xinyi Liu, L. Battle, Zhicheng Liu
|
2022
|
View Paper |
Visualization Design Practices in a Crisis: Behind the Scenes with COVID-19 Dashboard Creators
|
Yixuan Zhang, Yifan Sun, Joseph D. Gaggiano, Neha Kumar, Clio Andris, Andrea G. Parker
|
2022
|
View Paper |
Creating Effective Infographics and Visual Abstracts to Disseminate Research and Facilitate Medical Education on Social Media.
|
Jennifer O Spicer, Caroline G. Coleman
|
2022
|
View Paper |
Perceptions of using infographics for scientific communication on social media for COVID-19 topics: a survey study
|
Seung Heyck Lee, R. Pandya, J. Hussain, Rebecca Jennifer Lau, Emily Anne Brock Chambers, Apple Geng, Bernie Xiong Jin, Oliver Zhou, Tingting Wu, Lauren Barr, Murray Junop
|
2022
|
View Paper |
Sample sizes for saturation in qualitative research: A systematic review of empirical tests.
|
M. Hennink, B. Kaiser
|
2021
|
View Paper |
Audience Engagement When Disseminating Livestock Information Through Infographics on Social Media
|
H. Lochner, R. Swenson, K. Martinson
|
2021
|
View Paper |
Systematic Processing of COVID-19 Information: Relevant Channel Beliefs and Perceived Information Gathering Capacity as Moderators
|
J. Yang, Xinxia Dong, Zhuling Liu
|
2021
|
View Paper |
Understanding Data Visualization Design Practice
|
Paul C. Parsons
|
2021
|
View Paper |
Fixation and Creativity in Data Visualization Design: Experiences and Perspectives of Practitioners
|
Paul C. Parsons, P. Shukla, Chorong Park
|
2021
|
View Paper |
A coordinated strategy to develop and distribute infographics addressing COVID-19 vaccine hesitancy and misinformation
|
S. Rotolo, Shikha Jain, S. Dhaon, Jack K. Dokhanchi, Elzbieta Kalata, Tejal Shah, Lisa Mordell, M. Clayman, Alex Kenefake, L. J. Zimmermann, Eve Bloomgarden, V. Arora
|
2021
|
View Paper |
Reducing misperceptions through news stories with data visualization: The role of readers’ prior knowledge and prior beliefs
|
P. Mena
|
2021
|
View Paper |
Designing With Pictographs: Envision Topics Without Sacrificing Understanding
|
Alyxander Burns, Cindy Xiong, S. Franconeri, A. Cairo, Narges Mahyar
|
2021
|
View Paper |
The Public Life of Data: Investigating Reactions to Visualizations on Reddit
|
Tobias Kauer, Arran L. Ridley, M. Dörk, B. Bach
|
2021
|
View Paper |
Communicating COVID-19 information on TikTok: a content analysis of TikTok videos from official accounts featured in the COVID-19 information hub
|
Yachao Li, M. Guan, Paige Hammond, Lane E Berrey
|
2021
|
View Paper |
Viral Visualizations: How Coronavirus Skeptics Use Orthodox Data Practices to Promote Unorthodox Science Online
|
Crystal Lee, Tanya Yang, Gabrielle Inchoco, Graham M. Jones, Arvind Satyanarayan
|
2021
|
View Paper |
The role of titles in enhancing data visualization.
|
D. Wanzer, Tarek Azzam, Natalie D. Jones, Darrell J. Skousen
|
2020
|
View Paper |
Communicative Visualizations as a Learning Problem
|
Eytan Adar, Elsie Lee
|
2020
|
View Paper |
Design Judgment in Data Visualization Practice
|
Paul C. Parsons, Colin M. Gray, Ali Baigelenov, Ian Carr
|
2020
|
View Paper |
Data Visualization Practitioners’ Perspectives on Chartjunk
|
Paul C. Parsons, P. Shukla
|
2020
|
View Paper |
How to evaluate data visualizations across different levels of understanding
|
Alyxander Burns, Cindy Xiong, S. Franconeri, A. Cairo, Narges Mahyar
|
2020
|
View Paper |
Exploring Casual COVID-19 Data Visualizations on Twitter: Topics and Challenges
|
Milka Trajkova, A'aeshah Alhakamy, Francesco Cafaro, Sanika Veda, Rashmi Mallappa, Sreekanth R. Kankara
|
2020
|
View Paper |
Mapping the Landscape of COVID-19 Crisis Visualizations
|
Yixuan Zhang, Yifan Sun, Lace M. K. Padilla, Sumit Barua, E. Bertini, A. Parker
|
2020
|
View Paper |
What Makes a Data-GIF Understandable?
|
Xinhuan Shu, Aoyu Wu, Junxiu Tang, B. Bach, Yingcai Wu, Huamin Qu
|
2020
|
View Paper |
What Design Methods do DataVis Practitioners Know and Use?
|
Paul C. Parsons, Ali Baigelenov, Ya-Hsin Hung, Connor Schrank
|
2020
|
View Paper |
Data Visualization in Society
|
V. Lechner
|
2020
|
View Paper |
Evaluating data visualization : Broadening the measurements of success
|
Arran L. Ridley, C. Birchall
|
2020
|
View Paper |
Data visualization and transparency in the news
|
H. Kennedy, Wibke Weber, Martin Engebretsen
|
2020
|
View Paper |
Reaching Broader Audiences With Data Visualization
|
Bongshin Lee, E. Choe, Petra Isenberg, K. Marriott, J. Stasko, T. Rhyne
|
2020
|
View Paper |
How do Data Science Workers Collaborate? Roles, Workflows, and Tools
|
Amy X. Zhang, Michael J. Muller, Dakuo Wang
|
2020
|
View Paper |
Thumbnails for Data Stories: A Survey of Current Practices
|
Hwiyeon Kim, J. Oh, Yunha Han, Sungahn Ko, M. Brehmer, Bum Chul Kwon
|
2019
|
View Paper |
Why Authors Don't Visualize Uncertainty
|
J. Hullman
|
2019
|
View Paper |
Futzing and Moseying: Interviews with Professional Data Analysts on Exploration Practices
|
S. Alspaugh, N. Zokaei, Andrea Liu, Cindy Jin, Marti A. Hearst
|
2019
|
View Paper |
Data stories. Rethinking journalistic storytelling in the context of data journalism
|
Wibke Weber, Martin Engebretsen, H. Kennedy
|
2018
|
View Paper |
Aesthetics and Clarity in Information Visualization: The Designer’s Perspective
|
A. Quispel, A. Maes, J. Schilperoord
|
2018
|
View Paper |
Communicating Data to an Audience
|
S. Drucker, Samuel Huron, Robert Kosara, Jonathan A. Schwabish, N. Diakopoulos
|
2018
|
View Paper |
Visualization Practices in Scandinavian Newsrooms: A Qualitative Study
|
Martin Engebretsen, H. Kennedy, Wibke Weber
|
2017
|
View Paper |
When Does an Infographic Say More Than a Thousand Words?
|
Yael de Haan, S. Kruikemeier, S. Lecheler, G. Smit, Renée van der Nat
|
2017
|
View Paper |
How do People Make Sense of Unfamiliar Visualizations?: A Grounded Model of Novice's Information Visualization Sensemaking
|
Sukwon Lee, Sung-Hee Kim, Ya-Hsin Hung, Heidi Lam, Y. Kang, Ji Soo Yi
|
2016
|
View Paper |
Reflections on how designers design with data
|
Alex Bigelow, S. Drucker, Danyel Fisher, Miriah D. Meyer
|
2014
|
View Paper |
Evaluation in visualization: some issues and best practices
|
B. Santos, Paulo Dias
|
2013
|
View Paper |
Data Visualization in Online Journalism and Its Implications for the Production Process
|
Wibke Weber, Hannes Rall
|
2012
|
View Paper |
Narrative Visualization: Telling Stories with Data
|
E. Segel, Jeffrey Heer
|
2010
|
View Paper |
Useful junk?: the effects of visual embellishment on comprehension and memorability of charts
|
Scott Bateman, R. Mandryk, C. Gutwin, Aaron Genest, D. McDine, Christopher A. Brooks
|
2010
|
View Paper |
Casual Information Visualization: Depictions of Data in Everyday Life
|
Zachary Pousman, J. Stasko, Michael Mateas
|
2007
|
View Paper |
Statistics: Concepts and Controversies
|
D. Moore
|
1980
|
View Paper |
Data visualization in the news media: Trends and challenges. In Technology, Business, Innovation, and Entrepreneurship in Industry 4.0
|
2023
|
||
A guide to creating charts and graphs for social media
|
2023
|
||
. How can you create amazing data visualizations for social media?https://www.linkedin.com/advice/3/how-can-you-create-amazing-data-visualizations-social (accessedSeptember3,2023)
|
2023
|
||
Infographics are more effective at increasing social media attention in comparison with original research articles: An altmetricsbased analysis
|
2021
|
||
What 'Work' Can Dataviz Do in Popular Science Communication?
|
Martin Engebretsen
|
2020
|
View Paper |
Participatory Visualization Design as an Approach to Minimize the Gap between Research and Application
|
S. Jänicke, Pawandeep Kaur, Pawel Kuzmicki, Johanna Schmidt
|
2020
|
View Paper |
Reflections on Visualization for Broad Audiences
|
M. Böttinger, H. Kostis, Maria C. Velez-Rojas, P. Rheingans, A. Ynnerman
|
2020
|
View Paper |
Real world research,4th Edition
|
2017
|
||
Code saturation versus meaning saturation: How many inter-views are enough?
|
2017
|
||
Images of climate change – a pilot study of young people’s perceptions of ICT-based climate visualization
|
A. Ballantyne, Victoria Wibeck, T. Neset
|
2015
|
View Paper |
Using thematic analysis in psychology
|
2006
|
||
How Many Interviews Are Enough? An Experiment with Data Saturation and Variability
|
2005
|
||
RQ-2: Which factors do practitioners consider when making de-sign choices, and how do the envisioned target audiences and media channels influence those considerations?
|
|||
Tselova
|
|||
2023. What is the message?
|
|||
RQ-1: How are casual data visualizations produced in journalistic settings?
|
|||
2022. “I learned it on the job”: Becoming a data visualization professional in news media
|
|||
2023. Sharing in the echo chamber: Examining Instagram users’ engagement with infographics through the frame of digital literacy
|
Showing first page preview. Click "Open Full PDF" to view the complete paper.
Your comment contains inappropriate language and has been rejected.
Are you sure you want to remove this tag? This action cannot be undone.
Someone just favorited a paper!
Comments (0)