ArxivLens

Quick Summary:

This study explores how Reddit users engage with data visualizations by analyzing 475 reactions and identifying ten distinct reaction types, revealing personal perspectives and motivations that inform public discourse on data. A follow-up survey further clarifies user intentions, contributing to the design of interfaces that integrate audience feedback into visualizations.

DOI: 10.1145/3411764.3445720
arXiv Id: 2103.08525
Date Published: 2021-03-18
Date Updated: 2021-03-18

Categories:

Key Terms (TF-IDF):

reactions (0.329)
reactions (0.328)
people (0.320)
people (0.304)
public (0.230)
social (0.230)
public (0.223)
social (0.222)
research (0.220)
research (0.209)
expertise (0.179)
collaborative (0.174)
data (0.172)
data (0.169)
featuring (0.164)
investigates (0.163)
interfaces (0.163)
communities (0.161)
collaborative (0.161)
perspectives (0.161)
License: http://creativecommons.org/licenses/by/4.0/

Summary:

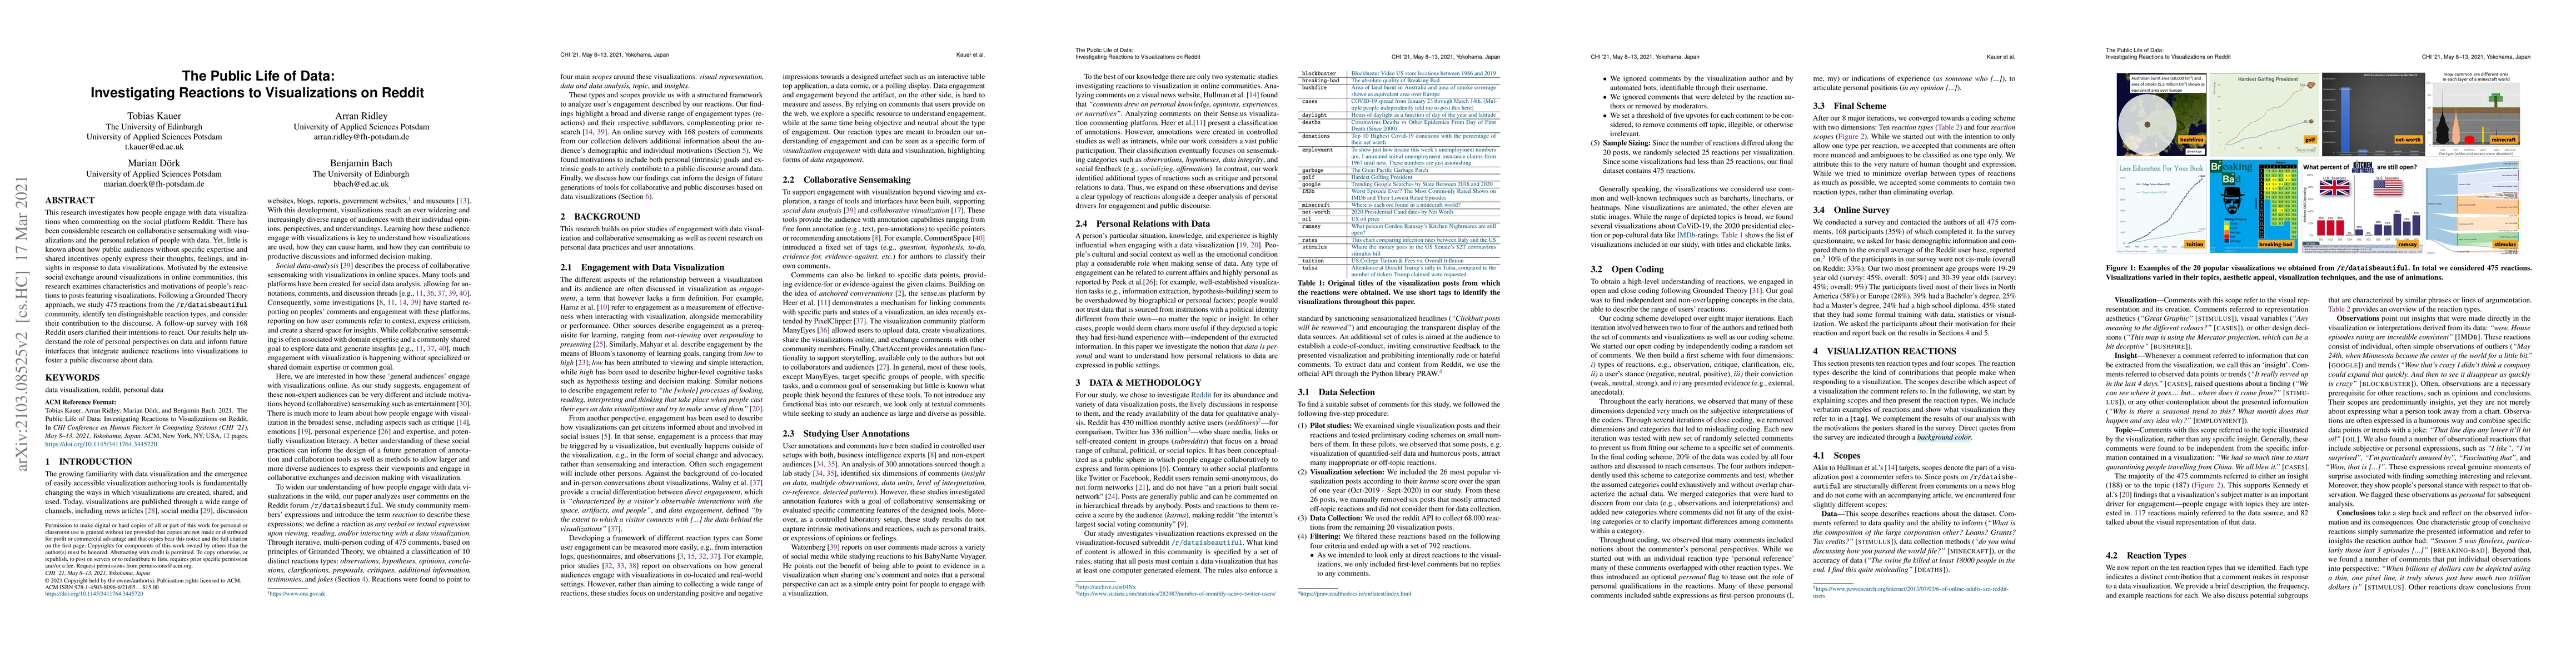
This research investigates how people engage with data visualizations when commenting on the social platform Reddit. There has been considerable research on collaborative sensemaking with visualizations and the personal relation of people with data. Yet, little is known about how public audiences without specific expertise and shared incentives openly express their thoughts, feelings, and insights in response to data visualizations. Motivated by the extensive social exchange around visualizations in online communities, this research examines characteristics and motivations of people's reactions to posts featuring visualizations. Following a Grounded Theory approach, we study 475 reactions from the /r/dataisbeautiful community, identify ten distinguishable reaction types, and consider their contribution to the discourse. A follow-up survey with 168 Reddit users clarified their intentions to react. Our results help understand the role of personal perspectives on data and inform future interfaces that integrate audience reactions into visualizations to foster a public discourse about data.

Citation & Reference Network Visualization

This graph shows how this paper is connected to other research. The current paper is shown in dark gray, papers that cite it are in green, and papers it references are in blue. You can:

Current Paper
Papers citing this work (Citations)
Papers cited by this work (References)

• Hover over any node to see the paper title

• Click a node to view that paper's details

• Drag nodes to rearrange the graph

• Use the zoom controls (bottom right) to zoom in/out

Citations and References

Title Authors Year Actions
Towards Collective Storytelling: Investigating Audience Annotations in Data Visualizations.
Tobias Kauer, Marian Dörk, Benjamin Bach
2025
View Paper
Misleading Whom? Assumptions about Map Users and Engagement Contexts in COVID-19 Map Misleadingness Claims
Johanna Meyer, D. Stanton Fraser, Julie Barnett
2024
View Paper
A Survey on Annotations in Information Visualization: Empirical Insights, Applications, and Challenges
Md Dilshadur Rahman, Bhavana Doppalapudi, Ghulam Jilani Quadri, Paul Rosen
2024
View Paper
Exploring annotation taxonomy in grouped bar charts: A qualitative classroom study
Md Dilshadur Rahman, Ghulam Jilani Quadri, D. Szafir, Paul Rosen
2024
View Paper
Discursive Patinas: Anchoring Discussions in Data Visualizations
Tobias Kauer, Derya Akbaba, Marian Dörk, Benjamin Bach
2024
View Paper
“I Came Across a Junk”: Understanding Design Flaws of Data Visualization from the Public's Perspective
Xingyu Lan, Yu Liu
2024
View Paper
DataDive: Supporting Readers' Contextualization of Statistical Statements with Data Exploration
Hyunwoo Kim, Khanh-Duy Le, Gionnieve Lim, Dae Hyun Kim, Yoo Jin Hong, Juho Kim
2024
View Paper
Clover Connections: Visualising Character Dynamics in Novels for Non-Experts
Natalie House, Andrew Johnston
2023
View Paper
Show Me My Users: A Dashboard Visualizing User Interaction Logs
Jinrui Wang, Mashael AlKadi, Benjamin Bach
2023
View Paper
Who is the Audience? Designing Casual Data Visualizations for the 'General Public'
Regina Schuster, Laura Koesten, T. Möller, Kathleen Gregory
2023
View Paper
Affective Visualization Design: Leveraging the Emotional Impact of Data
Xingyu Lan, Yanqiu Wu, Nan Cao
2023
View Paper
A Qualitative Analysis of Common Practices in Annotations: A Taxonomy and Design Space
Md Dilshadur Rahman, Ghulam Jilani Quadri, Bhavana Doppalapudi, D. Szafir, Paul Rosen
2023
View Paper
Vizdat: A Technology Probe to Understand the Space of Discussion Around Data Visualization on Reddit
Jumana Almahmoud, David R Karger
2023
View Paper
Engagement or Knowledge Retention: Exploring Trade-offs in Promoting Discussion at News Websites
B. McInnis, Leah Ajmani, Steven W. Dow
2022
View Paper
From Self-Tracking to Sleep-Hacking
Kasper Karlgren, Barry A. T. Brown, Donald Mcmillan
2022
View Paper
Undoing Seamlessness: Exploring Seams for Critical Visualization
N. Hengesbach
2022
View Paper
Exploring D3 Implementation Challenges on Stack Overflow
L. Battle, Danni Feng, Kelli Webber
2021
View Paper
“It’s Just a Graph” – The Effect of Post-Hoc Rationalisation on InfoVis Evaluation
Rosa van Koningsbruggen, E. Hornecker
2021
View Paper
Exploring Visualization Implementation Challenges Faced by D3 Users Online
L. Battle, Danni Feng, Kelli Webber
2021
View Paper

Comments (0)

This website uses cookies to ensure you get the best experience. Learn more