This study explores how data visualizations can effectively communicate complex climate change information to diverse audiences. Findings from interviews with experts and laypersons reveal differences in message formulation and abstraction, suggesting that more effective visualizations should adapt content to audience needs while balancing simplification and accuracy.
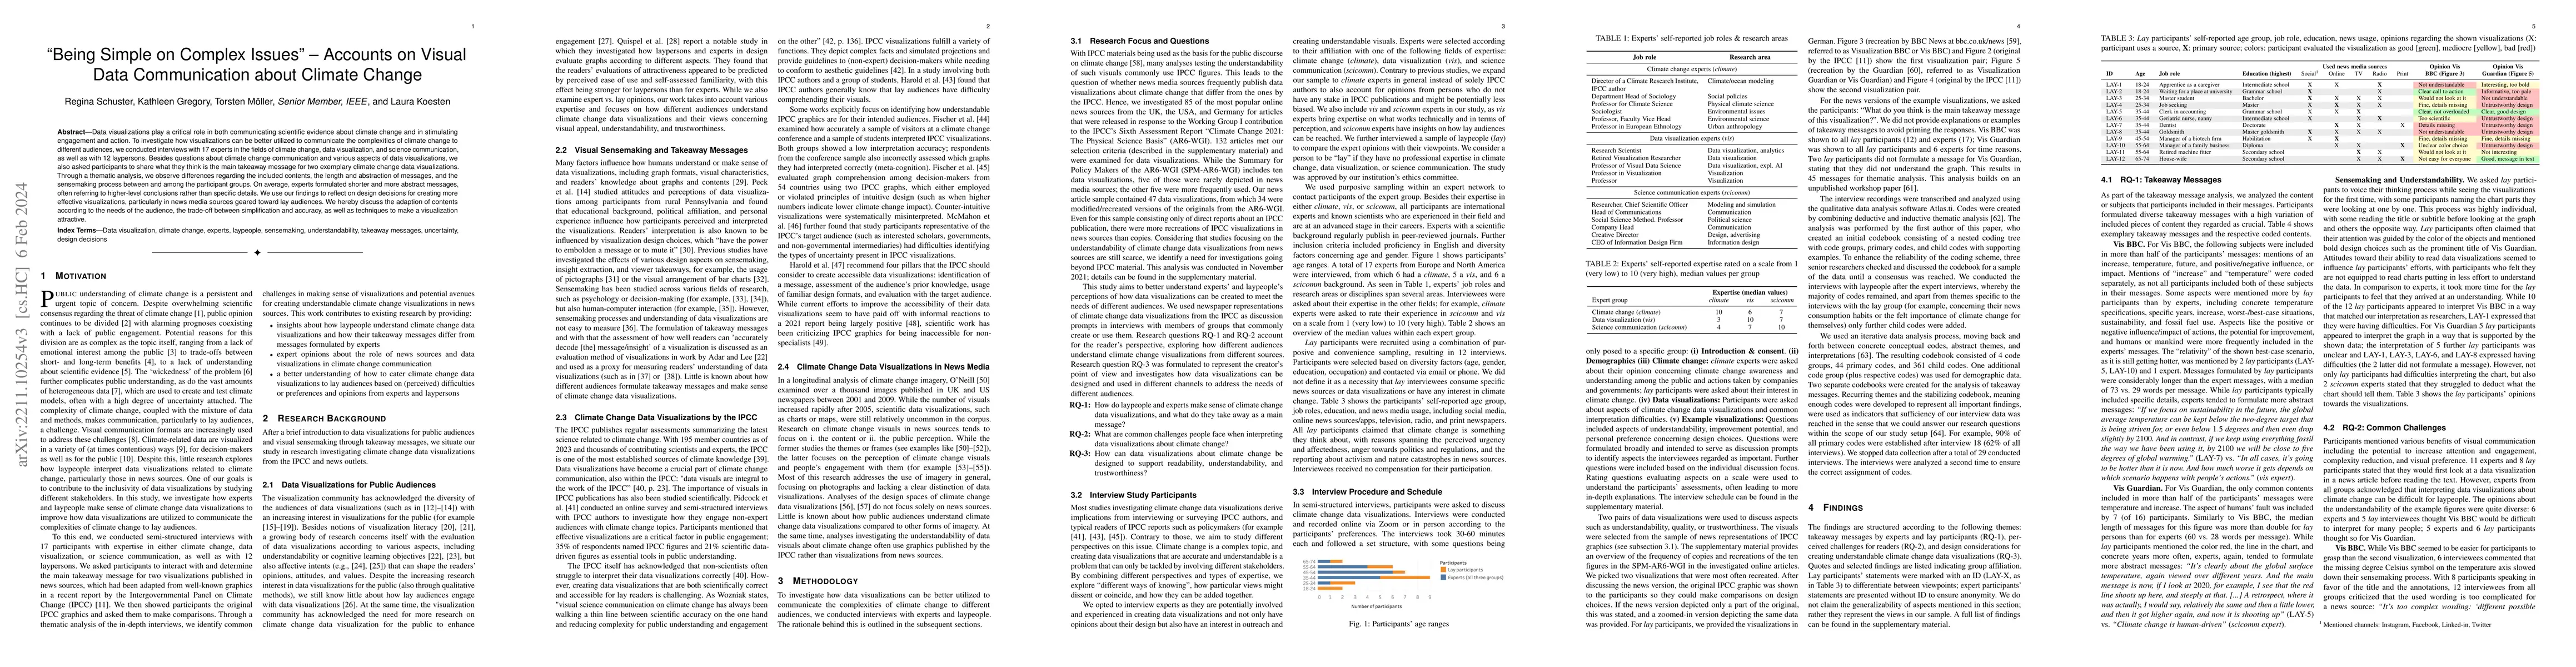
Data visualizations play a critical role in both communicating scientific evidence about climate change and in stimulating engagement and action. To investigate how visualizations can be better utilized to communicate the complexities of climate change to different audiences, we conducted interviews with 17 experts in the fields of climate change, data visualization, and science communication, as well as with 12 laypersons. Besides questions about climate change communication and various aspects of data visualizations, we also asked participants to share what they think is the main takeaway message for two exemplary climate change data visualizations. Through a thematic analysis, we observe differences regarding the included contents, the length and abstraction of messages, and the sensemaking process between and among the participant groups. On average, experts formulated shorter and more abstract messages, often referring to higher-level conclusions rather than specific details. We use our findings to reflect on design decisions for creating more effective visualizations, particularly in news media sources geared toward lay audiences. We hereby discuss the adaption of contents according to the needs of the audience, the trade-off between simplification and accuracy, as well as techniques to make a visualization attractive.
Get AI-generated insights about this paper's methodology, results, and significance.
Current paper (gray), citations (green), references (blue)
No similar papers found for this research.
Title | Authors | Year | Actions |
---|---|---|---|
E-participation in energy transitions: What does it mean? Chances and challenges within Germany's Energiewende
|
Jörg Radtke
|
2025
|
View Paper |
Complexity as Design Material Position Paper
|
Florian Windhager, Alfie Abdul-Rahman, Mark-Jan Bludau, Nicole Hengesbach, Houda Lamqaddam, Isabel Meirelles, Bettina Speckmann, Michael Correll
|
2024
|
View Paper |
Who is the Audience? Designing Casual Data Visualizations for the 'General Public'
|
Regina Schuster, Laura Koesten, T. Möller, Kathleen Gregory
|
2023
|
View Paper |
Title | Authors | Year | Actions |
---|---|---|---|
From Shock to Shift: Data Visualization for Constructive Climate Journalism
|
F. Morini, Anna Eschenbacher, Johanna Hartmann, Marian Dörk
|
2023
|
View Paper |
Enthusiastic and Grounded, Avoidant and Cautious: Understanding Public Receptivity to Data and Visualizations
|
H. He, Jagoda Walny, Sonja Thoma, Sheelagh Carpendale, Wesley Willett
|
2023
|
View Paper |
Polarizing Political Polls: How Visualization Design Choices Can Shape Public Opinion and Increase Political Polarization
|
Eli Holder, Cindy Xiong Bearfield
|
2023
|
View Paper |
"The main message is that sustainability would help" - Reflections on takeaway messages of climate change data visualizations
|
Regina Schuster, Laura Koesten, Kathleen Gregory, T. Möller
|
2023
|
View Paper |
Who Do We Mean When We Talk About Visualization Novices?
|
Alyxander Burns, C. Lee, Ria Chawla, Evan M. Peck, Narges Mahyar
|
2023
|
View Paper |
From Invisible to Visible: Impacts of Metadata in Communicative Data Visualization
|
Alyxander Burns, C. Lee, Thai On, Cindy Xiong, Evan M. Peck, Narges Mahyar
|
2022
|
View Paper |
Affective Learning Objectives for Communicative Visualizations
|
Elsie Lee-Robbins, Eytan Adar
|
2022
|
View Paper |
Affect and emotions as drivers of climate change perception and action: a review
|
T. Brosch
|
2021
|
View Paper |
The Science of Visual Data Communication: What Works
|
S. Franconeri, Lace M. K. Padilla, P. Shah, Jeffrey M. Zacks, J. Hullman
|
2021
|
View Paper |
Sample sizes for saturation in qualitative research: A systematic review of empirical tests.
|
M. Hennink, B. Kaiser
|
2021
|
View Paper |
Evaluating effective public engagement: local stories from a global network of IPCC scientists
|
R. Pidcock, Katelyn Heath, Lydia Messling, Susie Wang, A. Pirani, Sarahl L. Connors, A. Corner, Christopher L. Shaw, M. Gomis
|
2021
|
View Paper |
Co-designing engaging and accessible data visualisations: a case study of the IPCC reports
|
Angela Morelli, Tom Gabriel Johansen, R. Pidcock, Jordan Harold, A. Pirani, M. Gomis, I. Lorenzoni, E. Haughey, K. Coventry
|
2021
|
View Paper |
Beyond the Guise of Saturation: Rigor and Qualitative Interview Data.
|
K. LaDonna, A. Artino, D. Balmer
|
2021
|
View Paper |
Accessible Visualization via Natural Language Descriptions: A Four-Level Model of Semantic Content
|
Alan Lundgard, Arvind Satyanarayan
|
2021
|
View Paper |
An IPCC that listens: introducing reciprocity to climate change communication
|
Karl Dudman, Sara de Wit
|
2021
|
View Paper |
Visual Arrangements of Bar Charts Influence Comparisons in Viewer Takeaways
|
Cindy Xiong, V. Setlur, Benjamin Bach, Kylie Lin, Eunyee Koh, S. Franconeri
|
2021
|
View Paper |
Designing With Pictographs: Envision Topics Without Sacrificing Understanding
|
Alyxander Burns, Cindy Xiong, S. Franconeri, A. Cairo, Narges Mahyar
|
2021
|
View Paper |
Climate Change Communication in HCI: a Visual Analysis of the Past Decade
|
M. Ferreira, Miguel F. Coelho, Valentina Nisi, Nuno Jardim Nunes
|
2021
|
View Paper |
Explaining how long CO₂ stays in the atmosphere: Does it change attitudes toward climate change?
|
S. Joslyn, Raoni Demnitz
|
2021
|
View Paper |
Stakeholders visual representations of climate change
|
Antal Wozniak
|
2020
|
View Paper |
When IPCC graphs can foster or bias understanding: evidence among decision-makers from governmental and non-governmental institutions
|
H. Fischer, K. L. van den Broek, Kilian Ramisch, Yasmina Okan
|
2020
|
View Paper |
Communicative Visualizations as a Learning Problem
|
Eytan Adar, Elsie Lee
|
2020
|
View Paper |
A Research Agenda for Climate Change Communication and Public Opinion: The Role of Scientific Consensus Messaging and Beyond
|
R. Bayes, T. Bolsen, James N. Druckman
|
2020
|
View Paper |
How to evaluate data visualizations across different levels of understanding
|
Alyxander Burns, Cindy Xiong, S. Franconeri, A. Cairo, Narges Mahyar
|
2020
|
View Paper |
Cartographic content analysis of compelling climate change communication
|
C. Fish
|
2020
|
View Paper |
Storytelling for Making Cartographic Design Decisions for Climate Change Communication in the United States
|
C. Fish
|
2020
|
View Paper |
Visualizations of Projected Rainfall Change in the United Kingdom: An Interview Study about User Perceptions
|
A. Kause, W. Bruine de Bruin, F. Fung, Andrea L. Taylor, J. Lowe
|
2020
|
View Paper |
Reaching Broader Audiences With Data Visualization
|
Bongshin Lee, E. Choe, Petra Isenberg, K. Marriott, J. Stasko, T. Rhyne
|
2020
|
View Paper |
Communication of IPCC visuals: IPCC authors’ views and assessments of visual complexity
|
Jordan Harold, I. Lorenzoni, T. Shipley, K. Coventry
|
2019
|
View Paper |
More than meets the eye: a longitudinal analysis of climate change imagery in the print media
|
S. O'Neill
|
2019
|
View Paper |
Storytelling and Sensemaking through Data Visualization
|
Karl Giuseffi, Benjamin Sievert, Brett M. Wells, F. Westfall
|
2019
|
View Paper |
Data is Personal: Attitudes and Perceptions of Data Visualization in Rural Pennsylvania
|
Evan M. Peck, Sofia E. Ayuso, Omar El-Etr
|
2019
|
View Paper |
Graphoto: Aesthetically Pleasing Charts for Casual Information Visualization
|
Ji Hwan Park, A. Kaufman, K. Mueller
|
2018
|
View Paper |
The Feeling of Numbers: Emotions in Everyday Engagements with Data and Their Visualisation
|
H. Kennedy, R. Hill
|
2018
|
View Paper |
Visualizing the Paris Climate Talks on Twitter: Media and Climate Stakeholder Visual Social Media During COP21
|
Jill E. Hopke, Luis E. Hestres
|
2018
|
View Paper |
How Well Do COP22 Attendees Understand Graphs on Climate Change Health Impacts from the Fifth IPCC Assessment Report?
|
H. Fischer, S. Schütte, A. Depoux, D. Amelung, R. Sauerborn
|
2018
|
View Paper |
Frames and Slants in Titles of Visualizations on Controversial Topics
|
H. Kong, Zhicheng Liu, Karrie Karahalios
|
2018
|
View Paper |
Public engagement with climate imagery in a changing digital landscape
|
Susie Wang, A. Corner, Daniel A. Chapman, E. Markowitz
|
2018
|
View Paper |
Is There Any Hope? How Climate Change News Imagery and Text Influence Audience Emotions and Support for Climate Mitigation Policies
|
Lauren A. Feldman, P. S. Hart
|
2018
|
View Paper |
Selective attention, diffused attention, and the development of categorization
|
Wei Deng, V. Sloutsky
|
2016
|
View Paper |
Cognitive and psychological science insights to improve climate change data visualization
|
Jordan Harold, I. Lorenzoni, T. Shipley, K. Coventry
|
2016
|
View Paper |
Global Multimodal News Frames on Climate Change
|
Hartmut Wessler, Antal Wozniak, Lutz Hofer, Julia Lück
|
2016
|
View Paper |
The scientific veneer of IPCC visuals
|
R. McMahon, M. Stauffacher, R. Knutti
|
2016
|
View Paper |
Graph and chart aesthetics for experts and laymen in design: The role of familiarity and perceived ease of use
|
A. Quispel, A. Maes, J. Schilperoord
|
2016
|
View Paper |
Beyond Memorability: Visualization Recognition and Recall
|
M. Borkin, Z. Bylinskii, N. Kim, C. Bainbridge, Chelsea S. Yeh, Daniel Borkin, H. Pfister, A. Oliva
|
2016
|
View Paper |
How do People Make Sense of Unfamiliar Visualizations?: A Grounded Model of Novice's Information Visualization Sensemaking
|
Sukwon Lee, Sung-Hee Kim, Ya-Hsin Hung, Heidi Lam, Y. Kang, Ji Soo Yi
|
2016
|
View Paper |
Eye Fixation Metrics for Large Scale Evaluation and Comparison of Information Visualizations
|
Z. Bylinskii, M. Borkin, N. Kim, H. Pfister, A. Oliva
|
2015
|
View Paper |
The unseen uncertainties in climate change: reviewing comprehension of an IPCC scenario graph
|
R. McMahon, M. Stauffacher, R. Knutti
|
2015
|
View Paper |
A Principled Way of Assessing Visualization Literacy
|
Jeremy Boy, Ronald A. Rensink, E. Bertini, Jean-Daniel Fekete
|
2014
|
View Paper |
The sciences of science communication
|
Baruch Fischhoff
|
2013
|
View Paper |
A sensemaking perspective on framing the mental picture of air traffic controllers.
|
Stathis Malakis, T. Kontogiannis
|
2013
|
View Paper |
Exploring how and why people use visualizations in casual contexts: Modeling user goals and regulated motivations
|
David W. Sprague, Melanie Tory
|
2012
|
View Paper |
Climate model simulation visualization from a visual studies perspective
|
B. Schneider
|
2012
|
View Paper |
Visualization Rhetoric: Framing Effects in Narrative Visualization
|
J. Hullman, N. Diakopoulos
|
2011
|
View Paper |
Evaluating Climate Visualization: An Information Visualization Approach
|
J. Johansson, T. Neset, Björn‐Ola Linnér
|
2010
|
View Paper |
Useful junk?: the effects of visual embellishment on comprehension and memorability of charts
|
Scott Bateman, R. Mandryk, C. Gutwin, Aaron Genest, D. McDine, Christopher A. Brooks
|
2010
|
View Paper |
Summary for Policymakers
|
Meera Chatterjee, Ruth Levine, Nirmala Murthy, Shreelata Rao-Seshadri
|
2007
|
View Paper |
Casual Information Visualization: Depictions of Data in Everyday Life
|
Zachary Pousman, J. Stasko, Michael Mateas
|
2007
|
View Paper |
A Data–Frame Theory of Sensemaking
|
Gary Klein, Jennifer K. Phillips, Erica Rall, Deborah A. Peluso
|
2007
|
View Paper |
Performance
|
홍원식
|
2005
|
View Paper |
Bothered by abstraction: the effect of expertise on knowledge transfer and subsequent novice performance.
|
Pamela J. Hinds, Michael E. Patterson, J. Pfeffer
|
2001
|
View Paper |
Action Bias and Environmental Decisions
|
A. Patt, R. Zeckhauser
|
2000
|
View Paper |
Digital Earth
|
M. Halem, S. Hoban
|
1999
|
View Paper |
The cost structure of sensemaking
|
D. Russell, M. Stefik, P. Pirolli, S. Card
|
1993
|
View Paper |
Status quo bias in decision making
|
William Samuelson, R. Zeckhauser
|
1988
|
View Paper |
Climate change: Five things we have learned from the IPCC report
|
2023
|
||
State of Climate Action 2021: Systems Transformations Required to Limit Global Warming to 1.5°C
|
Sophie Boehm, Katie Lebling, K. Levin, Hanna Fekete, Joel Jaeger, R. Waite, Anna Nilsson, Joe Thwaites, Ryan Wilson, A. Geiges, Clea F. Schumer, M. Dennis, Katie Ross, Sebastian Castellanos, R. Shrestha, Neelam Singh, M. Weisse, Leah Lazer, Louise Jeffery, Lydia Freehafer, E. Gray, Lihuan Zhou, M. Gidden, Madeleine Galvin
|
2021
|
View Paper |
The influence of personality traits on attitudes towards climate change – An exploratory study
|
K. Rothermich, E. Johnson, Rachel M. Griffith, Monica Marie Beingolea
|
2021
|
View Paper |
“Why the bad news in the IPCC report is good news for visual learners,”
|
2021
|
||
IPCC SPM Figures
|
2021
|
||
“AR6 WGI SPM Basic slide deck with figures,”
|
2021
|
||
“In response to climate change, citizens in advanced economies are willing to alter how they live and work,”
|
2021
|
||
Reflections on Visualization for Broad Audiences
|
M. Böttinger, H. Kostis, Maria C. Velez-Rojas, P. Rheingans, A. Ynnerman
|
2020
|
View Paper |
On Inconvenient Images: Exploring the Design Space of Engaging Climate Change Visualizations for Public Audiences
|
F. Windhager, Günther Schreder, E. Mayr
|
2019
|
View Paper |
“Principlesforeffectivecommunication andpublicengagementonclimatechange:AhandbookforIPCCauthors,”Oxford
|
2018
|
||
“Why people aren’t motivated to address climate change,”
|
2018
|
||
Enhancing the accessibility of climate change data visuals:Recommendations to the IPCC and guidance for researchers
|
Jordan Harold, I. Lorenzoni, K. Coventry, A. Minns
|
2017
|
View Paper |
Investigation of Visualization Literacy: A Visualization Sensemaking Model, a Visualization Literacy Assessment Test, and the Effects of Cognitive Characteristics
|
Sukwon Lee
|
2017
|
View Paper |
VLAT: Development of a Visualization Literacy Assessment Test
|
Sukwon Lee, Sung-Hee Kim, Bum Chul Kwon
|
2017
|
View Paper |
“Real world research, 4th edition,”
|
2017
|
||
Code saturation versus meaning saturation: How many interviews are enough?
|
2017
|
||
BubbleView: An interface for crowdsourcing image importance maps and tracking visual attention
|
2017
|
||
Analysing qualitative data using an iterative process
|
J. Kekeya
|
2016
|
View Paper |
self-efficacy in Germany, Switzerland, and Austria
|
2016
|
||
“Perceptions of climate change imagery: Evoked salience and self-efficacy in Germany, Switzerland, and Austria,”
|
2016
|
||
Images of climate change – a pilot study of young people’s perceptions of ICT-based climate visualization
|
A. Ballantyne, Victoria Wibeck, T. Neset
|
2015
|
View Paper |
Climate change and visual imagery
|
S. O'Neill, Nicholas J. Smith
|
2014
|
View Paper |
Summary for policymakers
|
J. Rogelj
|
2013
|
View Paper |
The Hockey Stick and the Climate Wars
|
M. Mann
|
2012
|
View Paper |
The non-designer's presentaion book : principles for effective presentation design
|
Robin Williams
|
2010
|
View Paper |
Wicked Problems in Public Policy
|
J. Alford, A. Fenna, P. Weller, A. Podger
|
2009
|
View Paper |
Visualization of Climate and Climate Change Data : An Overview
|
T. Nocke, M. Böttinger, Markus Wrobel
|
2008
|
View Paper |
How Many Interviews Are Enough? An Experiment with Data Saturation and Variability
|
2005
|
||
article has supplementary downloadable material
|
|||
University of Vienna, 1090 Vienna, Austria
|
|||
[attagesschau]
|
|||
RQ-2: What are common challenges people face when interpreting data visualizations about climate change?
|
|||
Between1999and2012,heservedasacomputingscience facultymember,SimonFraserUniversity HeisaseniormemberofACMandamemberofEu-rographics
|
|||
and tools for analyzing and displaying data with principles rooted in
|
|||
Kathleen Gregory is with the Centre for Science and Technology Studies (CWTS), Leiden University, 2300 Leiden, Netherlands
|
|||
“So hat sich die globale Temperatur der Erde entwickelt,”
|
|||
As a verdict on the climate crimes of humanity, the new Intergovernmental Panel on Climate Change report could not be clearer: We're guilty as hell
|
|||
“About the IPCC,”
|
|||
“Communicative information visualizations: How to make data more understandable by the general public,”
|
Showing first page preview. Click "Open Full PDF" to view the complete paper.
Your comment contains inappropriate language and has been rejected.
Are you sure you want to remove this tag? This action cannot be undone.
Someone just favorited a paper!
Comments (0)