This study explores the gap between intended and perceived messages in data visualizations through mixed-methods involving workshops and interviews with diverse audiences. Findings highlight the challenges in understanding complex charts and suggest that chart producers could benefit from more abstract representations to better convey specific messages.
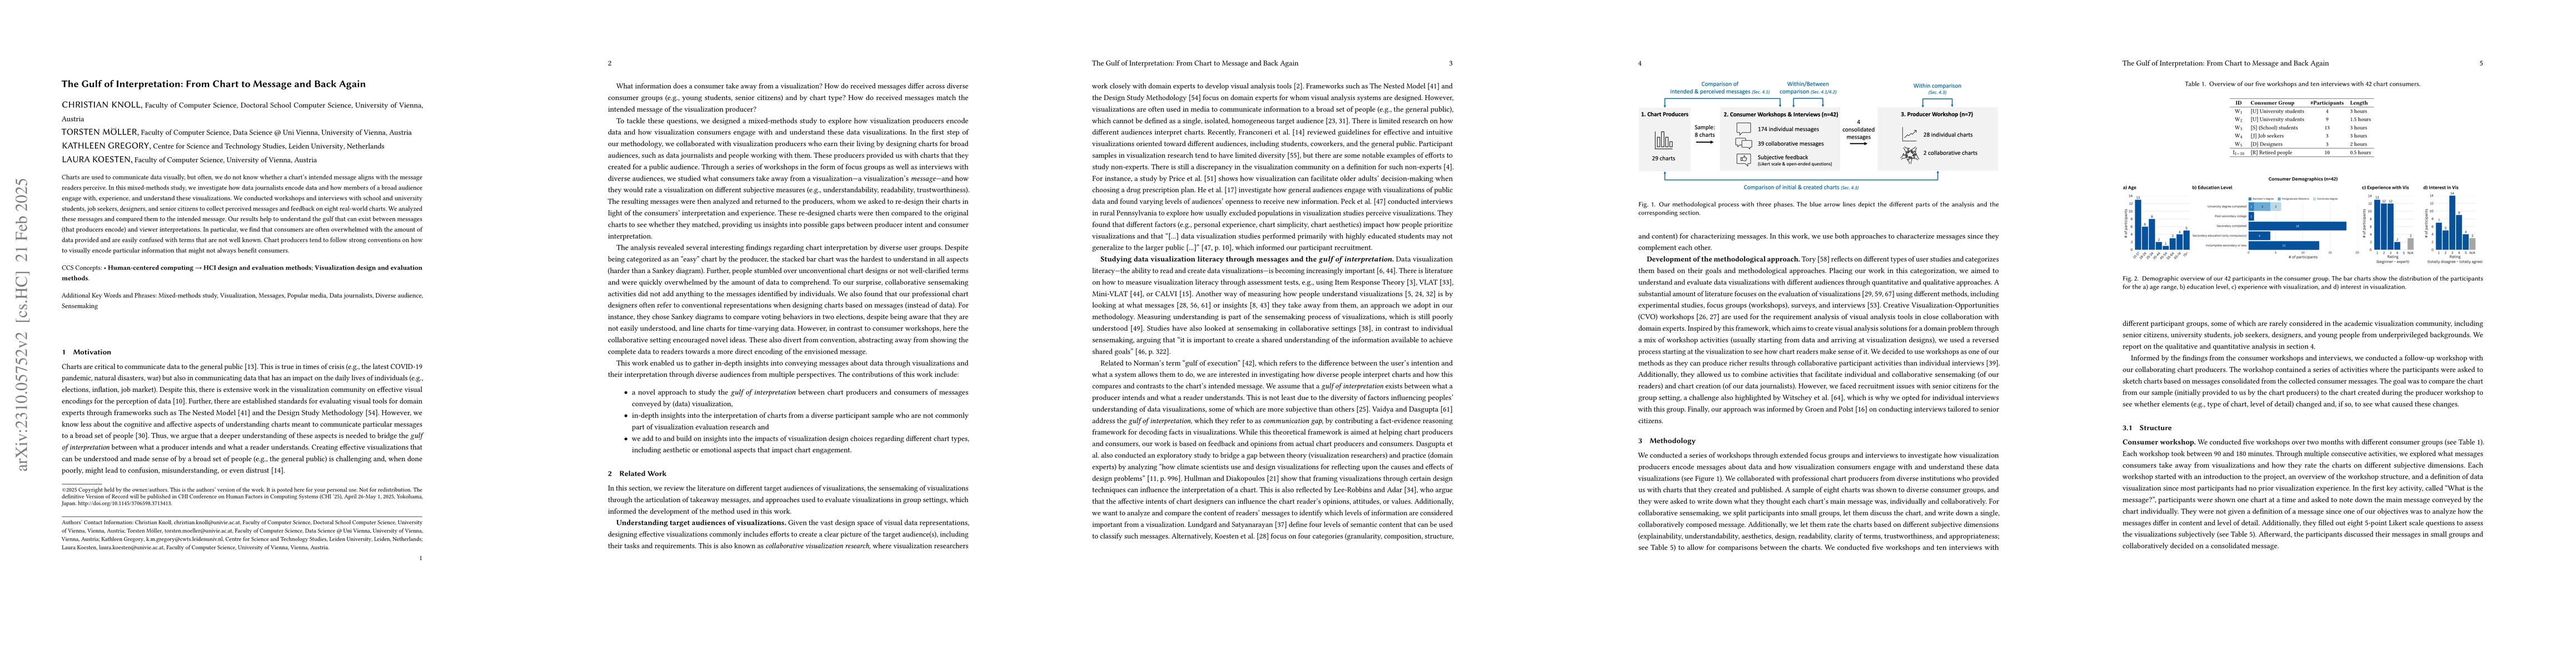
Charts are used to communicate data visually, but designing an effective chart that a broad set of people can understand is challenging. Usually, we do not know whether a chart's intended message aligns with the message readers perceive. In this mixed-methods study, we investigate how data journalists encode data and how a broad audience engages with, experiences, and understands these data visualizations. We conducted a series of workshops and interviews with school students, university students, job seekers, designers, and senior citizens to collect perceived messages and subjective feedback on a sample of eight real-world charts. We analyzed these messages and compared them to the intended message of the chart producer. Four of the collected messages from consumers were then provided to data journalists (including the ones that created the original charts) as a starting point to re-design the charts accordingly. The results from our work underline the difficulty of complex charts such as stacked bar charts and Sankey diagrams. Consumers are often overwhelmed with the amount of data provided and are easily confused with terms (as text) not well known. Chart producers tend to be faithful with data but are willing to abstract further when asked to transport particular messages visually. There are strong conventions on how to visually encode particular information that might not be to the benefit of many consumers.
Get AI-generated insights about this paper's methodology, results, and significance.
Current paper (gray), citations (green), references (blue)
No citations found for this paper.
Title | Authors | Year | Actions |
---|---|---|---|
Impact of interaction technique in interactive data visualisations: A study on lookup, comparison, and relation-seeking tasks
|
N. V. Berkel, Benjamin Tag, R. Jacobsen, Daniel Russo, H. Purchase, Daniel Buschek
|
2024
|
View Paper |
The Language of Infographics: Toward Understanding Conceptual Metaphor Use in Scientific Storytelling
|
Hana Pokojná, Tobias Isenberg, Stefan Bruckner, B. Kozlíková, L. Garrison
|
2024
|
View Paper |
GerontoVis: Data Visualization at the Confluence of Aging
|
Zack While, R. Crouser, Ali Sarvghad
|
2024
|
View Paper |
Enthusiastic and Grounded, Avoidant and Cautious: Understanding Public Receptivity to Data and Visualizations
|
H. He, Jagoda Walny, Sonja Thoma, Sheelagh Carpendale, Wesley Willett
|
2023
|
View Paper |
Affective Visualization Design: Leveraging the Emotional Impact of Data
|
Xingyu Lan, Yanqiu Wu, Nan Cao
|
2023
|
View Paper |
CALVI: Critical Thinking Assessment for Literacy in Visualizations
|
Lily W. Ge, Yuanling Cui, Matthew Kay
|
2023
|
View Paper |
Who Do We Mean When We Talk About Visualization Novices?
|
Alyxander Burns, C. Lee, Ria Chawla, Evan M. Peck, Narges Mahyar
|
2023
|
View Paper |
Troubling Collaboration: Matters of Care for Visualization Design Study
|
Derya Akbaba, Devin Lange, M. Correll, A. Lex, Miriah D. Meyer
|
2023
|
View Paper |
Mini‐VLAT: A Short and Effective Measure of Visualization Literacy
|
Saugat Pandey, Alvitta Ottley
|
2023
|
View Paper |
What is the message? Perspectives on Visual Data Communication
|
Laura Koesten, Kathleen Gregory, Regina Schuster, Christian Knoll, Sarah Davies, T. Möller
|
2023
|
View Paper |
Not As Easy As You Think - Experiences and Lessons Learnt from Trying to Create a Bottom-Up Visualization Image Typology
|
Jian Chen, Petra Isenberg, R. Laramee, Tobias Isenberg, M. Sedlmair, Torsten Moeller, Han-Wei Shen
|
2022
|
View Paper |
Affective Learning Objectives for Communicative Visualizations
|
Elsie Lee-Robbins, Eytan Adar
|
2022
|
View Paper |
Striking a Balance: Reader Takeaways and Preferences when Integrating Text and Charts
|
Chase Stokes, V. Setlur, Bridget Cogley, Arvind Satyanarayan, Marti A. Hearst
|
2022
|
View Paper |
The Science of Visual Data Communication: What Works
|
S. Franconeri, Lace M. K. Padilla, P. Shah, Jeffrey M. Zacks, J. Hullman
|
2021
|
View Paper |
Accessible Visualization via Natural Language Descriptions: A Four-Level Model of Semantic Content
|
Alan Lundgard, Arvind Satyanarayan
|
2021
|
View Paper |
The Impact of Familiarity on Visualizations of Spatial Uncertainty
|
J. Witt, Benjamin A. Clegg, L. D. Blalock, Amelia C. Warden
|
2021
|
View Paper |
Guidelines for Validation Interviews with Senior Citizens
|
Eduard C. Groen, S. Polst
|
2021
|
View Paper |
Understanding Data Visualization Design Practice
|
Paul C. Parsons
|
2021
|
View Paper |
The Next Billion Users of Visualization
|
Amit Jena, M. Butler, Tim Dwyer, K. Ellis, U. Engelke, Reuben Kirkham, K. Marriott, Cécile Paris, Venkatesh Rajamanickam, T. Rhyne
|
2021
|
View Paper |
Extending Recommendations for Creative Visualization-Opportunities Workshops
|
Christian Knoll, Asil Çetin, Torsten Möller, Miriah D. Meyer
|
2020
|
View Paper |
Knowing what to look for: A Fact-Evidence Reasoning Framework for Decoding Communicative Visualization
|
Sahaj Vaidya, Aritra Dasgupta
|
2020
|
View Paper |
How to evaluate data visualizations across different levels of understanding
|
Alyxander Burns, Cindy Xiong, S. Franconeri, A. Cairo, Narges Mahyar
|
2020
|
View Paper |
Data Visualization in Society
|
V. Lechner
|
2020
|
View Paper |
Reaching Broader Audiences With Data Visualization
|
Bongshin Lee, E. Choe, Petra Isenberg, K. Marriott, J. Stasko, T. Rhyne
|
2020
|
View Paper |
ConceptGraph: A Formal Model for Interpretation and Reasoning During Visual Analysis
|
Benjamin Karer, Inga Scheler, H. Hagen, H. Leitte
|
2020
|
View Paper |
What is Interaction for Data Visualization?
|
Evanthia Dimara, Charles Perin
|
2020
|
View Paper |
Data visualization literacy: Definitions, conceptual frameworks, exercises, and assessments
|
K. Börner, Andreas Bueckle, Michael Ginda
|
2019
|
View Paper |
Data is Personal: Attitudes and Perceptions of Data Visualization in Rural Pennsylvania
|
Evan M. Peck, Sofia E. Ayuso, Omar El-Etr
|
2019
|
View Paper |
The efficacy of stacked bar charts in supporting single-attribute and overall-attribute comparisons
|
Indratmo, Lee Howorko, Joyce Maria Boedianto, B. Daniel
|
2018
|
View Paper |
A Framework for Creative Visualization-Opportunities Workshops
|
E. Kerzner, Sarah Goodwin, J. Dykes, Sara Jones, Miriah D. Meyer
|
2018
|
View Paper |
Sense-making Strategies for the Interpretation of Visualizations - Bridging the Gap between Theory and Empirical Research
|
M. Pohl
|
2017
|
View Paper |
Engaging with (big) data visualizations: Factors that affect engagement and resulting new definitions of effectiveness
|
H. Kennedy, R. Hill, W. Allen, Andy Kirk
|
2016
|
View Paper |
Investigating aspects of data visualization literacy using 20 information visualizations and 273 science museum visitors
|
K. Börner, A. Maltese, R. N. Balliet, J. Heimlich
|
2016
|
View Paper |
Effects of Information Visualization on Older Adults’ Decision-Making Performance in a Medicare Plan Selection Task: A Comparative Usability Study
|
Margaux M. Price, Jessica J Crumley-Branyon, William Leidheiser, R. Pak
|
2016
|
View Paper |
How do People Make Sense of Unfamiliar Visualizations?: A Grounded Model of Novice's Information Visualization Sensemaking
|
Sukwon Lee, Sung-Hee Kim, Ya-Hsin Hung, Heidi Lam, Youn ah Kang, Ji Soo Yi
|
2016
|
View Paper |
Bridging Theory with Practice: An Exploratory Study of Visualization Use and Design for Climate Model Comparison
|
Aritra Dasgupta, Jorge Poco, Yaxing Wei, R. Cook, E. Bertini, Cláudio T. Silva
|
2015
|
View Paper |
Supporting Communication and Coordination in Collaborative Sensemaking
|
Narges Mahyar, Melanie Tory
|
2014
|
View Paper |
A Principled Way of Assessing Visualization Literacy
|
Jeremy Boy, Ronald A. Rensink, E. Bertini, Jean-Daniel Fekete
|
2014
|
View Paper |
Four Experiments on the Perception of Bar Charts
|
Justin Talbot, V. Setlur, Anushka Anand
|
2014
|
View Paper |
Selecting Semantically‐Resonant Colors for Data Visualization
|
Sharon Lin, Julie Fortuna, Chinmay Kulkarni, M. Stone, Jeffrey Heer
|
2013
|
View Paper |
Conducting interview studies: Challenges, lessons learned, and open questions
|
Jim Witschey, E. Murphy-Hill, Shundan Xiao
|
2013
|
View Paper |
Design Study Methodology: Reflections from the Trenches and the Stacks
|
M. Sedlmair, Miriah D. Meyer, T. Munzner
|
2012
|
View Paper |
Empirical Studies in Information Visualization: Seven Scenarios
|
Heidi Lam, E. Bertini, Petra Isenberg, C. Plaisant, Sheelagh Carpendale
|
2012
|
View Paper |
Visualization Rhetoric: Framing Effects in Narrative Visualization
|
J. Hullman, N. Diakopoulos
|
2011
|
View Paper |
Visualizing Thought
|
B. Tversky
|
2011
|
View Paper |
Crowdsourcing graphical perception: using mechanical turk to assess visualization design
|
Jeffrey Heer, M. Bostock
|
2010
|
View Paper |
Understanding together: sensemaking in collaborative information seeking
|
S. Paul, Madhu C. Reddy
|
2010
|
View Paper |
The Science of Interaction
|
W. Pike, J. Stasko, Remco Chang, T. O'Connell
|
2009
|
View Paper |
A Nested Model for Visualization Design and Validation
|
T. Munzner
|
2009
|
View Paper |
Defining Insight for Visual Analytics
|
Remco Chang, Caroline Ziemkiewicz, T. M. Green, W. Ribarsky
|
2009
|
View Paper |
Heuristics for information visualization evaluation
|
T. Zuk, L. Schlesier, Petra Neumann, Mark S. Hancock, Sheelagh Carpendale
|
2006
|
View Paper |
Toward measuring visualization insight
|
Chris North
|
2006
|
View Paper |
Three Approaches to Qualitative Content Analysis
|
H. Hsieh, S. Shannon
|
2005
|
View Paper |
Interactive Sankey diagrams
|
P. Riehmann, M. Hanfler, B. Fröhlich
|
2005
|
View Paper |
Evaluating Visualizations: Do Expert Reviews Work?
|
Melanie Tory, Torsten Möller
|
2005
|
View Paper |
Bars and lines: A study of graphic communication
|
Jeffery. M. Zacks, B. Tversky
|
1999
|
View Paper |
Focus Groups as a Knowledge Elicitation Technique: An Exploratory Survey
|
Anne P. Massey, W. Wallace
|
1991
|
View Paper |
Graphical Perception: Theory, Experimentation, and Application to the Development of Graphical Methods
|
W. Cleveland, R. McGill
|
1984
|
View Paper |
The Message
|
Christopher Pearse, James Q. Mulholland
|
1899
|
View Paper |
Scoping the future of visualization literacy: A review
|
2022
|
||
Color Aesthetic Enhancement for Categorical Data Visualization
|
W. C. Lim, Chee-Onn Wong, L. Wong
|
2021
|
View Paper |
Trust in Information Visualization
|
E. Mayr, Nicole Hynek, Saminu M. Salisu, F. Windhager
|
2019
|
View Paper |
VLAT: Development of a Visualization Literacy Assessment Test
|
Sukwon Lee, Sung-Hee Kim, Bum Chul Kwon
|
2017
|
View Paper |
User Studies in Visualization: A Reflection on Methods
|
Melanie Tory
|
2014
|
View Paper |
The Weirdest People in the World
|
Joseph Henrich
|
2009
|
View Paper |
Design of Everyday Things
|
D. Norman, J. Stasko, Jeff Pierce, C. Potts, Chris Shaw
|
1988
|
View Paper |
The Gulf of Interpretation: From Chart to Message and Back Again
|
|||
CHI ’25, April 26–May 01, 2025, Yokohama, Japan
|
|||
2022. When to Use Which User-Experience Research Methods
|
Showing first page preview. Click "Open Full PDF" to view the complete paper.
Your comment contains inappropriate language and has been rejected.
Are you sure you want to remove this tag? This action cannot be undone.
Someone just favorited a paper!
Comments (0)