This study examines how data visualizations in Scientific American communicate messages about climate change and pandemics, comparing interpretations by readers with the intended messages from producers. It proposes a message typology and explores understanding through the perspectives of charts, readers, and producers.
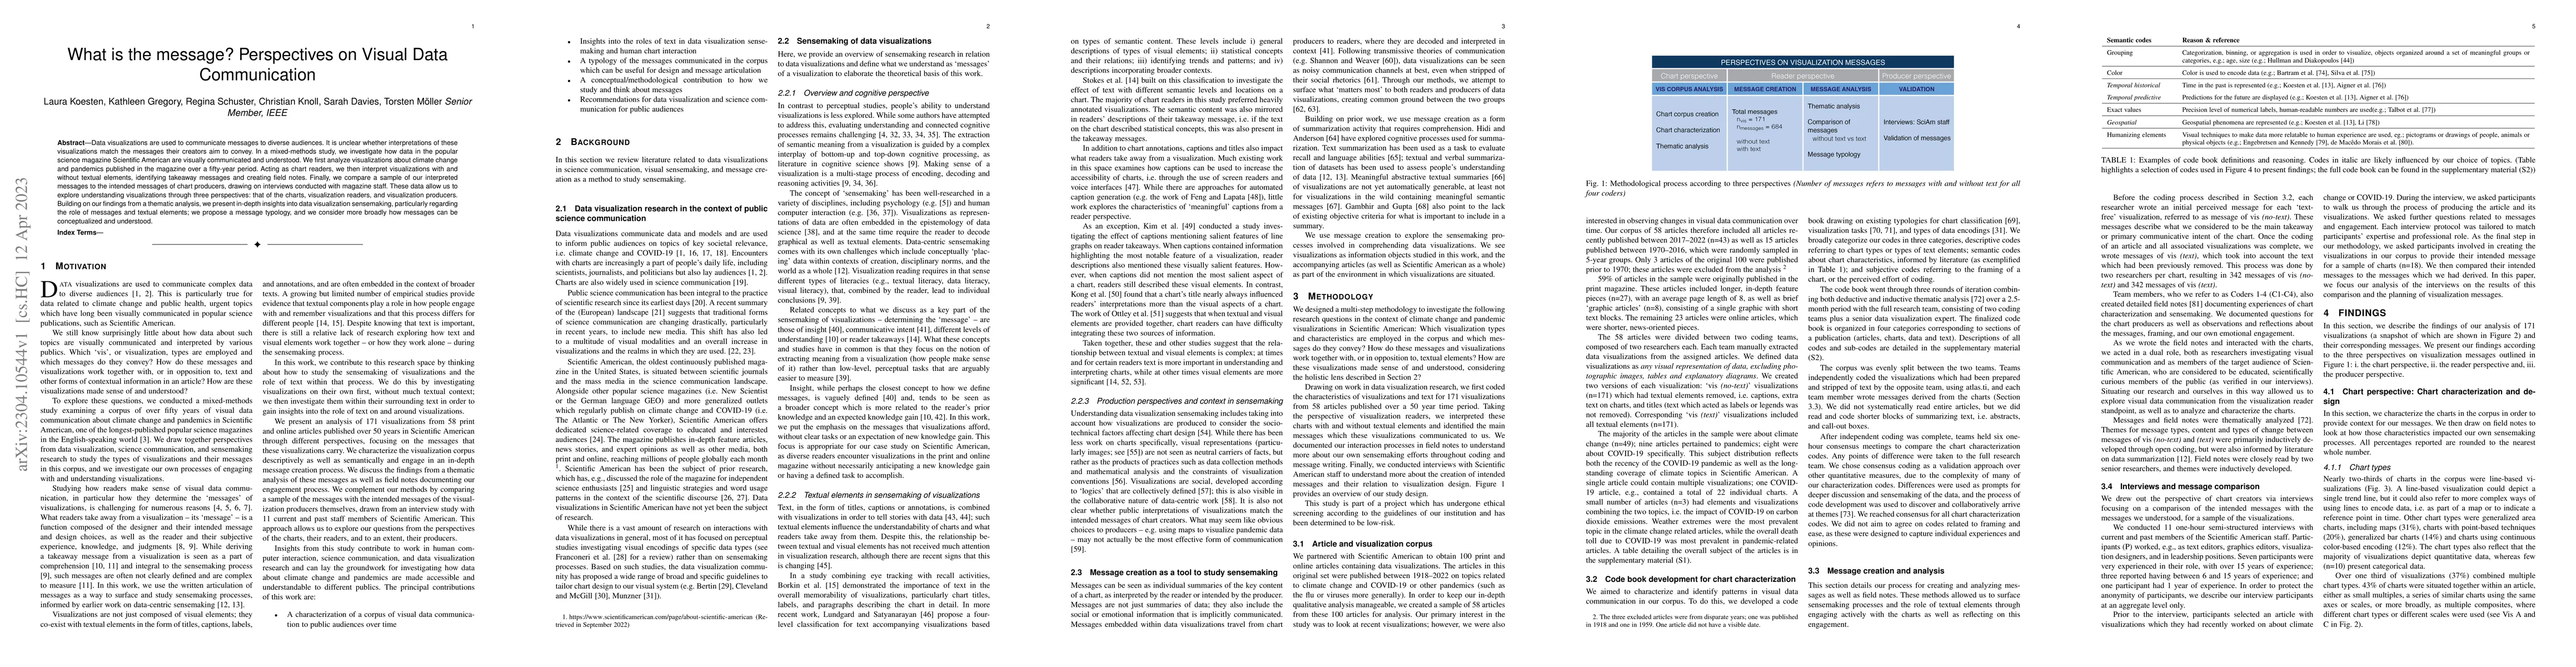
Data visualizations are used to communicate messages to diverse audiences. It is unclear whether interpretations of these visualizations match the messages their creators aim to convey. In a mixed-methods study, we investigate how data in the popular science magazine Scientific American are visually communicated and understood. We first analyze visualizations about climate change and pandemics published in the magazine over a fifty-year period. Acting as chart readers, we then interpret visualizations with and without textual elements, identifying takeaway messages and creating field notes. Finally, we compare a sample of our interpreted messages to the intended messages of chart producers, drawing on interviews conducted with magazine staff. These data allow us to explore understanding visualizations through three perspectives: that of the charts, visualization readers, and visualization producers. Building on our findings from a thematic analysis, we present in-depth insights into data visualization sensemaking, particularly regarding the role of messages and textual elements; we propose a message typology, and we consider more broadly how messages can be conceptualized and understood.
Get AI-generated insights about this paper's methodology, results, and significance.
Current paper (gray), citations (green), references (blue)
Laura Koesten, Torsten Möller, Kathleen Gregory et al.
Title | Authors | Year | Actions |
---|---|---|---|
A Survey on Annotations in Information Visualization: Empirical Insights, Applications, and Challenges
|
Md Dilshadur Rahman, Bhavana Doppalapudi, Ghulam Jilani Quadri, Paul Rosen
|
2024
|
View Paper |
The Gulf of Interpretation: From Chart to Message and Back Again
|
Christian Knoll, T. Möller, Kathleen Gregory, Laura Koesten
|
2023
|
View Paper |
Who is the Audience? Designing Casual Data Visualizations for the 'General Public'
|
Regina Schuster, Laura Koesten, T. Möller, Kathleen Gregory
|
2023
|
View Paper |
Title | Authors | Year | Actions |
---|---|---|---|
Give Text A Chance: Advocating for Equal Consideration for Language and Visualization
|
Chase Stokes, Marti A. Hearst
|
2024
|
View Paper |
Affective Learning Objectives for Communicative Visualizations
|
Elsie Lee-Robbins, Eytan Adar
|
2022
|
View Paper |
Striking a Balance: Reader Takeaways and Preferences when Integrating Text and Charts
|
Chase Stokes, V. Setlur, Bridget Cogley, Arvind Satyanarayan, Marti A. Hearst
|
2022
|
View Paper |
BeauVis: A Validated Scale for Measuring the Aesthetic Pleasure of Visual Representations
|
Tingying He, Petra Isenberg, Raimund Dachselt, Tobias Isenberg
|
2022
|
View Paper |
Interactive visualization literacy: The state-of-the-art
|
Elif E. Firat, Alark Joshi, R. Laramee
|
2022
|
View Paper |
The Science of Visual Data Communication: What Works
|
S. Franconeri, Lace M. K. Padilla, P. Shah, Jeffrey M. Zacks, J. Hullman
|
2021
|
View Paper |
Accessible Visualization via Natural Language Descriptions: A Four-Level Model of Semantic Content
|
Alan Lundgard, Arvind Satyanarayan
|
2021
|
View Paper |
From abstracts to “60-second science” podcasts: Reformulation of scientific discourse
|
Yunping Ye
|
2021
|
View Paper |
Communicating Visualizations without Visuals: Investigation of Visualization Alternative Text for People with Visual Impairments
|
C. Jung, Shubham Mehta, Atharva Kulkarni, Yuhang Zhao, Yea-Seul Kim
|
2021
|
View Paper |
A Survey of Perception-Based Visualization Studies by Task
|
Ghulam Jilani Quadri, P. Rosen
|
2021
|
View Paper |
Reading datasets: Strategies for interpreting the politics of data signification
|
Lindsay Poirier
|
2021
|
View Paper |
Deficit Lay or Deficit Expert: How Do “Experts” in Environmental Projects Perceive Lay People and Lay Knowledge?
|
Hatsue Koizumi, H. Yamashita
|
2021
|
View Paper |
The landscape of European science communication
|
S. Davies, S. Franks, Joseph Roche, A. L. Schmidt, R. Wells, Fabiana Zollo
|
2021
|
View Paper |
Can Anthropographics Promote Prosociality?A Review and Large-Sample Study
|
Luiz Morais, Yvonne Jansen, N. Andrade, Pierre Dragicevic
|
2021
|
View Paper |
Generating Accurate Caption Units for Figure Captioning
|
Xin Qian, Eunyee Koh, F. Du, Sungchul Kim, Joel Chan, Ryan A. Rossi, Sana Malik, Tak Yeon Lee
|
2021
|
View Paper |
Towards Understanding How Readers Integrate Charts and Captions: A Case Study with Line Charts
|
Dae Hyun Kim, V. Setlur, Maneesh Agrawala
|
2021
|
View Paper |
Visualizing
COVID
‐19 information for public: Designs, effectiveness, and preference of thematic maps
|
Rui Li
|
2020
|
View Paper |
Communicative Visualizations as a Learning Problem
|
Eytan Adar, Elsie Lee
|
2020
|
View Paper |
How to evaluate data visualizations across different levels of understanding
|
Alyxander Burns, Cindy Xiong, S. Franconeri, A. Cairo, Narges Mahyar
|
2020
|
View Paper |
Mapping the Landscape of COVID-19 Crisis Visualizations
|
Yixuan Zhang, Yifan Sun, Lace M. K. Padilla, Sumit Barua, E. Bertini, A. Parker
|
2020
|
View Paper |
VIS30K: A Collection of Figures and Tables From IEEE Visualization Conference Publications
|
Jian Chen, Meng Ling, Rui Li, Petra Isenberg, Tobias Isenberg, M. Sedlmair, Torsten Möller, R. Laramee, Han-Wei Shen, Katharina Wünsche, Qiru Wang
|
2020
|
View Paper |
The Coronavirus Exponential: A Preliminary Investigation into the Public's Understanding
|
Alexander R. Podkul, L. Vittert, Scott Tranter, A. Alduncin
|
2020
|
View Paper |
Data Visualization in Society
|
V. Lechner
|
2020
|
View Paper |
A multimodal perspective on data visualization
|
Tuomo Hiippala
|
2020
|
View Paper |
ConceptGraph: A Formal Model for Interpretation and Reasoning During Visual Analysis
|
Benjamin Karer, Inga Scheler, H. Hagen, H. Leitte
|
2020
|
View Paper |
Talking datasets: Understanding data sensemaking behaviours
|
Laura M. Koesten, Kathleen Gregory, Paul Groth, E. Simperl
|
2019
|
View Paper |
Reliability and Inter-rater Reliability in Qualitative Research
|
McDonaldNora, SchoenebeckSarita, ForteAndrea
|
2019
|
View Paper |
The Curse of Knowledge in Visual Data Communication
|
Cindy Xiong, Lisanne Van Weelden, S. Franconeri
|
2019
|
View Paper |
Would You Like A Chart With That? Incorporating Visualizations into Conversational Interfaces
|
Marti A. Hearst, Melanie Tory
|
2019
|
View Paper |
An Emotional Response to the Value of Visualization
|
Yun Wang, Adrien Segal, R. Klatzky, Daniel F. Keefe, Petra Isenberg, J. Hurtienne, E. Hornecker, Tim Dwyer, S. Barrass, T. Rhyne
|
2019
|
View Paper |
More than meets the eye: a longitudinal analysis of climate change imagery in the print media
|
S. O'Neill
|
2019
|
View Paper |
An automated approach for the recognition of intended messages in grouped bar charts
|
Richard Burns, S. Carberry, S. Schwartz
|
2019
|
View Paper |
Collaborative Practices with Structured Data: Do Tools Support What Users Need?
|
Laura M. Koesten, Emilia Kacprzak, J. Tennison, E. Simperl
|
2019
|
View Paper |
Abstractive summarization: An overview of the state of the art
|
Som Gupta, S. K. Gupta
|
2019
|
View Paper |
Enabling Spatio-Temporal Search in Open Data
|
S. Neumaier, A. Polleres
|
2019
|
View Paper |
Design Exposition with Literate Visualization
|
J. Wood, A. Kachkaev, J. Dykes
|
2019
|
View Paper |
Data Visualization in Scandinavian Newsrooms: Emerging Trends in Journalistic Visualization Practices
|
Martin Engebretsen, H. Kennedy, Wibke Weber
|
2018
|
View Paper |
Everything you always wanted to know about a dataset: studies in data summarisation
|
Laura M. Koesten, E. Simperl, Emilia Kacprzak, Tom Blount, J. Tennison
|
2018
|
View Paper |
The Feeling of Numbers: Emotions in Everyday Engagements with Data and Their Visualisation
|
H. Kennedy, R. Hill
|
2018
|
View Paper |
Information Visualization Evaluation Using Crowdsourcing
|
R. Borgo, L. Micallef, Benjamin Bach, F. McGee, Bongshin Lee
|
2018
|
View Paper |
Frames and Slants in Titles of Visualizations on Controversial Topics
|
H. Kong, Zhicheng Liu, Karrie Karahalios
|
2018
|
View Paper |
Vaunting the independent amateur: Scientific American and the representation of lay scientists
|
S. Johnston
|
2018
|
View Paper |
Digital political infographics: A rhetorical palette of an emergent genre
|
Eedan R. Amit-Danhi, L. Shifman
|
2018
|
View Paper |
Sense-making Strategies for the Interpretation of Visualizations - Bridging the Gap between Theory and Empirical Research
|
M. Pohl
|
2017
|
View Paper |
Communicating infectious disease prevalence through graphics: Results from an international survey
|
A. Fagerlin, T. Valley, A. Scherer, M. Knaus, E. Das, B. Zikmund‐Fisher
|
2017
|
View Paper |
Visual Narrative Flow: Exploring Factors Shaping Data Visualization Story Reading Experiences
|
Sean McKenna, N. Riche, Bongshin Lee, Jeremy Boy, Miriah D. Meyer
|
2017
|
View Paper |
Critique and Contribute: A Practice-Based Framework for Improving Critical Data Studies and Data Science
|
Gina Neff, A. Tanweer, Brittany Fiore-Gartland, Laura Osburn
|
2017
|
View Paper |
The Stuff of Bits: An Essay on the Materialities of Information
|
Paul Dourish
|
2017
|
View Paper |
Affective Color in Visualization
|
L. Bartram, Abhisekh Patra, M. Stone
|
2017
|
View Paper |
The Emerging Genre of Data Comics
|
Benjamin Bach, N. Riche, M. Carpendale, H. Pfister
|
2017
|
View Paper |
Storytelling with Data: Examining the Use of Data by Non-Profit Organizations
|
S. Erete, Emily Ryou, Geoff Smith, Khristina Marie Fassett, S. Duda
|
2016
|
View Paper |
Beyond Memorability: Visualization Recognition and Recall
|
M. Borkin, Z. Bylinskii, N. Kim, C. Bainbridge, Chelsea S. Yeh, Daniel Borkin, H. Pfister, A. Oliva
|
2016
|
View Paper |
How do People Make Sense of Unfamiliar Visualizations?: A Grounded Model of Novice's Information Visualization Sensemaking
|
Sukwon Lee, Sung-Hee Kim, Ya-Hsin Hung, Heidi Lam, Youn ah Kang, Ji Soo Yi
|
2016
|
View Paper |
Now I see it, now I don’t: researcher’s position and reflexivity in qualitative research
|
Roni Berger
|
2015
|
View Paper |
Visualization Analysis and Design
|
T. Munzner
|
2014
|
View Paper |
The Persuasive Power of Data Visualization
|
Anshul Vikram Pandey, A. Manivannan, O. Nov, Margaret L. Satterthwaite, E. Bertini
|
2014
|
View Paper |
A Multi-Level Typology of Abstract Visualization Tasks
|
M. Brehmer, T. Munzner
|
2013
|
View Paper |
A Systematic Review on the Practice of Evaluating Visualization
|
Tobias Isenberg, Petra Isenberg, Jing Chen, M. Sedlmair, Torsten Möller
|
2013
|
View Paper |
Extraction and interpretation of charts in technical documents
|
Jagadish S. Kallimani, K. Srinivasa, B. E. Reddy
|
2013
|
View Paper |
Automatic Caption Generation for News Images
|
Yansong Feng, Mirella Lapata
|
2013
|
View Paper |
Climate model simulation visualization from a visual studies perspective
|
B. Schneider
|
2012
|
View Paper |
Visual rationalities: Towards a sociology of images
|
R. Burri
|
2012
|
View Paper |
Visualization Rhetoric: Framing Effects in Narrative Visualization
|
J. Hullman, N. Diakopoulos
|
2011
|
View Paper |
Using color in visualization: A survey
|
S. Silva, B. Santos, Joaquim S. Madeira
|
2011
|
View Paper |
Narrative Visualization: Telling Stories with Data
|
E. Segel, Jeffrey Heer
|
2010
|
View Paper |
Mental Models, Visual Reasoning and Interaction in Information Visualization: A Top-down Perspective
|
Zhicheng Liu, J. Stasko
|
2010
|
View Paper |
An Extension of Wilkinson's Algorithm for Positioning Tick Labels on Axes
|
Justin Talbot, Sharon Lin, Pat Hanrahan
|
2010
|
View Paper |
Semiology of Graphics - Diagrams, Networks, Maps
|
Jacques Bertin, William J. Berg
|
2010
|
View Paper |
Recognizing the Intended Message of Line Graphs
|
Peng Wu, S. Carberry, S. Schwartz, D. Chester
|
2010
|
View Paper |
Using Visual Representations of Data to Enhance Sensemaking in Data Exploration Tasks
|
J. Baker, Donald R. Jones, J. Burkman
|
2009
|
View Paper |
The Visual Rhetoric of Data Displays: The Conundrum of Clarity
|
Charles Kostelnick
|
2007
|
View Paper |
The Effect of Aesthetic on the Usability of Data Visualization
|
Nick Cawthon, A. Moere
|
2007
|
View Paper |
Visualizing time-oriented data - A systematic view
|
W. Aigner, S. Miksch, Wolfgang Müller, H. Schumann, C. Tominski
|
2007
|
View Paper |
A Data–Frame Theory of Sensemaking
|
Gary Klein, Jennifer K. Phillips, Erica Rall, Deborah A. Peluso
|
2007
|
View Paper |
Making Sense of Sensemaking 1: Alternative Perspectives
|
Gary Klein, B. Moon, R. Hoffman
|
2006
|
View Paper |
Toward measuring visualization insight
|
Chris North
|
2006
|
View Paper |
The cost structure of sensemaking
|
D. Russell, M. Stefik, P. Pirolli, S. Card
|
1993
|
View Paper |
The Dominant View of Popularization: Conceptual Problems, Political Uses
|
S. Hilgartner
|
1990
|
View Paper |
Contributing to Discourse
|
H. H. Clark, E. Schaefer
|
1989
|
View Paper |
The externalized retina: Selection and mathematization in the visual documentation of objects in the life sciences
|
Michael Lynch
|
1988
|
View Paper |
Producing Written Summaries: Task Demands, Cognitive Operations, and Implications for Instruction
|
S. Hidi, Valerie Anderson
|
1986
|
View Paper |
Graphs in Scientific Publications
|
W. Cleveland
|
1984
|
View Paper |
Graphical Perception: Theory, Experimentation, and Application to the Development of Graphical Methods
|
W. Cleveland, R. McGill
|
1984
|
View Paper |
Toward a model of text comprehension and production.
|
W. Kintsch, T. A. Dijk
|
1978
|
View Paper |
Taxonomy of Educational Objectives. Handbook I: Cognitive Domain
|
B. Bloom, D. Krathwohl
|
1966
|
View Paper |
Common Ground
|
Reed Eli Ziegler Schwartz
|
1945
|
View Paper |
A History of American Magazines, Vol. II: 1850-1865. Frank Luther MottA History of American Magazines, Vol. III: 1865-1885. Frank Luther Mott
|
N. Wilt
|
1939
|
View Paper |
Visualization Insights From Jen Christiansen and Moritz Stefaner’s “175 Years of Word Usage Patterns in Scientific American”
|
Andy Kirk
|
2021
|
View Paper |
politics of data signification
|
2021
|
||
Visual Climate Communication: Making Facts and Concerns in Popular Science Magazines
|
D. Born
|
2020
|
View Paper |
the U.S. county excess deaths was more than one for most of the counties, a lot of them
|
2020
|
||
The Curious Case of Combining Text and Visualization
|
Alvitta Ottley, Aleksandra Kaszowska, R. Crouser, Evan M. Peck
|
2019
|
View Paper |
On Inconvenient Images: Exploring the Design Space of Engaging Climate Change Visualizations for Public Audiences
|
F. Windhager, Günther Schreder, E. Mayr
|
2019
|
View Paper |
VLAT: Development of a Visualization Literacy Assessment Test
|
Sukwon Lee, Sung-Hee Kim, Bum Chul Kwon
|
2017
|
View Paper |
Recent automatic text summarization techniques: a survey
|
Mahak Gambhir, Vishal Gupta
|
2016
|
View Paper |
“The re-emergence of emotional appeals in interactive data visualization,”
|
2016
|
||
The Sensemaking Process and Leverage Points for Analyst Technology as Identified Through Cognitive Task Analysis
|
P. Pirolli, Stuart Card
|
2015
|
View Paper |
Introduction: Representation in Scientific Practice Revisited
|
C. Coopmans, J. Vertesi, M. Lynch, S. Woolgar
|
2014
|
View Paper |
Writing Ethnographic Fieldnotes, Second Edition , ser. Chicago Guides to Writing, Editing, and Publishing
|
2011
|
||
“Using thematic analysis in psychology,”
|
2006
|
||
A Mathematical Theory of Communication
|
Jin Woo Shin, Sang Joon Kim
|
2006
|
View Paper |
Emotional design : why we love (or hate) everyday things
|
D. Norman
|
2004
|
View Paper |
A theory of graph comprehension.
|
S. Pinker
|
1990
|
View Paper |
Science and the Public
|
1915
|
View Paper | |
“Communicative information visualizations: How to make data more understandable by the general public,”
|
Showing first page preview. Click "Open Full PDF" to view the complete paper.
Your comment contains inappropriate language and has been rejected.
Are you sure you want to remove this tag? This action cannot be undone.
Someone just favorited a paper!
Comments (0)