The RSVP system facilitates domain scientists to independently create custom visualization dashboards for Visual Parameter Space Analysis (VPSA) by recommending task-oriented, multi-view visualizations based on abstracted data and tasks, derived from a meta design study. User studies demonstrate its usability and effectiveness in generating novel insights.
No key terms available for this paper.
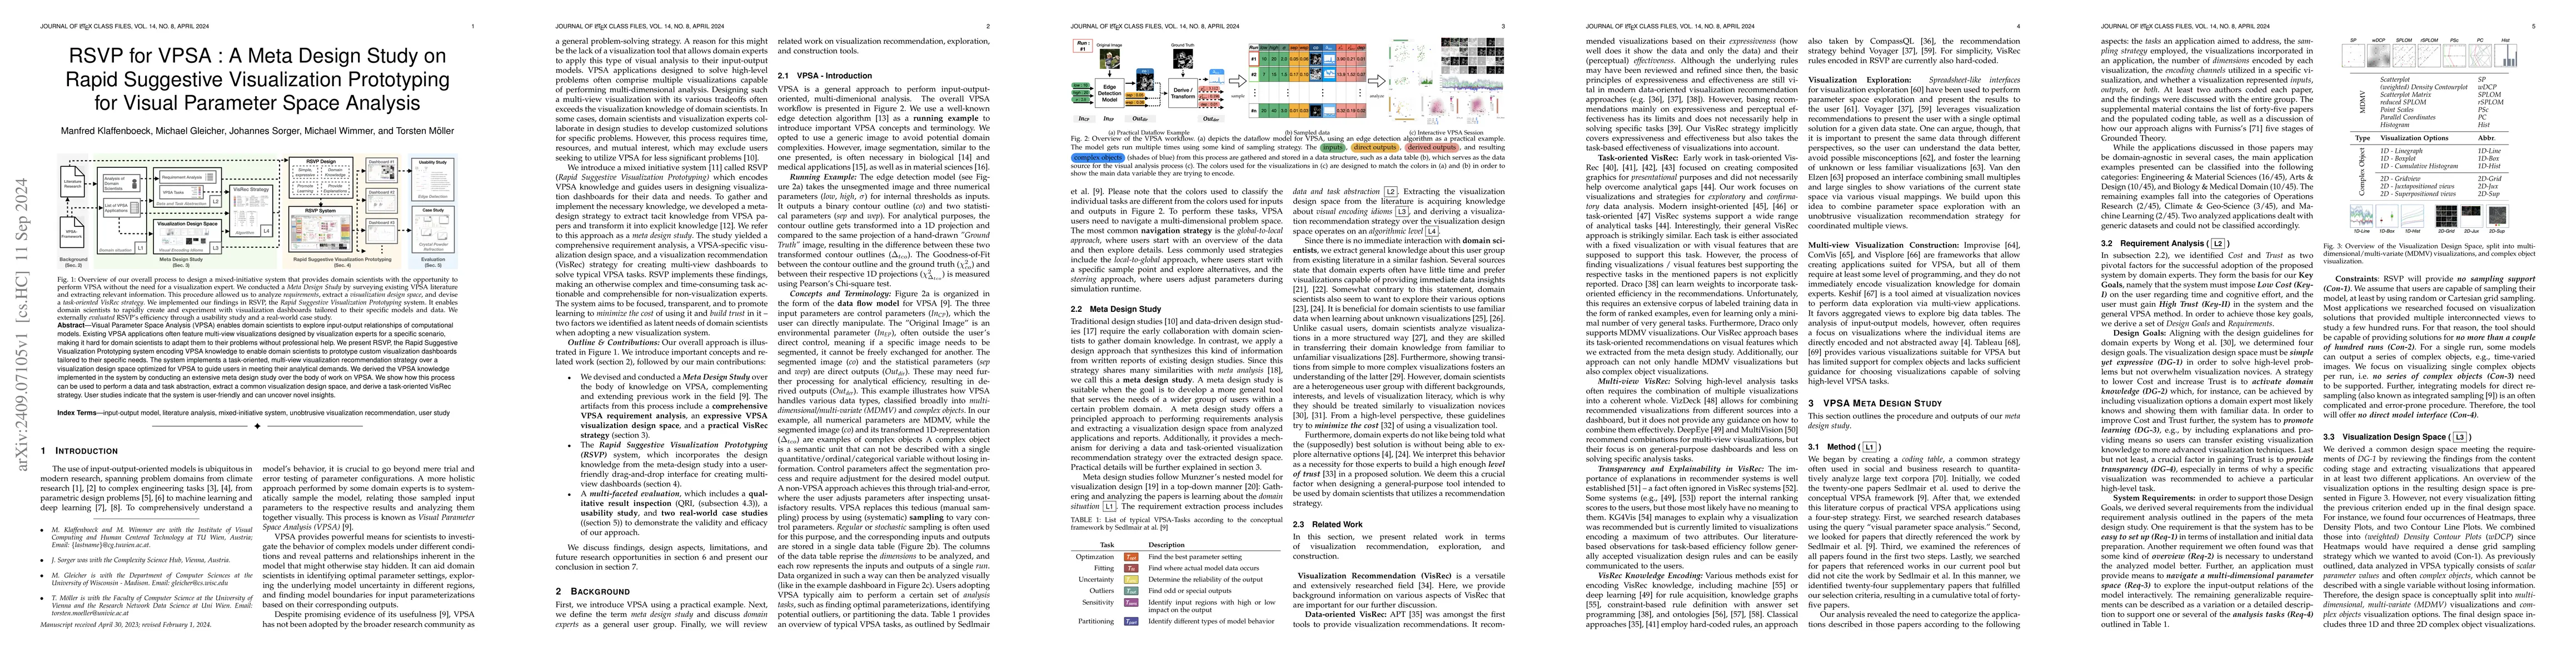
Visual Parameter Space Analysis (VPSA) enables domain scientists to explore input-output relationships of computational models. Existing VPSA applications often feature multi-view visualizations designed by visualization experts for a specific scenario, making it hard for domain scientists to adapt them to their problems without professional help. We present RSVP, the Rapid Suggestive Visualization Prototyping system encoding VPSA knowledge to enable domain scientists to prototype custom visualization dashboards tailored to their specific needs. The system implements a task-oriented, multi-view visualization recommendation strategy over a visualization design space optimized for VPSA to guide users in meeting their analytical demands. We derived the VPSA knowledge implemented in the system by conducting an extensive meta design study over the body of work on VPSA. We show how this process can be used to perform a data and task abstraction, extract a common visualization design space, and derive a task-oriented VisRec strategy. User studies indicate that the system is user-friendly and can uncover novel insights.
This graph shows how this paper is connected to other research. The current paper is shown in dark gray, papers that cite it are in green, and papers it references are in blue. You can:
• Hover over any node to see the paper title
• Click a node to view that paper's details
• Drag nodes to rearrange the graph
• Use the zoom controls (bottom right) to zoom in/out
Title | Authors | Year | Actions |
---|---|---|---|
Meta Design Studies: A Structured Approach for Deriving Domain-Oriented Visualization Recommendation Strategies
|
Manfred Klaffenboeck, †. TorstenMoeller, Michael Gleicher, Michael Wimmer
|
View Paper |
Title | Authors | Year | Actions |
---|---|---|---|
DMiner: Dashboard Design Mining and Recommendation
|
Yanna Lin, Haotian Li, Aoyu Wu, Yong Wang, Huamin Qu
|
2022
|
View Paper |
No Grammar to Rule Them All: A Survey of JSON-style DSLs for Visualization
|
A. Mcnutt
|
2022
|
View Paper |
KG4Vis: A Knowledge Graph-Based Approach for Visualization Recommendation
|
Haotian Li, Yong Wang, Songheng Zhang, Yangqiu Song, Huamin Qu
|
2021
|
View Paper |
Knowledge Rocks: Adding Knowledge Assistance to Visualization Systems
|
A. Lohfink, S. D. Antón, H. Leitte, Christoph Garth
|
2021
|
View Paper |
MultiVision: Designing Analytical Dashboards with Deep Learning Based Recommendation
|
Aoyu Wu, Yun Wang, Mengyu Zhou, Xinyi He, Haidong Zhang, Huamin Qu, Dongmei Zhang
|
2021
|
View Paper |
Deconstructing Categorization in Visualization Recommendation: A Taxonomy and Comparative Study
|
D. Lee, V. Setlur, Melanie Tory, Karrie Karahalios, Aditya G. Parameswaran
|
2021
|
View Paper |
Data-First Visualization Design Studies
|
Michael Oppermann, T. Munzner
|
2020
|
View Paper |
A survey on automatic infographics and visualization recommendations
|
Sujia Zhu, Guodao Sun, Qi Jiang, Meng Zha, Ronghua Liang
|
2020
|
View Paper |
VizCommender: Computing Text-Based Similarity in Visualization Repositories for Content-Based Recommendations
|
Michael Oppermann, R. Kincaid, T. Munzner
|
2020
|
View Paper |
PAVED: Pareto Front Visualization for Engineering Design
|
Lena Cibulski, H. Mitterhofer, T. May, J. Kohlhammer
|
2020
|
View Paper |
Divining Insights: Visual Analytics Through Cartomancy
|
A. Mcnutt, Anamaria Crisan, M. Correll
|
2020
|
View Paper |
How Domain Experts Create Conceptual Diagrams and Implications for Tool Design
|
Dor Ma'ayan, Wode Ni, Katherine Q. Ye, Chinmay Kulkarni, Joshua Sunshine
|
2020
|
View Paper |
Dziban: Balancing Agency & Automation in Visualization Design via Anchored Recommendations
|
Halden Lin, Dominik Moritz, Jeffrey Heer
|
2020
|
View Paper |
InSituNet: Deep Image Synthesis for Parameter Space Exploration of Ensemble Simulations
|
Wenbin He, Junpeng Wang, Hanqi Guo, Ko-Chih Wang, Han-Wei Shen, Mukund Raj, Y. Nashed, T. Peterka
|
2019
|
View Paper |
The Validity, Generalizability and Feasibility of Summative Evaluation Methods in Visual Analytics
|
Mosab Khayat, M. Karimzadeh, D. Ebert, A. Ghafoor
|
2019
|
View Paper |
A User-Centered Design Study in Scientific Visualization Targeting Domain Experts
|
Yucong Ye, F. Sauer, K. Ma, Aditya Konduri, Jacqueline H. Chen
|
2019
|
View Paper |
An Exploratory Study on Visual Exploration of Model Simulations by Multiple Types of Experts
|
N. Boukhelifa, A. Bezerianos, I. Trelea, N. Perrot, E. Lutton
|
2019
|
View Paper |
Formalizing Visualization Design Knowledge as Constraints: Actionable and Extensible Models in Draco
|
Dominik Moritz, Chenglong Wang, Greg L. Nelson, Halden Lin, Adam M. Smith, Bill Howe, Jeffrey Heer
|
2018
|
View Paper |
Towards Characterizing Domain Experts as a User Group
|
Yuet Ling Wong, K. Madhavan, N. Elmqvist
|
2018
|
View Paper |
VizML: A Machine Learning Approach to Visualization Recommendation
|
K. Hu, Michiel A. Bakker, Stephen Li, Tim Kraska, César A. Hidalgo
|
2018
|
View Paper |
Keshif: Rapid and Expressive Tabular Data Exploration for Novices
|
M. A. Yalçın, N. Elmqvist, B. Bederson
|
2018
|
View Paper |
Dream Lens: Exploration and Visualization of Large-Scale Generative Design Datasets
|
Justin Matejka, Michael Glueck, Erin Bradner, Ali Hashemi, Tovi Grossman, G. Fitzmaurice
|
2018
|
View Paper |
Design Patterns for Data Comics
|
Benjamin Bach, Zezhong Wang, Matteo Farinella, Dave Murray-Rust, N. Riche
|
2018
|
View Paper |
DeepEye: Towards Automatic Data Visualization
|
Yuyu Luo, Xuedi Qin, N. Tang, Guoliang Li
|
2018
|
View Paper |
The Role of Explicit Knowledge: A Conceptual Model of Knowledge-Assisted Visual Analytics
|
P. Federico, Markus Wagner, A. Rind, Albert Amor-Amoros, S. Miksch, W. Aigner
|
2017
|
View Paper |
Foresight: Recommending Visual Insights
|
Çağatay Demiralp, P. Haas, S. Parthasarathy, Tejaswini Pedapati
|
2017
|
View Paper |
Empirical Analysis of the Subjective Impressions and Objective Measures of Domain Scientists' Visual Analytic Judgments
|
Aritra Dasgupta, S. Burrows, Kyungsik Han, P. Rasch
|
2017
|
View Paper |
Voyager 2: Augmenting Visual Analysis with Partial View Specifications
|
Kanit Wongsuphasawat, Zening Qu, Dominik Moritz, Riley Chang, Felix Ouk, Anushka Anand, J. Mackinlay, Bill Howe, Jeffrey Heer
|
2017
|
View Paper |
PorosityAnalyzer: Visual analysis and evaluation of segmentation pipelines to determine the porosity in fiber-reinforced polymers
|
J. Weissenbock, A. Amirkhanov, E. Gröller, J. Kastner, C. Heinzl
|
2016
|
View Paper |
Towards a general-purpose query language for visualization recommendation
|
Kanit Wongsuphasawat, Dominik Moritz, Anushka Anand, J. Mackinlay, Bill Howe, Jeffrey Heer
|
2016
|
View Paper |
Simple is Good: Observations of Visualization Use Amongst the Big Data Digerati
|
D. Russell
|
2016
|
View Paper |
GEMSe: Visualization‐Guided Exploration of Multi‐channel Segmentation Algorithms
|
B. Fröhler, Torsten Möller, C. Heinzl
|
2016
|
View Paper |
Voyager: Exploratory Analysis via Faceted Browsing of Visualization Recommendations
|
Kanit Wongsuphasawat, Dominik Moritz, Anushka Anand, J. Mackinlay, Bill Howe, Jeffrey Heer
|
2016
|
View Paper |
How do People Make Sense of Unfamiliar Visualizations?: A Grounded Model of Novice's Information Visualization Sensemaking
|
Sukwon Lee, Sung-Hee Kim, Ya-Hsin Hung, Heidi Lam, Y. Kang, Ji Soo Yi
|
2016
|
View Paper |
Learning Visualizations by Analogy: Promoting Visual Literacy through Visualization Morphing
|
Puripant Ruchikachorn, K. Mueller
|
2015
|
View Paper |
Visualization Analysis and Design
|
T. Munzner
|
2014
|
View Paper |
Visual Parameter Space Analysis: A Conceptual Framework
|
M. Sedlmair, C. Heinzl, S. Bruckner, H. Piringer, Torsten Möller
|
2014
|
View Paper |
Extensible grids: uniform sampling on a space filling curve
|
Zhijian He, A. Owen
|
2014
|
View Paper |
Lyra: An Interactive Visualization Design Environment
|
Arvind Satyanarayan, Jeffrey Heer
|
2014
|
View Paper |
Supporting the integrated visual analysis of input parameters and simulation trajectories
|
M. Luboschik, Stefan Rybacki, Fiete Haack, Hans-Jörg Schulz
|
2014
|
View Paper |
A Design Space of Visualization Tasks
|
Hans-Jörg Schulz, T. Nocke, M. Heitzler, H. Schumann
|
2013
|
View Paper |
A Systematic Review on the Practice of Evaluating Visualization
|
Tobias Isenberg, Petra Isenberg, Jing Chen, M. Sedlmair, Torsten Möller
|
2013
|
View Paper |
Small Multiples, Large Singles: A New Approach for Visual Data Exploration
|
S. V. D. Elzen, J. V. Wijk
|
2013
|
View Paper |
VISO: a shared, formal knowledge base as a foundation for semi-automatic infovis systems
|
Jan Polowinski, M. Voigt
|
2013
|
View Paper |
Transfer of expertise: An eye tracking and think aloud study using dynamic medical visualizations
|
A. Gegenfurtner, M. Seppänen
|
2013
|
View Paper |
SUS: a retrospective
|
John Brooke
|
2013
|
View Paper |
Design Study Methodology: Reflections from the Trenches and the Stacks
|
M. Sedlmair, Miriah D. Meyer, T. Munzner
|
2012
|
View Paper |
A Visual Analysis Concept for the Validation of Geoscientific Simulation Models
|
A. Unger, Svenja Schulte, V. Klemann, D. Dransch
|
2012
|
View Paper |
Experiences in involving analysts in visualisation design
|
A. Slingsby, J. Dykes
|
2012
|
View Paper |
Vismon: Facilitating Analysis of Trade‐Offs, Uncertainty, and Sensitivity In Fisheries Management Decision Making
|
Maryam Booshehrian, T. Möller, R. Peterman, T. Munzner
|
2012
|
View Paper |
VizDeck: self-organizing dashboards for visual analytics
|
A. Key, Bill Howe, D. Perry, Cecilia R. Aragon
|
2012
|
View Paper |
Visualization of Parameter Space for Image Analysis
|
A. J. Pretorius, M. Bray, Anne E Carpenter, R. Ruddle
|
2011
|
View Paper |
Tuner: Principled Parameter Finding for Image Segmentation Algorithms Using Visual Response Surface Exploration
|
T. Torsney-Weir, A. Saad, Torsten Möller, H. Hege, Britta Weber, J. Verbavatz, Steven Bergner
|
2011
|
View Paper |
Information visualization evaluation in large companies: Challenges, experiences and recommendations
|
M. Sedlmair, Petra Isenberg, D. Baur, A. Butz
|
2011
|
View Paper |
Uncertainty‐Aware Exploration of Continuous Parameter Spaces Using Multivariate Prediction
|
Wolfgang Berger, H. Piringer, P. Filzmoser, E. Gröller
|
2011
|
View Paper |
Confessions from a grounded theory PhD: experiences and lessons learnt
|
D. Furniss, A. Blandford, P. Curzon
|
2011
|
View Paper |
Pargnostics: Screen-Space Metrics for Parallel Coordinates
|
Aritra Dasgupta, Robert Kosara
|
2010
|
View Paper |
Result-Driven Exploration of Simulation Parameter Spaces for Visual Effects Design
|
S. Bruckner, Torsten Möller
|
2010
|
View Paper |
Ensemble-Vis: A Framework for the Statistical Visualization of Ensemble Data
|
Kristin C. Potter, Andrew T. Wilson, P. Bremer, Dean N. Williams, C. Doutriaux, Valerio Pascucci, Chris R. Johnson
|
2009
|
View Paper |
Interactive Visual Analysis of Complex Scientific Data as Families of Data Surfaces
|
K. Matkovič, D. Gračanin, B. Klarin, H. Hauser
|
2009
|
View Paper |
A Nested Model for Visualization Design and Validation
|
T. Munzner
|
2009
|
View Paper |
A Multi-Threading Architecture to Support Interactive Visual Exploration
|
H. Piringer, C. Tominski, P. Muigg, Wolfgang Berger
|
2009
|
View Paper |
ComVis: A Coordinated Multiple Views System for Prototyping New Visualization Technology
|
K. Matkovič, W. Freiler, D. Gračanin, H. Hauser
|
2008
|
View Paper |
A Survey of Explanations in Recommender Systems
|
N. Tintarev, Judith Masthoff
|
2007
|
View Paper |
Pixnostics: Towards Measuring the Value of Visualization
|
Jörn Schneidewind, Mike Sips, D. Keim
|
2006
|
View Paper |
The value of visualization
|
J. V. Wijk
|
2005
|
View Paper |
Graph-theoretic scagnostics
|
Leland Wilkinson, Anushka Anand, R. Grossman
|
2005
|
View Paper |
Building Highly-Coordinated Visualizations in Improvise
|
C. Weaver
|
2004
|
View Paper |
Latin hypercube sampling and the propagation of uncertainty in analyses of complex systems
|
J. C. Helton, F. J. Davis
|
2002
|
View Paper |
Visualization Exploration and Encapsulation via a Spreadsheet-Like Interface
|
T. Jankun-Kelly, K. Ma
|
2001
|
View Paper |
Polaris: a system for query, analysis and visualization of multi-dimensional relational databases
|
Chris Stolte, Diane Tang, P. Hanrahan
|
2000
|
View Paper |
Practical Meta-Analysis
|
M. Lipsey, David B. Wilson
|
2000
|
View Paper |
A Comparison of Three Methods for Selecting Values of Input Variables in the Analysis of Output From a Computer Code
|
M. D. McKay, R. Beckman, W. Conover
|
2000
|
View Paper |
Principles of mixed-initiative user interfaces
|
E. Horvitz
|
1999
|
View Paper |
Encouraging coupled views for visualization exploration
|
Jonathan C. Roberts
|
1999
|
View Paper |
On encouraging multiple views for visualization
|
Jonathan C. Roberts
|
1998
|
View Paper |
Visual task characterization for automated visual discourse synthesis
|
Michelle X. Zhou, Steven K. Feiner
|
1998
|
View Paper |
A spreadsheet approach to information visualization
|
Ed H. Chi, J. Konstan, P. Barry, J. Riedl
|
1997
|
View Paper |
The eyes have it: a task by data type taxonomy for information visualizations
|
B. Shneiderman
|
1996
|
View Paper |
Sample Sizes for Usability Studies: Additional Considerations
|
James R. Lewis
|
1994
|
View Paper |
Interactive graphic design using automatic presentation knowledge
|
Steven F. Roth, John Kolojejchick, Joe Mattis, Jade Goldstein-Stewart
|
1994
|
View Paper |
Task-analytic approach to the automated design of graphic presentations
|
S. Casner
|
1991
|
View Paper |
A problem-oriented classification of visualization techniques
|
Stephen Wehrend, C. Lewis
|
1990
|
View Paper |
Design rationale: the argument behind the artifact
|
A. MacLean, R. Young, T. Moran
|
1989
|
View Paper |
A Computational Approach to Edge Detection
|
J. Canny
|
1986
|
View Paper |
Automating the design of graphical presentations of relational information
|
J. Mackinlay
|
1986
|
View Paper |
Introduction to Solid State Physics
|
A R Plummer
|
1967
|
View Paper |
TaskVis: Task-oriented Visualization Recommendation
|
Leixian Shen, Enya Shen, Zhiwei Tai, Yiran Song, Jianmin Wang
|
2021
|
View Paper |
Visual Ensemble Analysis to Study the Influence of Hyper-parameters on Training Deep Neural Networks
|
Sagad Hamid, Adrian Derstroff, S. Klemm, Quynh Quang Ngo, Xiaoyi Jiang, L. Linsen
|
2019
|
View Paper |
TreePOD: Sensitivity-Aware Selection of Pareto-Optimal Decision Trees
|
T. Mühlbacher, Lorenz Linhardt, Torsten Möller, H. Piringer
|
2018
|
View Paper |
Familiarity Vs Trust: A Comparative Study of Domain Scientists' Trust in Visual Analytics and Conventional Analysis Methods
|
Aritra Dasgupta, Joon-Yong Lee, Ryan Wilson, Robert A. Lafrance, Nick Cramer, Kristin A. Cook, S. Payne
|
2017
|
View Paper |
Multi-Resolution Climate Ensemble Parameter Analysis with Nested Parallel Coordinates Plots
|
Junpeng Wang, Xiaotong Liu, Han-Wei Shen, Guang Lin
|
2017
|
View Paper |
Characterizing Guidance in Visual Analytics
|
D. Ceneda, T. Gschwandtner, T. May, S. Miksch, Hans-Jörg Schulz, M. Streit, C. Tominski
|
2017
|
View Paper |
Iterating between Tools to Create and Edit Visualizations
|
Alex Bigelow, S. Drucker, Danyel Fisher, Miriah D. Meyer
|
2017
|
View Paper |
Visualization of Cultural Heritage Data for Casual Users
|
E. Mayr, P. Federico, S. Miksch, Günther Schreder, M. Smuc, F. Windhager
|
2016
|
View Paper |
Bridging the Gap of Domain and Visualization Experts with a Liaison
|
Svenja Simon, S. Mittelstädt, D. Keim, M. Sedlmair
|
2015
|
View Paper |
User interfaces supporting information visualization novices in visualization construction
|
Lars Grammel
|
2012
|
View Paper |
“HyperMoVal: Interactive visual validation of regression models for real-time simulation,”
|
2010
|
||
Determining Usability Test Sample Size
|
Carl W. Turner, James R. Lewis, J. Nielsen
|
2006
|
View Paper |
A Comparison of Questionnaires for Assessing Website Usability
|
T. Tullis, Jacqueline N. Stetson
|
2004
|
View Paper |
A Knowledge Task-Based Framework for Design and Evaluation of Information Visualizations
|
2004
|
||
Geometry and Computational Design (GCD). His academic career started with his M.Sc. in 1997 at TU Wien, where he also obtained his Ph.D.
|
2001
|
||
Eurographics/ Ieee-vgtc Symposium on Visualization 2008 from Web Data to Visualization via Ontology Mapping
|
A. Vilanova, A. Telea, G. Scheuermann, T. Möller, O. Gilson, N. Silva, P. W. Grant, M. Chen
|
View Paper | |
PREPRINT VERSION
|
|||
“Tableau,”
|
Showing first page preview. Click "Open Full PDF" to view the complete paper.
Zijian Ding, Joel Chan
Published: 2024-03-22
Andreas Knoblauch
Published: 2024-07-22
Xinyi Zhang, Huiguang He, Wei Wei, Shuang Qiu, Fu Li, Xujin Li
Published: 2025-01-06
You need to log in to post a comment.
Your comment contains inappropriate language.
Are you sure you want to remove this tag?
Someone just favorited a paper!
Comments (0)